Smartphone Usage in Australia 2026
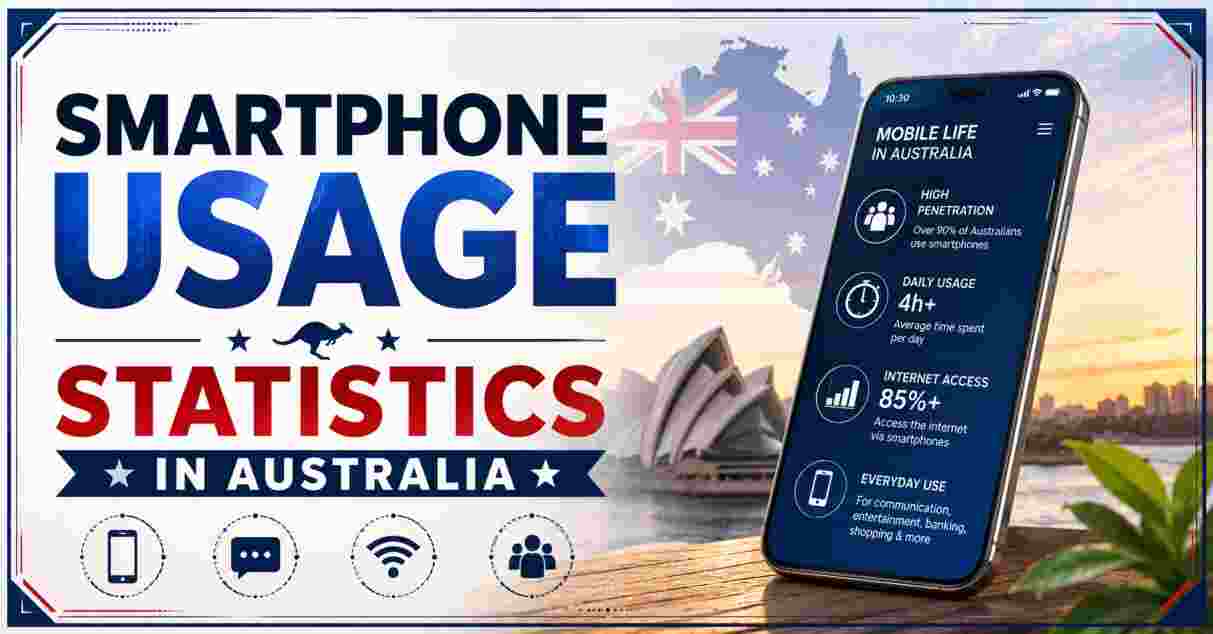
Smartphone usage in Australia has reached one of the highest saturation levels anywhere in the world by 2026, with penetration estimates ranging from 87% to well over 90% of the population depending on methodology, translating to roughly 23.6 million active smartphone users across the country. Australians now spend an average of 6 hours and 8 minutes online every day — close to a full-time job’s worth of screen exposure each week — with mobile devices accounting for the majority of that time and dominating everyday tasks from banking and navigation to entertainment and messaging. The smartphone has effectively become Australia’s default computing device, having long since overtaken the desktop and even the laptop as the primary way most Australians access the internet.
What makes 2026 a genuinely pivotal year to examine Australian smartphone statistics is the collision of two major forces: continued growth in raw screen time and mobile data consumption, and the world’s first nationwide under-16 social media ban, which took effect on 10 December 2025 and has since become the most closely watched piece of digital-wellbeing legislation on the planet. Early results from that ban — including how effectively (or ineffectively) it has actually reduced smartphone-based social media access among Australian teenagers — are now shaping national conversation around smartphone use, attention spans, and youth wellbeing in a way that wasn’t happening even a year earlier. This report compiles the most current, verified smartphone usage statistics for Australia in 2026, covering ownership rates, daily screen time, age-based usage patterns, device and platform data, mobile traffic trends, and the early data on the under-16 ban’s real-world impact.
Interesting Facts About Smartphone Usage in Australia 2026
| Metric | Figure |
|---|---|
| Australian smartphone penetration (2026 estimate) | Well over 90% (some estimates ~87%) |
| Total active smartphone users | ~23.6 million |
| Average daily online time (all devices) | 6 hours 8 minutes |
| Ages 16-24 daily online time | 7 hours 18 minutes |
| Ages 65+ daily online time | 4 hours 23 minutes |
| Mobile share of all web traffic (January 2026) | 61.9% |
| iOS market share (Australia) | ~54% |
| Android market share (Australia) | ~44% |
| Under-16 social media accounts removed by mid-December 2025 | 4.7 million |
| Under-16s still using restricted platforms, 3 months after ban | More than 81% |
Source: ROI.com.au Australian Internet Usage Statistics 2026, Red Search Australian Mobile Phone Statistics 2026, eSafety Commissioner, Reuters/ABC News reporting on the under-16 social media ban
The standout figure is just how close Australia’s daily online time (6 hours 8 minutes) sits to a full working week when totaled up — roughly 41 hours weekly, meaning the average Australian now spends nearly as much time connected to the internet as they do at a full-time job. With mobile devices driving 61.9% of all web traffic as of January 2026, it’s clear the smartphone specifically, rather than the internet in general, is the primary engine behind this figure, especially once you account for the fact that most of that “online time” measurement spans smartphones, tablets, and computers combined rather than phones alone.
The under-16 ban statistics tell an equally important story about the limits of policy in the face of deeply entrenched smartphone habits: despite social media platforms removing 4.7 million under-16 accounts in the ban’s first month, independent research three months later found more than 81% of Australian teenagers were still accessing at least one restricted platform, primarily because age-verification systems proved far easier to circumvent than regulators had hoped. This gap between the ban’s intended effect and its measured real-world impact has become one of the most closely scrutinized case studies globally in whether legislation alone can meaningfully change smartphone behavior among young, highly motivated users.
Australia Smartphone Ownership and Penetration Statistics 2026
| Metric | Figure |
|---|---|
| Red Search estimate, early 2026 | Well over 90% |
| Statista long-range forecast (made in 2017, for 2026) | 87% |
| Total smartphone users implied by 87% penetration | ~23.6 million |
| Growth in users, 2017 to 2026 | 19.9 million to 23.6 million (+3.7 million) |
| Ages 18-24 smartphone ownership (historical Deloitte benchmark) | 94%+ |
| Australia and New Zealand market saturation | Penetration rates exceeding 100% (multi-device ownership) |
Source: Red Search, Statista, Deloitte Mobile Consumer Survey, IndexBox Australia and Oceania Mobile Phone Market Report 2026
Smartphone penetration in Australia has climbed steadily for well over a decade, and by 2026 the country sits among the most smartphone-saturated populations globally, with recent industry estimates placing penetration well over 90% of the population, while a longer-range Statista forecast made back in 2017 projected a more conservative 87% figure for 2026 — a useful reminder that penetration estimates vary meaningfully depending on survey methodology, sample recency, and whether “population” refers to all Australians or just those old enough to plausibly own a device. Either measure confirms roughly 23.6 million Australians now actively use a smartphone, up from 19.9 million back in 2017, an increase of 3.7 million users over the period.
Market researchers specifically flag Australia, alongside New Zealand, as having reached genuine saturation in the mobile phone market, with penetration rates that technically exceed 100% once multiple-device ownership per person is factored in — meaning growth in the sector is now driven almost entirely by device replacement cycles rather than new user acquisition. This saturation is especially pronounced among younger Australians, with historical Deloitte survey data showing 94%+ ownership among the 18-24 age bracket even years before 2026, a figure that has likely only crept closer to full saturation in the years since. For readers curious how this smartphone-driven digital landscape connects to specific platform usage, our Australia Social Media Statistics report breaks down exactly which apps and platforms Australians spend that screen time on.
Australia Daily Screen Time and Online Usage Statistics 2026
| Metric | Figure |
|---|---|
| Average Australian daily online time (all devices) | 6 hours 8 minutes |
| Weekly equivalent | ~41 hours |
| Ages 16-24 daily online time | 7 hours 18 minutes |
| Ages 65+ daily online time | 4 hours 23 minutes |
| Trend since 2022 | Broadly stable |
| Historical device-specific smartphone screen time (consumer survey) | 5.5 hours/day |
Source: ROI.com.au Australian Internet Usage & Digital Behaviour Statistics 2026, Reviews.org Australia
Australians now average 6 hours and 8 minutes online every day across all connected devices, equivalent to roughly 41 hours a week — a figure researchers have noted is “about the same as a full-time job” once totaled across a standard working week. Age remains the strongest predictor of this daily usage: the 16-24 age bracket tops the national average considerably at 7 hours 18 minutes per day, while Australians aged 65 and older spend a comparatively modest 4 hours 23 minutes online daily, a gap of nearly 3 hours between the youngest and oldest tracked cohorts.
Notably, industry analysts tracking this data through ROI.com.au report that daily screen time in Australia has been “broadly stable since 2022,” suggesting the explosive growth phase of smartphone-driven internet consumption that characterized the 2010s and pandemic years has largely plateaued, with Australians now settling into a fairly consistent daily digital routine rather than continuing to add new hours of screen time each year. Separately, consumer-survey research focused specifically on phone-only screen time (rather than all-device online time) has previously put the average smartphone-specific figure at around 5.5 hours daily, illustrating that a meaningful share of Australians’ total online time is concentrated on the smartphone specifically rather than spread evenly across computers, tablets, and other connected devices.
Australia Smartphone Usage by Age Group Statistics 2026
| Age Group | Daily Online Time |
|---|---|
| Ages 16-24 | 7 hours 18 minutes |
| National average (all adults) | 6 hours 8 minutes |
| Ages 65+ | 4 hours 23 minutes |
| Gap between youngest and oldest tracked groups | 2 hours 55 minutes |
| Ages 18-24 smartphone ownership (historical benchmark) | 94%+ |
| Generation reporting screen time as roughly double the pre-1965 cohort | Gen X and Millennials |
Source: ROI.com.au, Reviews.org Australia generational screen-time research
The generational divide in Australian smartphone and internet usage is substantial, with the 16-24 age group spending nearly three hours more per day online than Australians aged 65 and older — a gap that reflects both differing life-stage demands (study, early career, and social life driving heavier connectivity needs among younger Australians) and genuine generational differences in how comfortable each cohort is with spending extended time on a connected device. Independent consumer research has separately found that Australians born before 1965 report notably lower screen time than younger cohorts, with usage among Gen X and Millennial Australians running at roughly double that of the pre-1965 generation.
This age-based usage gradient carries real implications for how businesses, health authorities, and policymakers approach digital-wellbeing messaging in Australia: a one-size-fits-all screen-time guideline makes little sense when the gap between the most and least connected adult age brackets spans nearly 3 hours daily. It also helps explain why so much of the national policy conversation around smartphone harm — including the under-16 social media ban discussed later in this report — has focused specifically on younger Australians, since usage intensity and behavioral patterns among teens and young adults diverge so sharply from the rest of the population.
Australia Mobile Operating System and Device Statistics 2026
| Metric | Figure |
|---|---|
| iOS market share (Australia) | ~54% |
| Android market share (Australia) | ~44% |
| Other OS (Windows, Samsung OS, etc.) | ~2% |
| iOS peak year | 2023 (62%) |
| Global smartphone brand leaders (StatCounter, Feb 2026) | Apple 31.48%, Samsung 21.38% |
| 5G Standalone leader (Australia) | Optus, ~80.5% population coverage |
Source: Red Search iOS & Android Mobile Operating System Statistics Australia, StatCounter
Apple’s iOS has consistently held the dominant position in Australia’s mobile operating system market, sitting at roughly 54% market share against Android’s 44% as of the most recent tracked data, with iOS having peaked even higher at 62% back in 2023 before ceding some ground back to Android in the years since. This iOS-leaning market stands in contrast to the broader global smartphone landscape, where Apple’s worldwide brand share sits at a comparatively modest 31.48% against Samsung’s 21.38%, according to StatCounter’s February 2026 tracking — underscoring that Australia is a notably more Apple-skewed market than the global average, likely reflecting both higher average household income and strong cultural brand loyalty toward iPhone among Australian consumers.
Beyond the device itself, network infrastructure continues to mature rapidly across the country, with 5G Standalone technology reaching a high level of coverage maturity by early 2026 — Optus alone covers approximately 80.5% of the population with its 5G network, a figure that reflects the intensifying race among Australia’s major telcos to deliver the low-latency, high-speed connectivity increasingly required by data-hungry smartphone applications, from cloud gaming to AI-powered assistants now built directly into flagship devices.
Australia Mobile Internet Traffic and Data Usage Statistics 2026
| Metric | Figure |
|---|---|
| Mobile share of all web traffic (January 2026) | 61.9% |
| Smartphone use case: communication and social | Largest share of daily usage |
| Smartphone use case: utility and finance | Navigation, digital payments, money transfers |
| Average weekly online time (all devices) | ~41 hours |
| Australia smartphone market value (2024) | USD $5.62 billion |
| Australia smartphone market value (2030 projection) | USD $6.31 billion |
Source: Red Search Australian Mobile Phone Statistics 2026 (via Ookla and StatCounter data), Research and Markets Australia Smartphone Market Report
Mobile devices now account for 61.9% of all web traffic generated in Australia as of January 2026, confirming that when Australians go online, the smartphone is now the default entry point for the clear majority of that activity rather than the exception. Beyond raw browsing, Australians increasingly treat their smartphones as genuine all-in-one utility tools — replacing physical phonebooks, paper maps, dedicated cameras, calculators, clocks, and even books — with the two largest categories of daily smartphone use being communication and social activity, followed closely by utility and finance tasks like navigation, digital payments, and money transfers.
The commercial scale behind this usage pattern is reflected in market valuation data: Australia’s smartphone market was valued at USD $5.62 billion in 2024, and is projected to grow to USD $6.31 billion by 2030 — a comparatively modest 2.01% CAGR that reflects the market’s maturity and saturation rather than any slowdown in actual smartphone usage, since device replacement cycles rather than new user growth are now the primary driver of market value in an already near-fully-penetrated country. For readers interested in how specific apps capture this heavy mobile traffic, our Australia TikTok Statistics report details engagement on one of the platforms most closely associated with heavy day-to-day smartphone session time in the country.
Australia Under-16 Social Media Ban and Youth Smartphone Statistics 2026
| Metric | Figure |
|---|---|
| Ban implementation date | 10 December 2025 |
| Under-16 accounts removed by mid-December 2025 | 4.7 million |
| Account ownership among 10-15 year-olds, before ban | 52% |
| Account ownership among 10-15 year-olds, 3 months after ban | 42% |
| Under-16s still accessing at least one restricted platform, 3 months post-ban | More than 81% |
| Teens reporting daily social media use, post-ban | 58% (barely down from ~60% pre-ban) |
| Maximum platform non-compliance fine | Up to A$49.5-54.6 million |
Source: eSafety Commissioner, Reuters, ABC News, Al Jazeera reporting on the Australian Social Media Minimum Age law
Australia’s Social Media Minimum Age law, which took effect on 10 December 2025 and made the country the first in the world to enact a nationwide under-16 social media ban, led to platforms removing 4.7 million under-16 accounts within its first month, according to the eSafety Commissioner. Account ownership among the 10-15 age bracket did fall measurably as a result, dropping from 52% before the ban to 42% three months later, with eSafety noting “statistically significant” reductions specifically across YouTube, Snapchat, and TikTok.
However, the ban’s effect on actual usage has proven far more limited than its effect on formal account ownership: independent research three months after implementation found more than 81% of Australian teenagers were still accessing at least one age-restricted platform, and 58% continued reporting daily social media use — barely down from the roughly 60% daily-use rate recorded before the ban took effect. Researchers attributed this gap primarily to weak age-verification enforcement by the platforms themselves, with methods as simple as self-declaring an incorrect birth date proving sufficient to bypass restrictions for a meaningful share of affected teens, alongside more sophisticated workarounds like VPNs and shared parental logins — findings that have made Australia’s ban a closely watched real-world test case for whether legislative restrictions alone can meaningfully shift deeply ingrained youth smartphone behavior. For a deeper breakdown of the law’s mechanics, enforcement posture, and platform-by-platform compliance data, our Social Media Age Restriction in Australia Statistics report covers the full regulatory picture in detail.
Australia Smartphone Attention and Digital Wellbeing Statistics 2026
| Metric | Figure |
|---|---|
| Estimated lifetime years spent on smartphone (based on 5.5 hrs/day) | 16.6 years |
| Share of waking life this represents | ~33% |
| Pre-1965 generation daily screen time (historical benchmark) | ~3 hours |
| Gen X / Millennial daily screen time (historical benchmark) | ~Double pre-1965 cohort |
| Gen Z daily screen time (historical benchmark) | 7.3 hours |
| Global daily phone check frequency (comparative context) | 58-96+ times per day |
Source: Reviews.org Australia lifetime screen-time research, Exploding Topics comparative global data
Putting Australia’s smartphone usage figures into lifetime perspective produces a genuinely striking statistic: based on an average daily usage rate of around 5.5 hours and typical smartphone ownership beginning around age 10, Australians can expect to spend roughly 16.6 years of their total lifetime looking at a smartphone screen — equivalent to about 33% of all waking hours across a typical life expectancy. That figure varies enormously by generation, with Gen Z Australians reporting daily screen time of around 7.3 hours, more than double the roughly 3 hours reported by Australians born before 1965.
While Australia lacks its own dedicated, large-scale phone-pickup-frequency dataset comparable to some other countries’ tracking studies, global comparative research puts typical daily phone checks somewhere between 58 and 96+ times depending on methodology and country, and given Australia’s above-average daily online time and near-universal smartphone penetration, it’s a reasonable inference that Australian check-frequency sits within a broadly similar range to other highly-connected, high-income countries. This lifetime-scale framing has increasingly featured in Australian public health and digital-wellbeing discourse, feeding directly into the political momentum that helped drive the under-16 social media ban and broader conversations about age-appropriate smartphone use across the population.
Australia Smartphone App and Platform Usage Statistics 2026
| Metric | Figure |
|---|---|
| TikTok average monthly time spent, Android users (Australia) | 38 hours 51 minutes |
| TikTok average monthly sessions | 304 |
| TikTok share of internet users using the platform | 44.1% |
| TikTok adult (18+) user base, early 2025 | 8.01 million |
| TikTok share of Australia’s total adult population | 38% |
| Social media users, Australia (broader estimate) | Roughly 4 in 5 Australians |
Source: Australia TikTok and Social Media reports (2025-2026 data)
Individual platform-level data underscores just how concentrated Australia’s smartphone screen time has become around a small number of highly engaging apps: TikTok alone commanded an average of 38 hours 51 minutes of monthly usage among Android users in Australia — more than any other platform tracked — while also generating 304 average monthly sessions per user, ranking it among the “stickiest” apps in the entire Australian mobile ecosystem. With 8.01 million adult users representing 38% of Australia’s total adult population using the platform as of early 2025, TikTok’s usage intensity offers a useful microcosm of the broader national smartphone story: extremely high reach combined with extraordinarily deep, session-heavy engagement.
More broadly, roughly four in five Australians are active social media users of some kind, a figure that helps explain why smartphone screen time and social media usage statistics track so closely together across virtually every age bracket and platform measured in this report. As Australia’s under-16 ban, generational usage gaps, and near-universal smartphone penetration all continue evolving through the remainder of 2026, this tight coupling between smartphone ownership, mobile-first internet access, and deep platform-level engagement is likely to remain the defining feature of the country’s digital landscape for the foreseeable future.
Disclaimer: The data research report we present here is based on information found from various sources. We are not liable for any financial loss, errors, or damages of any kind that may result from the use of the information herein. We acknowledge that though we try to report accurately, we cannot verify the absolute facts of everything that has been represented.