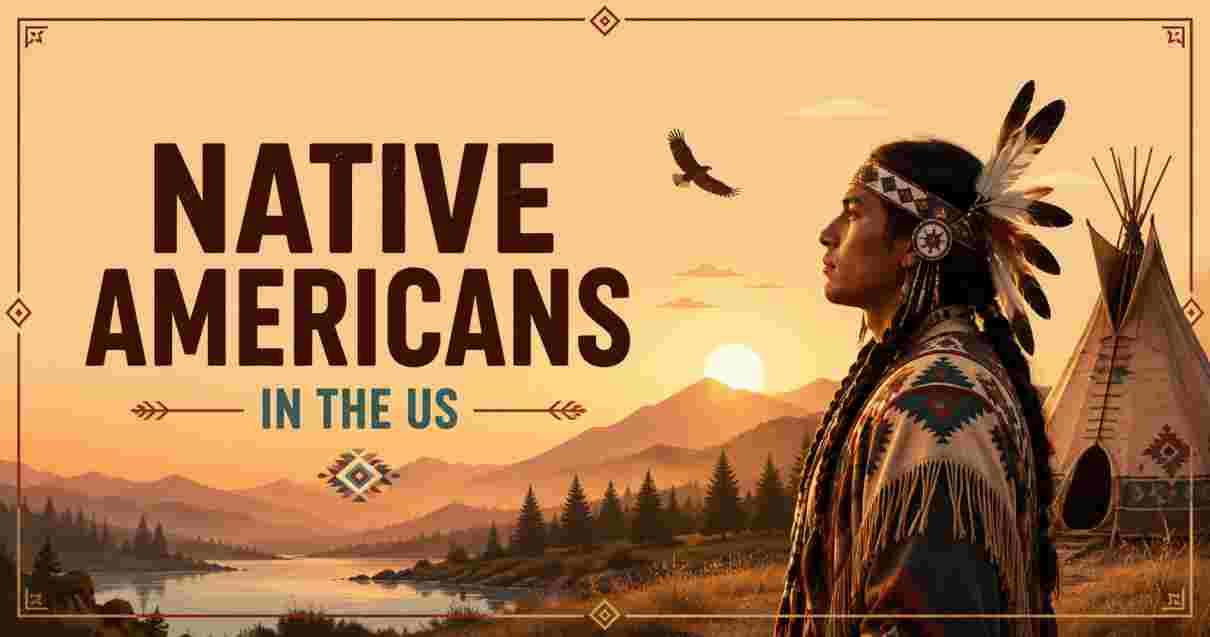
Who Are Native Americans in America in 2026?
Native Americans — also known as American Indians, Alaska Natives, and Indigenous peoples — are the original inhabitants of the land that became the United States, with a continuous presence stretching back at least 15,000 to 20,000 years, according to the National Museum of the American Indian. They are not a monolithic people. They are hundreds of distinct nations, each with its own language, governance structure, history, and cultural traditions — united by a shared experience of colonization, dispossession, and resilience, and by a legal and political relationship with the United States federal government that is unlike any other group in America. According to the US Census Bureau’s most current data, approximately 9.7 million people in 2024 identified as American Indian or Alaska Native (AIAN) alone or in combination with another racial identity — representing roughly 2.9% of the total US population. The 2.5% share projected for 2060 reflects steady but modest population growth within a community that has survived policies explicitly designed to eliminate it.
In 2026, Native Americans stand at a complex intersection of persistence and ongoing crisis. The sovereignty of 574 federally recognized tribal nations is legally affirmed by a body of treaties, court decisions, and legislation stretching from the founding era to the present. Tribal governments operate hospitals, schools, businesses, and legal systems. Native artists, athletes, scientists, politicians, and community leaders are visible in every sector of American life. Yet the data on health outcomes, poverty, educational attainment, housing, and language survival tells a parallel story of structural inequality that is the direct consequence of policies that confiscated lands, separated children from families, criminalized cultural practices, and systematically underfunded every treaty obligation the federal government made. Understanding Native Americans in 2026 requires holding both of these truths simultaneously: extraordinary cultural resilience and ongoing, measurable injustice.
Native American Population Statistics in the US 2026 | Key Facts
NATIVE AMERICAN POPULATION FAST FACTS — US 2026
━━━━━━━━━━━━━━━━━━━━━━━━━━━━━━━━━━━━━━━━━━━━━━━━━━━━━━━━━━━
 9.7 million AIAN alone or in combination (Census 2024)  ████████████████████
 ~6.79 million AIAN alone (current estimate)             ████████████████████
 2.09% of total US population                            ████████████████████
 574 federally recognized tribes (BIA 2025)              ████████████████████
 326 federally recognized reservations                   ████████████████████
 Only 13% of AIAN population lives on reservations       ████████████████████
 87% live in urban areas or off reservation              ████████████████████
 California: largest AIAN population (757,628+)          ████████████████████
 Alaska: highest concentration at 19.74% of state pop    ████████████████████
 2.5% of US population by 2060 (Census projection)       ████████████████████
━━━━━━━━━━━━━━━━━━━━━━━━━━━━━━━━━━━━━━━━━━━━━━━━━━━━━━━━━━━
| Population Metric | Data | Source |
|---|---|---|
| AIAN alone or in combination (2024) | Approximately 9.7 million — about 2.9% of the US population | US Census Bureau; National Native American Heritage Month Facts 2025 |
| AIAN alone (current estimate 2026) | Approximately 6.79 million — about 2.09% of the US population | World Population Review; Census Bureau 2023 estimates |
| Federally recognized tribes (2025) | 574 tribes — including 227 Alaska Native entities and 347 tribes in the contiguous 48 states | Bureau of Indian Affairs 2025; Census Bureau Heritage Month Facts 2025 |
| Federally recognized reservations | 326 federally recognized reservations across the United States | Bureau of Indian Affairs 2025; The World Data |
| Share living on reservations or tribal lands | Only 13% of the total AIAN population lives on reservations | Bureau of Indian Affairs 2025; The World Data |
| Share living in urban areas / off-reservation | 87% — the majority live in cities and suburban communities, often maintaining tribal connections | BIA 2025; The World Data |
| California: largest total AIAN population | 757,628+ — the largest of any US state | World Population Review (2026 data) |
| Oklahoma: 2nd largest; highest % in lower 48 | 523,360 — making up 13.36% of Oklahoma’s total population | World Population Review 2026 |
| Alaska: highest % concentration | 19.74% of Alaska’s total population identifies as AIAN — the highest share of any state | World Population Review 2026 |
| States with AIAN populations over 100,000 | 15 states have AIAN populations exceeding 100,000 | World Population Review 2026 |
| Population growth 2010–2023 | More than 11% increase from the prior decade | DataPandas 2025; Census 2023 estimates |
| Projected 2060 population | AIAN alone or in combination projected to constitute 2.5% of the total US population by July 1, 2060 | US Census Bureau projection (Heritage Month Facts 2025) |
Source: US Census Bureau National Native American Heritage Month Facts for Features 2025 (census.gov, November 2025); World Population Review Native American Population by State 2026; Bureau of Indian Affairs 2025; DataPandas Native American Population Rankings 2025; The World Data Native American Population in US 2025; The World Data Indian Reservations in the US 2025
The 9.7 million Americans who identify as AIAN alone or in combination in 2024 represent a community whose population has grown steadily — and whose resilience has defied the explicit objectives of federal policies that, from the 1800s through much of the 20th century, were designed to reduce, assimilate, and in the bluntest policy language of the era, eliminate Indigenous peoples as distinct cultural and political entities. The 11% population increase from 2010 to 2023 is not merely demographic growth; it is evidence of a community reclaiming its identity in increasing numbers — families reconnecting with tribal affiliations, individuals identifying more openly as AIAN, and tribal enrollment programs actively reaching citizens who had been disconnected from their nations across generations of urban migration and deliberate cultural suppression.
The 13% reservation residency rate is one of the most misunderstood demographic facts in Native American life. The popular image of Native Americans as reservation-dwellers is statistically inverted: the overwhelming majority — 87% — live in American cities, suburban areas, and rural communities away from reservation land. Los Angeles, Phoenix, New York, Oklahoma City, Anchorage, and Albuquerque are among the cities with the largest urban Native American populations in the country. This urban reality does not represent disconnection from tribal identity or culture — many urban Native Americans maintain deep connections to their nations, return for ceremonies and governance, and access tribal services and benefits from a distance. But it does mean that programs, funding, and policy conversations that focus exclusively on reservation-based communities leave the vast majority of AIAN people outside their scope.
Native American History in the US | Key Events, Policies & Their Lasting Impact
KEY HISTORICAL EVENTS & POLICIES — NATIVE AMERICAN HISTORY IN US
━━━━━━━━━━━━━━━━━━━━━━━━━━━━━━━━━━━━━━━━━━━━━━━━━━━━━━━━━━━
Pre-contact: 15,000–20,000 years habitation; 300+ languages spoken
1778:  First US-tribal treaty signed (Delaware Nation)
1830:  Indian Removal Act signed — Trail of Tears begins
1830–1838: ~60,000–100,000 forcibly relocated; thousands died
1862–1934: Allotment era — 90 million acres of tribal land lost
1879–1978: Federal Indian boarding school system operates
1887:  Dawes Act — 138 million acres reduced to 48 million
1924:  Indian Citizenship Act grants citizenship to all AIAN
1934:  Indian Reorganization Act — halts allotment
1953:  Termination Policy begins — targeted 100+ tribes
1978:  American Indian Religious Freedom Act passed
1988:  Indian Gaming Regulatory Act passed
2024:  Federal investigation: 973 children died in boarding schools
2024 (Oct): President Biden formally apologizes for boarding school system
━━━━━━━━━━━━━━━━━━━━━━━━━━━━━━━━━━━━━━━━━━━━━━━━━━━━━━━━━━━
| Historical Event / Policy | Year | Impact & Legacy |
|---|---|---|
| First US-tribal treaty signed | 1778 | Treaty with the Delaware Nation — one of more than 370 treaties signed between 1778 and 1871; the vast majority were subsequently broken or violated by the US government |
| Indian Removal Act signed | 1830 | Authorized the forced relocation of southeastern tribes; led directly to the Trail of Tears (1830–1850) in which an estimated 60,000–100,000 Indigenous people were forcibly moved west; thousands died on the journey |
| Dawes Act (General Allotment Act) | 1887 | Divided communally held tribal lands into individual allotments; reduced total AIAN land holdings from approximately 138 million acres to 48 million acres — a loss of nearly 90 million acres in just 47 years |
| Federal Indian boarding school system | 1879–1978 | Approximately 400+ schools operated across 37 states; an estimated 10,000+ children were removed from families; the stated mission was explicitly “Kill the Indian, Save the Man” — enforced through bans on Native languages, religions, dress, and names |
| Boarding school children who died | 1800s–1970s | Federal investigation completed July 30, 2024 identified at least 973 Native American children who died in the boarding school system; 65 school sites had gravesites; 21 unmarked gravesites and 53 marked gravesites found |
| Indian Citizenship Act | 1924 | Granted US citizenship to all AIAN people born in the US — 148 years after the Declaration of Independence and only after the land had been largely taken |
| Indian Relocation Act | 1956 | Pushed Native Americans to move to urban areas by offering relocation assistance — part of the Termination era that explicitly sought to end federal recognition of tribal nations |
| American Indian Religious Freedom Act | 1978 | Protected the right of Native Americans to access sacred sites, practice traditional religions, and use sacred objects — rights that had been criminalized since the 1880s |
| Indian Gaming Regulatory Act | 1988 | Established the legal framework for tribal gaming operations; now a $40+ billion annual industry — one of the most significant drivers of tribal economic self-sufficiency |
| President Biden apology for boarding schools | October 2024 | During a visit to the Gila River Indian Community in Arizona, President Biden delivered a formal apology to Native Americans for the Indian boarding school system — the first presidential apology for this policy |
Source: KFF “Key Data on Health and Health Care for American Indian or Alaska Native People” (December 2025); Bureau of Indian Affairs Federal Boarding School Initiative Investigation (July 30, 2024); Wikipedia — American Indian Boarding School Gravesites; NICOA American Indian Health Disparities; EBSCO Research Starters; VOA News March 2025; Obama White House Native Youth Report 2014
The history of Native Americans in the United States is inseparable from an understanding of what the data shows in 2026. Every health disparity, every economic gap, every language endangered or extinct, every poverty statistic traced back to a specific federal policy — most of them fully intentional and many of them operating within living memory. The Dawes Act’s destruction of 90 million acres of tribal land was not an accident; it was a deliberate policy of economic suffocation designed to force assimilation by eliminating the land base on which tribal economies and cultures depended. The boarding school system’s operation across nearly a century — with 973 children now confirmed dead in federal investigation findings released in July 2024 — is not distant history; it encompasses the grandparents and great-grandparents of people alive today.
The federal apology issued by President Biden in October 2024 — delivered in person at the Gila River Indian Community — was described by tribal leaders as meaningful but insufficient without accompanying policy action. The Senate Committee on Indian Affairs approved 25 bills in early 2025 addressing tribal land restoration, water rights, public health, economic development, and justice for missing and murdered Indigenous people — legislation whose fate in the broader Congress will determine whether the apology translates into material change. The 1988 Indian Gaming Regulatory Act represents perhaps the most consequential economic policy shift for tribal nations in the modern era: by establishing tribal gaming as a legal framework, it created the infrastructure for a $40+ billion annual industry that funds tribal hospitals, schools, cultural programs, and government services for hundreds of thousands of AIAN people — not as a gift from the federal government, but as an exercise of sovereign tribal economic authority.
Native American Tribes in the US 2026 | Largest Nations, Reservations & Sovereignty
LARGEST TRIBES & TRIBAL LANDS — US 2026
━━━━━━━━━━━━━━━━━━━━━━━━━━━━━━━━━━━━━━━━━━━━━━━━━━━━━━━━━━━
Cherokee Nation (OK): enrollment 466,118+      ████████████████████
Navajo Nation: ~400,000 enrolled citizens      ████████████████████
Navajo Nation land: 27,413 sq miles            ████████████████████  (larger than WV)
California: 109 federally recognized tribes    ████████████████████  (most of any state)
Oklahoma: 39 federally recognized tribes       ████████████████████
Pine Ridge (SD): ~28,000 residents on-rez     ████████████████████
Cherokee claims (alone or combination): 2.3M  ████████████████████
Actual 3 Cherokee tribe enrollment: ~400,000  ████████████████████
Indian gaming revenues: $40+ billion/yr       ████████████████████
━━━━━━━━━━━━━━━━━━━━━━━━━━━━━━━━━━━━━━━━━━━━━━━━━━━━━━━━━━━
| Tribe / Tribal Nation | Enrollment / Key Stat | Notable Facts |
|---|---|---|
| Cherokee Nation (Oklahoma) | 466,118+ enrolled citizens as of late 2024 | Largest federally recognized tribe by enrollment; $3.65 billion tribal budget (FY2025); $3.1 billion annual economic impact in Oklahoma; headquartered in Tahlequah, OK |
| Navajo Nation | ~400,000 enrolled citizens | Largest tribe by single-race AIAN identification (14.6% of all AIAN alone); spans Arizona, New Mexico, and Utah; operates extensive governmental services |
| Navajo Nation land area | 27,413 square miles (17.5 million acres) | Larger than 10 US states including West Virginia; the largest reservation by land area in the US |
| Choctaw Nation | 3.2% of AIAN alone population | Third largest tribe by single-race identification; active language and cultural preservation programs in Oklahoma and Mississippi |
| Lumbee Tribe of North Carolina | 2.5% of AIAN alone population | Largest tribe east of the Mississippi; state-recognized but not yet fully federally recognized — seeks recognition annually |
| Cherokee identification (any combination) | 2,305,143 — 23.8% of all AIAN alone or in combination | Nearly 6× more people claim Cherokee ancestry in combination vs. alone — three federally recognized Cherokee tribes have ~400,000 enrolled citizens |
| California tribes | 109 federally recognized tribes — highest of any state | Extraordinary linguistic and cultural diversity; largest urban AIAN population in the US |
| Oklahoma tribes | 39 federally recognized tribes | Including 5 Civilized Tribes forcibly relocated during the Trail of Tears — the state reflects concentrated historical injustice and tribal resilience |
| Alaska Native entities | 227 federally recognized Alaska Native entities | Yup’ik, Inupiat, and Alaskan Athabascan are the three largest Alaska Native tribal groupings |
| Pine Ridge Reservation (SD) | One of the largest reservations by population | Home to the Oglala Sioux Tribe; one of the most economically disadvantaged communities in the US |
| Indian gaming revenues | $40+ billion per year | 574 federally recognized tribes; gaming funds healthcare, education, housing, and cultural programs |
Source: The World Data Cherokee Native American Tribe 2025 (citing Cherokee Nation 2025 Economic Impact Report and FY2025 budget); US Census Bureau 2020 Decennial Census DHC-A Detailed Tribal Data; Bureau of Indian Affairs 2025; The World Data List of Indian Tribes in the US 2026 (June 2026)
The 574 federally recognized tribes of 2026 represent a spectrum of scale, geography, and resource that no single narrative can encompass. The Cherokee Nation’s $3.65 billion FY2025 budget — approved by tribal council in September 2024 and generating $3.1 billion in annual economic impact across northeastern Oklahoma — is the expression of what sovereignty looks like when a tribal government has the enrollment base, land foundation, and institutional capacity to function as a major economic and governmental actor. The Navajo Nation’s 27,413 square miles — a territory larger than West Virginia that spans three states — illustrates a different dimension of tribal sovereignty: a geographically vast nation that governs its own schools, health system, courts, and police across a landscape that also faces some of the most significant infrastructure challenges in the United States, including large areas without reliable electricity, running water, or broadband access.
The Cherokee ancestry claim phenomenon deserves particular attention because it illuminates the complex relationship between cultural identity and formal tribal citizenship. The 2.3 million Americans who identify as Cherokee in combination with other races represent everything from people with documented Cherokee lineage who have not sought or been granted tribal enrollment, to family oral histories passed across generations that may or may not reflect accurate genealogy. The three federally recognized Cherokee tribes together enroll approximately 400,000 citizens — a fraction of the 2.3 million claiming Cherokee heritage. This gap is not merely administrative; it reflects the Cherokee Nation’s sovereignty right to define its own citizenship based on documented lineage from the Dawes Rolls — a federal census taken between 1898 and 1914 — and it sits at the intersection of heritage, identity, political sovereignty, and the very fraught history of who gets to claim Indigeneity in America.
Native American Languages in the US 2026 | Status, Speakers & Revitalization
NATIVE AMERICAN LANGUAGE STATUS — US 2026
━━━━━━━━━━━━━━━━━━━━━━━━━━━━━━━━━━━━━━━━━━━━━━━━━━━━━━━━━━━
Pre-contact: ~350 languages spoken in US territory
Currently: ~115 languages still spoken
150+ languages already extinct (no living speakers)
135+ classified as critically endangered
>50% projected to lose all native speakers within 20 yrs
By 2050: fewer than 20 Native languages may remain
Navajo: 161,000–170,000 speakers (most spoken)
Yupik: 19,000+ speakers (2nd most spoken)
Dakota/Lakota: 18,000+ speakers (3rd most spoken)
Cherokee: ~10,440 speakers (with active revitalization)
Only 2.7% of AIAN population speaks a Native language
(excluding Navajo and Hawaiian speakers)
━━━━━━━━━━━━━━━━━━━━━━━━━━━━━━━━━━━━━━━━━━━━━━━━━━━━━━━━━━━
| Language / Status Metric | Data |
|---|---|
| Languages spoken pre-European contact (US territory) | Approximately 350 distinct languages |
| Languages currently still spoken | Approximately 115 languages remain in use |
| Languages already extinct | More than 150 indigenous languages once spoken in the US are now extinct — no living native speakers |
| Critically endangered languages | Over 135 Native languages classified as critically endangered, many with fewer than 100 fluent speakers, most of whom are elderly |
| Projected timeline for remaining languages | More than half of the 115 surviving languages are projected to lose their entire population of native speakers within the next 20 years |
| Languages projected surviving to 2050 | Some estimates suggest fewer than 20 Native languages may still be in active use in America by 2050 |
| Navajo (Diné Bizaad) | 161,000–170,000 speakers — most spoken Indigenous language in the US |
| Yupik (Central Alaskan) | 19,000+ speakers — second most spoken |
| Dakota / Lakota | 18,000+ speakers — third most spoken |
| Cherokee (Tsalagi) | Approximately 10,440 speakers — active revitalization programs running |
| Choctaw | Approximately 7,260 speakers — ongoing programs in Oklahoma and Mississippi |
| Hopi (Hopílavayi) | Approximately 7,105 speakers — strong among multigenerational Hopi mesa communities |
| Total AIAN population speaking a Native language | Only about 2.7% of the AIAN population speaks a Native language (factoring out Navajo and Hawaiian speakers) |
| States where Native languages are top-15 languages | 9 states: AZ (Navajo, Keres, Zuni, Tewa), OK (Cherokee, Creek, Choctaw), SD (Lakota/Dakota), UT (Navajo), WY (Arapaho, Shoshoni, Navajo) |
Source: US Census Bureau “In Some States, Native North American Languages Were Among the Most Spoken” (June 2025); MultiLingual “Native Americans Kickstart Decade of Indigenous Languages” (January 28, 2025); BIA “Native Language Revitalization 10-Year National Plan” (December 2024); BIA Native Language Revitalization Literature Review; The World Data Native American Population 2025; Indian Youth Guide to Native American Languages (November 2025); Translators USA Guide to Native American Languages (March 2026)
The Native American language crisis in 2026 is not simply a cultural footnote — it is one of the most accelerating knowledge-extinction events on Earth. When a language disappears, it takes with it an irreplaceable epistemic world: ecological knowledge encoded over thousands of years of relationship with specific landscapes; medicinal plant knowledge; cosmologies and spiritual frameworks; oral histories that exist nowhere in written form; and ways of categorizing and understanding reality that no translation into English can fully capture. The BIA’s December 2024 publication of its 10-Year National Plan on Native Language Revitalization — which explicitly states that without urgent, bold action, fewer than 20 Native languages may remain by 2050 — is the federal government’s most direct acknowledgment yet that it bears responsibility for creating this crisis through a century of policies that punished children for speaking their languages and severed intergenerational transmission.
The Navajo language’s relative strength at 161,000–170,000 speakers — despite a declining trend between 2013 and 2021 — is often held up as a model for what revitalization can achieve when a large and well-resourced tribal nation commits systematically to the effort. Navajo-language immersion schools, tribal college language programs, radio and television broadcasting, and the creation of digital language resources have built a preservation infrastructure that smaller tribes with fewer resources struggle to replicate. The Cherokee Nation’s syllabary-based revitalization programs — building on the unique Cherokee writing system developed by Sequoyah in the 19th century — represent another model of language recovery, with the Cherokee Nation partnering with universities, creating mobile language apps, and running master-apprentice programs that pair fluent elders with adult learners. That Cherokee has only ~10,440 speakers despite being the tribe with the largest enrollment and the strongest heritage connection claimed by millions of Americans illustrates the depth of the loss that boarding schools and assimilation policies inflicted on language transmission.
Native American Heritage, Culture & Socioeconomic Conditions in 2026
NATIVE AMERICAN HERITAGE & LIVING CONDITIONS — US 2026
━━━━━━━━━━━━━━━━━━━━━━━━━━━━━━━━━━━━━━━━━━━━━━━━━━━━━━━━━━━
Poverty rate (AIAN): 20.9% vs national 10%     ████████████████████
Wealth gap: AIAN have 8¢ per $1 of White wealth ████████████████████
Homeownership (urban AIAN): 45.3% vs 66% national ████████████████████
Uninsured rate AIAN: 18.2% vs 9.2% national   ████████████████████
Educational attainment: lowest of any US group  ████████████████████
Life expectancy: 10–20 years lower than national ████████████████████
MMIP (Missing/Murdered Indigenous People):
  Indigenous women murder rate: 10x national avg (some regions)
Traditional arts: protected under Indian Arts and Crafts Act 1990
Native voters: key swing voters in AZ (22 tribes) in 2024 election
━━━━━━━━━━━━━━━━━━━━━━━━━━━━━━━━━━━━━━━━━━━━━━━━━━━━━━━━━━━
| Heritage / Socioeconomic Metric | Data |
|---|---|
| Poverty rate (AIAN vs national) | AIAN poverty rate: 20.9% vs national average of 10% — approximately twice the national rate |
| Wealth gap | Average AIAN household has approximately 8 cents of wealth for every dollar of wealth held by the average White household — a 92% wealth gap |
| Homeownership rate (urban AIAN) | 45.3% for urban AIAN individuals vs. 66% national rate and 72% White rate |
| Uninsured rate | AIAN uninsured rate: 18.2% vs national rate of 9.2% |
| Educational attainment | American Indians have the lowest educational attainment rates of any group in the US |
| Bureau of Indian Education schools | Approximately 180 BIE schools are chronically underfunded |
| Life expectancy gap | AIAN populations have significantly lower life expectancy than the national average — among the largest of any racial group |
| Indian Health Service (IHS) | Provides healthcare to over 500 federally recognized tribes — established by treaty right; chronically underfunded |
| Missing and Murdered Indigenous People (MMIP) | An ongoing national crisis; the Senate Committee on Indian Affairs approved 25 bills in early 2025 partially addressing MMIP |
| Native American voters (2024 election) | Played a key role in Arizona’s 2024 results — home to 22 tribes; exit polls showed a shift toward Republican support driven by economic concerns |
| Indian Arts and Crafts Act (1990) | Protects authentic Native American art from fraudulent imitation; a $1+ billion industry involving pottery, jewelry, textiles, beadwork, and more |
| Traditional ecological knowledge | AIAN communities are recognized stewards of vast ecological knowledge — increasingly cited in climate science, conservation policy, and environmental management |
Source: KFF “Key Data on Health and Health Care for American Indian or Alaska Native People” (December 2025); The World Data Native American Population in US 2025; NICOA American Indian Health Disparities; US Census Bureau 2022 poverty data; VOA News March 8, 2025; NativeAmericanTribes.info September 2025; Indian Arts and Crafts Board
The socioeconomic data for Native Americans in 2026 does not represent an innate condition — it represents the measurable output of more than 200 years of federal policy that stripped tribal nations of land, children, language, governance authority, and economic capacity. The 92% wealth gap — where AIAN households hold approximately 8 cents for every dollar of White household wealth — is not an accident or a mystery. It is the compound interest, accruing across generations, of the 90 million acres stolen under the Dawes Act, the loss of economic self-sufficiency through forced relocation, the denial of homeownership financing through discriminatory lending practices, and the structural poverty of reservations placed in areas deliberately chosen for their economic worthlessness. As Navajo Nation President Buu Nygren stated plainly: “You can’t build an economy without roads, without water, without broadband” — and reservation infrastructure of that kind was never provided by the federal government that promised it in exchange for the land it took.
The heritage and cultural vitality of Native Americans in 2026 exists in powerful tension with these material conditions. The Indian Arts and Crafts industry, worth more than a billion dollars annually, represents both economic opportunity and cultural expression — a living tradition of pottery, weaving, beadwork, carving, and jewelry that predates European contact and continues to evolve in the hands of contemporary Native artists who are internationally recognized figures. Traditional ecological knowledge — accumulated over thousands of years of continuous relationship with specific landscapes — is increasingly cited by climate scientists, conservation biologists, and water resource managers as irreplaceable data about baseline conditions and ecosystem dynamics that no modern monitoring program has the temporal depth to replicate. The growing presence of Native American voices in politics, media, law, and academia — from Deb Haaland, the first Native American Cabinet secretary, to the growing body of Native lawyers, doctors, professors, and entrepreneurs — represents a generation that is simultaneously navigating deep structural inequity and refusing to be defined by it.
Disclaimer: The data research report we present here is based on information found from various sources. We are not liable for any financial loss, errors, or damages of any kind that may result from the use of the information herein. We acknowledge that though we try to report accurately, we cannot verify the absolute facts of everything that has been represented.