Population by Race in Ireland 2026
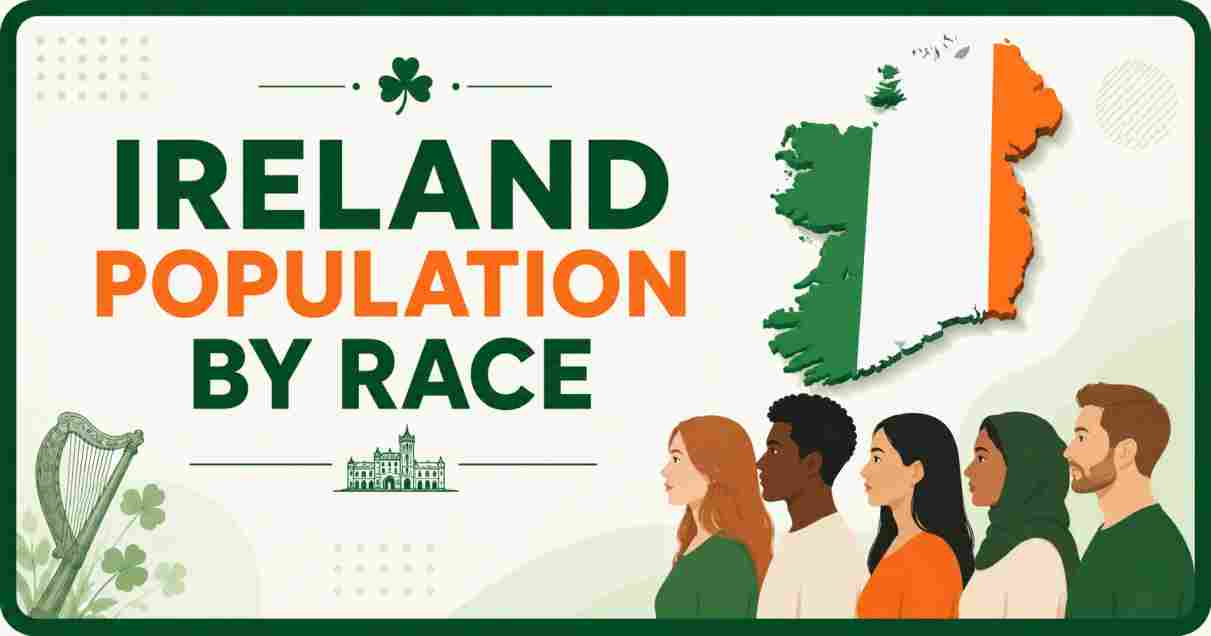
Ireland’s population has transformed from one of Europe’s most ethnically homogeneous countries into a genuinely diverse nation within a single generation, a shift driven overwhelmingly by immigration since the country’s economic boom of the late 1990s and early 2000s. Where Ireland was 87.4% White Irish as recently as 2006, the country’s Central Statistics Office (CSO) now tracks a detailed and expanding set of ethnic and cultural background categories, offering one of the clearest official pictures of demographic change anywhere in Western Europe.
This guide breaks down the latest Ireland population by ethnic group statistics, covering the White Irish majority, the country’s growing Any Other White, Asian, Black, and Roma communities, the long-standing Irish Traveller population, and how these figures compare with neighbouring Northern Ireland and the wider United Kingdom. Whether you’re researching Ireland’s immigration-driven diversity, citizenship patterns, or ethnic composition by age and region, this article lays out the full, current picture using the most detailed and authoritative data available.
Interesting Facts About Population by Race in Ireland 2026
| Interesting Fact | Data (Census 2022, Latest Available) |
|---|---|
| Ireland’s Total Population (Census Day, 3 April 2022) | 5,149,139 — first time exceeding 5 million since 1851 |
| Ireland’s Total Population (2025 Estimate) | Over 5.4 million |
| Identify as White Irish | 77% (3,893,056 people) |
| Identify as Any Other White Background | 10% (502,081 people) |
| Identify as White Irish Traveller | 0.6% (32,949 people) |
| Identify as Indian/Pakistani/Bangladeshi (New Category) | 2% (94,434 people) |
| Identify as Black or Black Irish – African | 1.3% (67,546 people), up 17% since 2016 |
| Identify as Asian or Asian Irish – Chinese | 0.5% (26,828 people), up 38% since 2016 |
| Identify as Roma (New Category) | 0.3% (16,059 people) |
| Identify as Arab (New Category) | 0.4% (20,115 people) |
| Total “White” Population (All White Categories Combined) | 87% |
| Non-Irish Citizens Living in Ireland | 12% (631,785 people) |
Source: Central Statistics Office (CSO) Ireland, Census of Population 2022, Profile 5 – Diversity, Migration, Ethnicity, Irish Travellers & Religion.
As a content writer working through this data, the most important story in Ireland’s 2022 census results is just how much the country’s ethnic composition has shifted within a relatively short span. The share of the population identifying as White Irish fell from 87.4% in 2006 to 76.6% by 2022, even as Ireland’s overall population grew by over a million people — meaning nearly all of that growth came from residents identifying with other ethnic and cultural backgrounds. The introduction of three entirely new census categories in 2022 — Roma, Indian/Pakistani/Bangladeshi, and Arab — itself reflects how far Ireland’s diversity has expanded beyond what the country’s previous ethnic classification system could adequately capture.
The second major theme is the sheer pace of growth within specific minority communities. The Chinese ethnic population grew 38% between 2016 and 2022, while those identifying as Black or Black Irish – African rose 17% and the Black or Black Irish – Any Other Black background group grew 28%. Combined with the fact that 12% of Ireland’s population now holds non-Irish citizenship, up from 11% in 2016, this data confirms that Ireland’s transformation from a historically emigration-driven country into a major destination for immigration has now fundamentally reshaped its ethnic and cultural makeup, particularly in Dublin and other urban centres.
How Ireland Measures Ethnicity: The Census Approach
| Detail | Explanation |
|---|---|
| Question Type | Direct, self-identified ethnic group or background question |
| Responsible Agency | Central Statistics Office (CSO) Ireland |
| Broad Categories on the 2022 Form | White; Black or Black Irish; Asian or Asian Irish; Other, including Mixed background |
| New Categories Added for 2022 | Roma, Indian/Pakistani/Bangladeshi, Arab |
| Census Frequency | Every 5 years, with the most recent taken on 3 April 2022 |
| Next Scheduled Census | 2027 |
Source: Central Statistics Office (CSO) Ireland, Census 2022 question design and Background Notes documentation.
Ireland’s approach to measuring ethnicity is broadly similar to the rest of the United Kingdom and Ireland region, asking residents to select directly from a structured list of ethnic group or background categories rather than relying on ancestry or country-of-birth proxies alone. The 2022 Census significantly revised this question, splitting out three entirely new categories — Roma, Indian/Pakistani/Bangladeshi, and Arab — that had previously been folded into broader “Other” or “Any Other Asian/White” groupings, a change the CSO says better reflects the genuine diversity of modern Ireland but which also means some 2022 figures are not directly comparable to earlier censuses.
Because Ireland conducts its census every five years rather than every ten, as is standard in Australia, Scotland, and much of the UK, the country’s ethnicity data tends to be somewhat more current at any given point in time. The next Irish census is scheduled for 2027, meaning the detailed 2022 results remain the most authoritative snapshot of Ireland’s ethnic composition through the entirety of 2026, with only broader population and migration estimates updated annually in the interim by the CSO.
Ethnic Group Breakdown Statistics Ireland 2026
| Ethnic Group | Number of People | Share of Population |
|---|---|---|
| White Irish | 3,893,056 | 77% |
| Any Other White Background | 502,081 | 10% |
| White Irish Traveller | 32,949 | 0.6% |
| Indian/Pakistani/Bangladeshi | 94,434 | 2% |
| Black or Black Irish – African | 67,546 | 1.3% |
| Any Other Asian Background | 44,944 | 0.9% |
| Asian or Asian Irish – Chinese | 26,828 | 0.5% |
| Arab | 20,115 | 0.4% |
| Roma | 16,059 | 0.3% |
| Black or Black Irish – Any Other Black Background | 8,699 | 0.2% |
| Mixed or Other Background | 64,992 | 1.3% |
Source: Central Statistics Office (CSO) Ireland, Census of Population 2022, Ethnic Group/Background detailed dataset.
White Irish remains by far the largest single ethnic group in Ireland, accounting for 77% of the population, though this represents a steady, continuous decline from 87.4% as recently as 2006. The second-largest group, “Any Other White Background” at 10%, reflects Ireland’s substantial Polish, UK, and other European communities, many drawn by EU free movement and the country’s historically strong labour market. Including White Irish Travellers, Ireland’s total White population across all categories stands at approximately 87% of residents.
Among the newer, more granular categories introduced in 2022, the Indian/Pakistani/Bangladeshi group emerged as the largest minority ethnic community at 2% of the population (94,434 people), ahead of the combined Black or Black Irish population at roughly 1.5%. Notably, the introduction of this new South Asian category caused the previously broader “Any Other Asian Background” group to nearly halve, from its 2016 level down to 44,944 people, illustrating how much of Ireland’s earlier Asian population data had actually been masking a large, previously uncounted Indian, Pakistani, and Bangladeshi community.
Growth Trends by Ethnic Group Ireland 2026
| Ethnic Group | 2016 to 2022 Change |
|---|---|
| Black or Black Irish – African | +17% (57,850 to 67,546) |
| Black or Black Irish – Any Other Black Background | +28% (up to 8,699) |
| Asian or Asian Irish – Chinese | +38% (up to 26,828) |
| White Irish Traveller | +6% (30,987 to 32,949) |
| White Irish (Share of Total Population) | Declined from ~82% (2016) to 77% (2022) |
| Non-Irish Citizens (Share of Total Population) | 11% (2016) to 12% (2022) |
| People Reporting No Religion | +63% (increase since 2016) |
Source: Central Statistics Office (CSO) Ireland, Census of Population 2022, comparison with Census 2016 results.
Every minority ethnic group tracked in Ireland’s census grew between 2016 and 2022, but the pace of growth varied considerably. The Chinese ethnic community grew fastest at 38%, followed by the “Any Other Black” category at 28% and the Black or Black Irish – African group at 17%. Even the long-established Irish Traveller community, Ireland’s indigenous ethnic minority, grew a modest 6% over the same period, continuing its historically younger age profile compared to the general population.
This growth across minority groups occurred even as Ireland’s overall population expanded by 8.1% between 2016 and 2022, reaching 5,149,139 — the first time the country’s population exceeded 5 million since the Great Famine era of 1851. Notably, the CSO’s data shows that net migration contributed more to this population growth (36,631 average annual net migration) than natural increase (27,915 average annual natural growth), a genuine shift from the two previous census cycles, when births had consistently outpaced migration as the dominant driver of Ireland’s population growth.
Citizenship and Country of Origin Statistics Ireland 2026
| Metric | Figure |
|---|---|
| Non-Irish Citizens Living in Ireland | 631,785 (12% of population) |
| EU Citizens (Share of Non-Irish Population) | ~50% (nearly 313,000 people) |
| UK Citizens | Over 83,000, though declining (-19% since 2016) |
| Dual Irish Citizens | 170,597, up 63% since 2016 |
| Top Non-Irish Citizenship Groups | Poland, United Kingdom, India, Romania, Lithuania |
| People Who Moved to Ireland in the Year Before the Census | Over 89,500 |
| Top Source Countries for New Arrivals | India (~10,000), Brazil (~5,000) |
Source: Central Statistics Office (CSO) Ireland, Census of Population 2022, Migration and Diversity dataset.
Citizenship data offers a complementary and in some ways more precise window into Ireland’s international population than ethnicity alone, since it reflects a clear legal status rather than self-identification. Non-Irish citizens made up 12% of Ireland’s population in 2022, with EU citizens accounting for roughly half of that group and UK citizens representing the largest single non-EU nationality, despite a notable 19% decline in UK citizens living in Ireland since 2016 — likely linked to post-Brexit migration patterns.
Perhaps most striking is the 63% surge in dual Irish citizens, reaching 170,597 people, reflecting both naturalisation among long-term immigrants and children born in Ireland to non-Irish parents. India emerged as the single largest source of new arrivals in the year before the census, with almost 10,000 people moving to Ireland from India alone, more than double the next largest source country, Brazil, underscoring how significantly Ireland’s immigration patterns have diversified beyond the traditionally dominant UK and EU migration corridors of previous decades.
Irish Traveller Population Statistics Ireland 2026
| Metric | Figure |
|---|---|
| Total Irish Traveller Population | 32,949, up 6% since 2016 |
| Share of Total Population | 0.6% |
| Share Aged Under 25 | 55%, compared to a much older general population |
| Share Aged 65 and Over | 5%, compared to 15% of the general population |
| Largest Concentration | Dublin, with 6,196 Travellers citywide |
Source: Central Statistics Office (CSO) Ireland, Census of Population 2022, Irish Travellers dataset.
The Irish Traveller community, a distinct indigenous ethnic minority formally recognised by the Irish state since 2017, numbered 32,949 people in the 2022 Census, representing 0.6% of the national population and continuing steady growth of 6% since 2016. Demographically, Travellers are strikingly younger than the general population — 55% are under 25 years old, compared to just 15% of the overall population being 65 or older, while only 5% of Travellers fall into that older age bracket.
This youthful age profile reflects both higher fertility rates within the Traveller community and historically lower life expectancy compared to the general Irish population, a well-documented health disparity that has been the subject of extensive public health research and policy attention in Ireland. Dublin remains home to the largest concentration of Travellers nationally, with 6,196 recorded citywide across its constituent local authority areas, though Traveller communities are present in towns and rural areas throughout the country, reflecting the group’s traditionally itinerant and later settled presence across the island.
Religious Diversity as a Related Demographic Marker Ireland 2026
| Religion | Share of Population (2022) | 2016 Comparison |
|---|---|---|
| Roman Catholic | 69% (3,515,861 people) | 78% (down from 3,696,644) |
| No Religion | 14% (over 736,000 people) | Up 63% since 2016 |
| Church of Ireland | ~2% | — |
| Islam | 1.7% (over 83,000 people) | Growing with migration |
| Orthodox Christian | Growing, tied to Eastern European migration | — |
| Hinduism | 33,043 people | — |
| Jewish Community | 2,193 people | — |
Source: Central Statistics Office (CSO) Ireland, Census of Population 2022, Religion dataset.
While not a direct measure of ethnicity, religious affiliation in Ireland closely tracks the same migration-driven diversification visible in the ethnic group data. Roman Catholicism remains the dominant religion at 69%, but this represents a sharp decline from 78% just six years earlier in 2016, continuing a decades-long secularization trend. Meanwhile, the “no religion” category surged 63% to exceed 736,000 people, now firmly established as Ireland’s second-largest religious category.
Non-Christian faiths have grown substantially alongside Ireland’s ethnic diversification, with Islam now practiced by over 83,000 people (1.7%), largely reflecting migration from the Middle East, North Africa, and South Asia, while Hinduism grew to 33,043 adherents, closely mirroring the growth in Ireland’s Indian/Pakistani/Bangladeshi ethnic group. This overlap between religious and ethnic diversification data offers researchers a useful cross-check when analyzing Ireland’s broader demographic transformation heading into 2026, since the two datasets consistently reinforce and validate one another.
Historical Trend: Ireland’s Ethnic Diversity Since 2006
| Census Year | White Irish Share of Population |
|---|---|
| 2006 | 87.4% |
| 2011 | ~85% |
| 2016 | ~82% |
| 2022 | 77% (76.6%) |
| Non-Irish Citizens, 2006 | ~10% |
| Non-Irish Citizens, 2022 | 12% |
Source: Central Statistics Office (CSO) Ireland, historical census comparisons, 2006-2022.
Viewed across a longer historical arc, the decline in Ireland’s White Irish population share has been remarkably steady, falling from 87.4% in 2006 to 77% by 2022 — a drop of roughly 10 percentage points across four census cycles, or approximately 2.5 percentage points per census on average. This consistent, gradual decline stands in contrast to the more abrupt shifts seen in some other European nations, reflecting Ireland’s relatively steady, sustained pattern of economic-driven immigration rather than sudden refugee-driven population changes.
This historical trend is particularly notable given Ireland’s history as a country of net emigration for most of the 20th century, with generations of Irish citizens leaving for the UK, United States, and Australia rather than the reverse. The complete reversal of this pattern since the “Celtic Tiger” economic boom of the late 1990s has fundamentally reshaped Ireland’s demographic identity within roughly a quarter century — a pace of change that, combined with the introduction of entirely new census ethnic categories in 2022, suggests Ireland’s diversity statistics are likely to continue shifting meaningfully with each successive census through 2027 and beyond.
Regional Distribution of Diversity in Ireland 2026
| Region/County | Diversity Pattern |
|---|---|
| Dublin | Highest concentration of minority ethnic residents; largest Traveller population (6,196) |
| Dublin Non-Irish Population Growth (Dual Citizens) | Grew from 39,440 (2016) to 56,696 (2022) |
| South Dublin | Largest dual citizenships: Irish-Nigerian (1,220), Irish-Polish (1,176) |
| Dún Laoghaire-Rathdown | Largest dual citizenships: Irish-US (2,282), Irish-UK (2,082) |
| Fingal | Largest dual citizenships: Irish-Polish (1,760), Irish-UK (1,585) |
| Rural and Western Counties | Considerably lower ethnic diversity; population skews older and more White Irish |
Source: Central Statistics Office (CSO) Ireland, Census of Population 2022, county-level press releases.
As with most immigration-driven demographic change, Ireland’s growing ethnic diversity is heavily concentrated in Dublin and its commuter belt, while rural and western counties remain considerably closer to the country’s historical ethnic composition. Dublin’s dual-Irish citizen population grew from 39,440 in 2016 to 56,696 in 2022, and the capital is home to the largest single concentration of Irish Travellers nationally, with 6,196 recorded across Dublin’s four local authority areas.
Within Dublin itself, distinct citizenship patterns have emerged by area: South Dublin shows the strongest Irish-Nigerian and Irish-Polish dual citizenship communities, while Dún Laoghaire-Rathdown — a more affluent southern suburb — skews toward Irish-American and Irish-British dual citizens, reflecting different waves and types of migration settling in different parts of the same metropolitan area. For businesses, researchers, and policymakers examining Ireland’s population by ethnicity at a local level in 2026, this county and even sub-county variation is essential context that national topline figures alone cannot capture.
Ireland vs. Northern Ireland: A Joint Comparison 2026
| Metric | Ireland (2022) | Northern Ireland (2021) |
|---|---|---|
| White Population (All Categories) | 86-87% | 97% |
| Irish Traveller Population | 0.6% (32,949) | 0.1% (2,610) |
| Asian Population | 4% (186,321) | 2% (32,480) |
| Black Population | 1.5% (76,245) | 0.6% (11,030) |
| Population Born Outside the Jurisdiction | 20% (1,017,000) | Considerably lower |
| Non-English/Irish Speakers at Home | 15% of population aged 3+ | 4% of population aged 3+ |
Source: Central Statistics Office (CSO) Ireland and Northern Ireland Statistics and Research Agency (NISRA), “Ireland and Northern Ireland: A Joint Census Publication 2021-2022.”
A joint publication combining Ireland’s 2022 Census with Northern Ireland’s 2021 Census offers a rare, directly comparable picture across the entire island. The data shows the Republic of Ireland is considerably more ethnically diverse than Northern Ireland on every major measure: Ireland’s Asian population (4%) is double Northern Ireland’s (2%), while Ireland’s Black population (1.5%) is more than double Northern Ireland’s (0.6%), and Ireland’s White population share (86-87%) sits notably below Northern Ireland’s 97%.
This gap reflects Ireland’s stronger and more sustained economic pull for international migration compared to Northern Ireland over the past two decades, alongside the Republic’s EU membership, which historically enabled free movement from other EU member states in a way Northern Ireland, as part of the UK, did not experience in the same manner. With 20% of Ireland’s population born outside the state — a figure with no direct equivalent reported for Northern Ireland in the joint publication, though understood to be considerably lower — this data confirms that Ireland’s transformation into a diverse, immigration-driven society has significantly outpaced the equivalent trend just across the border, even within the same small island and shared cultural history.
Disclaimer: The data research report we present here is based on information found from various sources. We are not liable for any financial loss, errors, or damages of any kind that may result from the use of the information herein. We acknowledge that though we try to report accurately, we cannot verify the absolute facts of everything that has been represented.