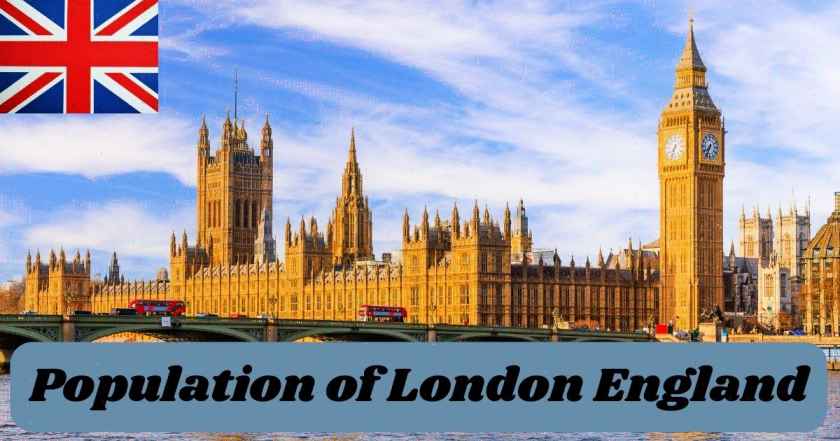
London, the vibrant and dynamic capital of England, stands as a testament to centuries of history, cultural diversity, and urban innovation. Nestled along the banks of the River Thames, this sprawling metropolis serves as a global hub for commerce, finance, culture, and the arts. From its iconic landmarks like the Tower of London and Buckingham Palace to its bustling streets teeming with life, London captivates millions with its unique blend of tradition and modernity.
At the heart of its energy lies its population, a diverse tapestry of people from all corners of the globe, shaping the city’s identity and driving its progress forward. In this exploration, we delve into the population of London, examining its demographic composition, historical trends, and the dynamic forces that continue to shape its social fabric.
Population of London England
In the 2021 census data, the population of London, England, stood at a staggering 8,799,800 individuals, making it one of the most populous cities in Europe. These millions of people are spread across a vast network of 3,423,800 households, each contributing to the city’s rich tapestry of cultures, backgrounds, and experiences.
| Population | Census 2021 | Census 2011 | % Change (2011 to 2021) |
|---|---|---|---|
| London | 8,799,800 | 8,173,941 | 7.7% |
It indicates that the population of London increased from 8,173,941 in 2011 to 8,799,800 in 2021, representing a growth rate of 7.7% over the decade. This demonstrates significant population growth within the city over the span of ten years.
Current Population of London England 2024
In 2024, the estimated population of London is 9.65 million people. This staggering figure significantly surpassed that of Manchester, the UK’s second-largest urban agglomeration, which had a population of around one-third of London’s.
| SOURCES | CURRENT POPULATION | YEAR |
|---|---|---|
| Statista.com | 9,650,000 (9.65M) | 2024 |
| Worldpopulationreview.com | 9,748,033 (9.7M) | 2024 |
Demographics of London England 2024
Demographic data serves as a lens through which we can understand the evolving fabric of a city. The City of London, with its rich history and dynamic urban environment, presents an intriguing case study in demographic trends. The table provided offers a snapshot of the city’s population distribution across different age groups for the years 2011 and 2021.
| Age Group | Percentage in 2011 | Percentage in 2021 |
|---|---|---|
| 85 years and over | 1.6% | 1.4% |
| 75 to 84 years | 4.5% | 4.3% |
| 65 to 74 years | 8.0% | 8.3% |
| 50 to 64 years | 19.1% | 18.8% |
| 35 to 49 years | 24.7% | 21.2% |
| 25 to 34 years | 24.1% | 25.8% |
| 20 to 24 years | 7.4% | 11.2% |
| 16 to 19 years | 2.2% | 2.2% |
| 10 to 15 years | 2.7% | 2.4% |
| 5 to 9 years | 2.5% | 1.9% |
| 4 years and under | 3.2% | 2.5% |
- 85 years and over: In 2011, 1.6% of the population in the City of London belonged to this age group. By 2021, this percentage slightly decreased to 1.4%. This suggests a small decline in the proportion of elderly residents within the city over the decade.
- 75 to 84 years: The percentage of residents aged between 75 and 84 years was 4.5% in 2011, which decreased slightly to 4.3% by 2021. While the change is minimal, it indicates a slight decrease in this age group’s representation within the population.
- 65 to 74 years: This age group saw a small increase in percentage, from 8.0% in 2011 to 8.3% in 2021, suggesting a slight ageing trend within the population over the decade.
- 50 to 64 years: Residents aged between 50 and 64 years represented 19.1% of the population in 2011, which slightly decreased to 18.8% by 2021. This indicates a slight decline in the middle-aged population within the city over the decade.
- 35 to 49 years: The percentage of residents aged between 35 and 49 years decreased notably from 24.7% in 2011 to 21.2% in 2021, suggesting a significant shift in this age group’s representation within the population.
- 25 to 34 years: There was a noticeable increase in the percentage of residents aged between 25 and 34 years, rising from 24.1% in 2011 to 25.8% in 2021. This indicates a growing proportion of young adults within the city over the decade.
- 20 to 24 years: The percentage of residents aged between 20 and 24 years increased significantly from 7.4% in 2011 to 11.2% in 2021, suggesting a substantial increase in the young adult population within the city.
- 16 to 19 years: This age group remained consistent, with 2.2% of the population in both 2011 and 2021.
- 10 to 15 years: The percentage of residents aged between 10 and 15 years decreased slightly from 2.7% in 2011 to 2.4% in 2021.
- 5 to 9 years: Residents aged between 5 and 9 years represented 2.5% of the population in 2011, which decreased to 1.9% by 2021.
- 4 years and under: The percentage of residents aged 4 years and under decreased from 3.2% in 2011 to 2.5% in 2021.
Ethnic Population of London England 2024
The most ethnically diverse region, London, boasts a remarkable demographic landscape. Approximately 46.2% of its residents identify with Asian, Black, Mixed, or ‘Other’ ethnic groups, while an additional 17.0% represent White ethnic minorities.
| Ethnic Population of London England | Percentage |
|---|---|
| Asian | 20.7 |
| Black | 13.5 |
| Mixed | 5.7 |
| White British | 36.8 |
| White Other | 17.0 |
| Other | 6.3 |
The table breaks down the ethnic diversity of London, showcasing the percentage of individuals from different ethnic backgrounds. Here’s a detailed breakdown:
- Asian: This category encompasses individuals with ancestral roots from Asian countries, such as India, China, Pakistan, and Bangladesh. They make up 20.7% of the region’s population, reflecting a significant Asian presence.
- Black: Individuals of African or Caribbean descent fall under this category. They contribute to 13.5% of the region’s population, highlighting a substantial Black community within the area.
- Mixed: This group includes individuals with heritage from two or more ethnic backgrounds. They account for 5.7% of the region’s population, indicating a growing number of mixed-race individuals.
- Other: The “Other” category encompasses ethnicities not explicitly mentioned in the table’s previous groups. This may include indigenous or lesser-known ethnic backgrounds. They represent 6.3% of the region’s population.
- White Minority: Individuals in this category belong to White ethnic groups other than the dominant White British population. They constitute 17.0% of the region’s population, showcasing diversity even within the broader White ethnic category.
Disclaimer: The data research report we present here is based on information found from various sources. We are not liable for any financial loss, errors, or damages of any kind that may result from the use of the information herein. We acknowledge that though we try to report accurately, we cannot verify the absolute facts of everything that has been represented.

