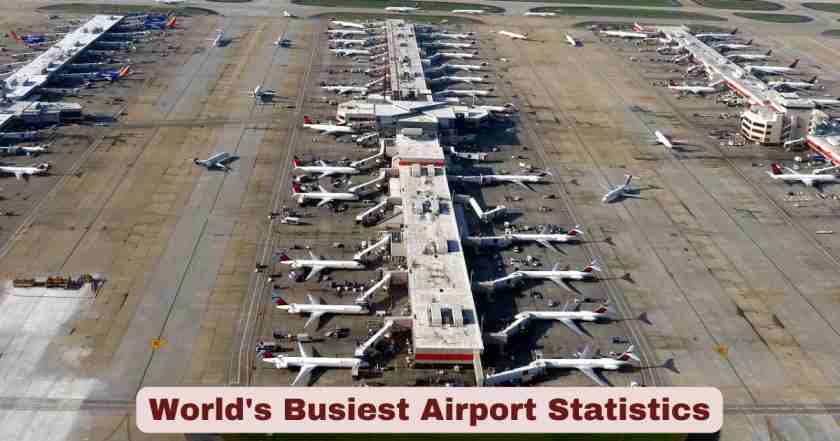
World’s Busiest Airport 2026
The global aviation landscape continues to witness remarkable transformations as passenger traffic reaches unprecedented heights in 2026. Following a historic recovery from the pandemic years, airports worldwide are not just returning to pre-2020 levels but are actively surpassing them, with projections indicating that global passenger traffic will reach 10.2 billion in 2026, marking a 3.9% year-over-year increase. This growth trajectory demonstrates the aviation industry’s resilience and the insatiable demand for air travel across both domestic and international routes. The competition for the title of world’s busiest airport has intensified, with traditional leaders facing unprecedented challenges from rapidly expanding hubs in the Middle East and Asia-Pacific regions.
The dynamics of airport rankings have shifted dramatically in early 2026, with Dubai International Airport (DXB) officially overtaking Hartsfield-Jackson Atlanta International Airport (ATL) in January 2026 to become the world’s busiest airport by seat capacity. According to OAG data, Dubai handled 5.5 million seats in January 2026, surpassing Atlanta’s 4.9 million seats for the same period. This historic shift represents the first time in decades that an airport outside North America has claimed the top position during a peak travel month. However, when examining full-year 2024 data and 2025 preliminary figures, Atlanta maintained its traditional dominance with 108.1 million passengers in 2024, though Dubai is rapidly closing the gap with projections of 99.5 million passengers for 2026, just shy of the coveted 100 million milestone that Dubai Airports CEO Paul Griffiths now expects to achieve by year-end 2026 rather than the previously projected 2027.
Interesting Facts About World’s Busiest Airport 2026
| Fact Category | Details | Data |
|---|---|---|
| Current Top Airport (Jan 2026) | Dubai International Airport (DXB) | 5.5 million seats |
| Traditional Leader | Hartsfield-Jackson Atlanta International Airport (ATL) | 4.9 million seats (Jan 2026) |
| Dubai’s Record Day | January 3, 2026 – Single busiest day | 324,000 passengers |
| Dubai’s Record Month | December 2025 | 8.8 million passengers |
| Global Passenger Projection 2026 | Total worldwide air travelers | 10.2 billion passengers |
| Dubai’s 2026 Forecast | Annual passenger projection | 99.5 million passengers |
| Atlanta’s 2024 Performance | Full year passenger traffic | 108.1 million passengers |
| Years Atlanta Held #1 | Consecutive years as busiest (except 2020) | 26 out of 27 years since 1998 |
| Dubai’s Growth Rate 2025 | Year-over-year increase | 3.1% growth |
| TSA Screenings Atlanta 2025 | Record security checkpoint throughput | 30.1 million passengers |
| Dubai Destinations Served | International connectivity | 291 destinations in 110 countries |
| Al Maktoum Airport Expansion | Future capacity investment | $35 billion expansion project |
| Ultimate Dubai Capacity | When Al Maktoum fully complete | 260 million annual passengers |
| Delta’s Market Share Atlanta | Dominant carrier percentage (Sept 2025) | 80% of all passengers |
| US Population Reach Atlanta | Within 2-hour flight radius | 80% of US population |
Data Source: OAG Aviation Data, Dubai Airports, Airports Council International (ACI) World, Hartsfield-Jackson Atlanta International Airport, Reuters, Aviation Week Network (2024-2026)
The data presented reveals fascinating insights into the shifting power dynamics within global aviation. Dubai International Airport’s achievement of 324,000 passengers on January 3, 2026, represents not just a daily record for Dubai but signals the airport’s operational capacity to handle extraordinary volumes while maintaining service quality. This single-day performance exceeded previous records and demonstrated that Dubai’s infrastructure investments are paying dividends. Meanwhile, Atlanta’s stronghold on the title for 26 years since 1998 (interrupted only by the pandemic in 2020) speaks to its strategic positioning as America’s primary domestic hub, with Delta Air Lines commanding an impressive 80% market share as of September 2025.
The $35 billion expansion of Al Maktoum International Airport represents one of the most ambitious aviation infrastructure projects globally, designed to eventually handle 260 million passengers annually when fully completed. This long-term vision positions Dubai not just as a current competitor but as the likely future leader in global aviation capacity. The first phase, expected by 2032, will alone accommodate 150 million passengers yearly, eclipsing current capacity at any existing airport worldwide. Such forward-thinking infrastructure development contrasts with capacity constraints facing many Western airports, where geographic limitations and regulatory hurdles impede expansion.
Top 10 Busiest Airports by Total Passenger Traffic 2024
| Rank | Airport Name | Code | Location | 2024 Passengers | 2023 Comparison | 2019 Comparison |
|---|---|---|---|---|---|---|
| 1 | Hartsfield-Jackson Atlanta International | ATL | Atlanta, USA | 108.1 million | +3.3% | -2.2% |
| 2 | Dubai International Airport | DXB | Dubai, UAE | 92.3 million | +6.1% | +6.9% |
| 3 | Dallas Fort Worth International | DFW | Dallas, USA | 87.8 million | +7.2% | +17.5% |
| 4 | Tokyo Haneda International | HND | Tokyo, Japan | 85.9 million | +9.1% | +0.5% |
| 5 | London Heathrow | LHR | London, UK | 83.9 million | +5.9% | +3.7% |
| 6 | Denver International | DEN | Denver, USA | 82.4 million | +5.8% | +19.3% |
| 7 | Istanbul Airport | IST | Istanbul, Turkey | 80.1 million | +5.3% | +53.4% |
| 8 | Chicago O’Hare International | ORD | Chicago, USA | 80.0 million | +8.3% | -5.4% |
| 9 | Indira Gandhi International | DEL | New Delhi, India | 77.8 million | +7.8% | +13.6% |
| 10 | Shanghai Pudong International | PVG | Shanghai, China | 76.8 million | +41.0% | +0.8% |
Data Source: Airports Council International (ACI) World 2025 Edition Dataset, Aviation Week Network, CNBC (Published April-July 2025)
The 2024 rankings demonstrate significant regional variations in recovery and growth patterns post-pandemic. Hartsfield-Jackson Atlanta maintained its position with 108.1 million passengers despite still operating 2.2% below its 2019 pre-pandemic peak of 110.53 million passengers. This suggests that while Atlanta remains dominant, its growth has plateaued compared to emerging hubs. The 3.3% year-over-year increase from 2023 indicates steady but modest growth, particularly when compared to competitors experiencing double-digit expansion.
Dubai International Airport’s performance stands out with 92.3 million passengers representing 6.9% growth above 2019 levels, making it one of the few major hubs to exceed pre-pandemic traffic substantially. The 6.1% increase from 2023 demonstrates sustained momentum that positions Dubai to potentially claim the overall top spot by late 2026 or early 2027. Istanbul Airport’s phenomenal 53.4% growth compared to 2019 marks the most dramatic expansion in the top ten, reflecting Turkey’s strategic investments in aviation infrastructure and Turkish Airlines’ aggressive network expansion connecting Europe, Asia, and Africa.
Top 10 Busiest International Airports 2024
| Rank | Airport Name | Code | Location | International Passengers 2024 | YoY Growth | vs 2019 |
|---|---|---|---|---|---|---|
| 1 | Dubai International | DXB | Dubai, UAE | 92.3 million | +6.1% | +6.9% |
| 2 | London Heathrow | LHR | London, UK | 79.2 million | +4.0% | +3.7% |
| 3 | Seoul Incheon International | ICN | Seoul, South Korea | 70.7 million | +3.0% | +2.0% |
| 4 | Singapore Changi | SIN | Singapore | 67.1 million | +3.0% | 0% |
| 5 | Amsterdam Schiphol | AMS | Amsterdam, Netherlands | 66.8 million | +2.0% | -2.0% |
| 6 | Paris Charles de Gaulle | CDG | Paris, France | 64.5 million | +3.0% | +1.0% |
| 7 | Istanbul Airport | IST | Istanbul, Turkey | 63.0 million | +6.0% | +59.1% |
| 8 | Frankfurt Airport | FRA | Frankfurt, Germany | 56.2 million | +2.0% | -8.0% |
| 9 | Hong Kong International | HKG | Hong Kong, China | 52.9 million | +12.0% | -14.0% |
| 10 | Doha Hamad International | DOH | Doha, Qatar | 52.7 million | +1.0% | +20.0% |
Data Source: Airports Council International (ACI) World, CNBC Aviation Reports, Aviation A2Z (2024-2025)
International passenger traffic rankings reveal distinct patterns from overall traffic data, with Dubai dominating due to its 100% international passenger composition compared to airports with substantial domestic traffic. Dubai’s 92.3 million international passengers in 2024 significantly exceeded London Heathrow’s 79.2 million, establishing a commanding lead of over 13 million passengers. This gap reflects Dubai’s strategic position as the premier global connecting hub, particularly for traffic between Europe, Asia, Africa, and Australasia.
Istanbul Airport’s extraordinary 59.1% growth versus 2019 demonstrates the most dramatic international traffic expansion among major hubs. This surge reflects Turkish Airlines’ aggressive expansion strategy, Turkey’s visa liberalization policies for numerous countries, and Istanbul’s geographic advantage as a natural bridge between continents. The airport’s modern infrastructure, opened in 2018, provides capacity to sustain this growth trajectory well into the future. Conversely, Hong Kong International’s position at 52.9 million passengers, while showing 12% year-over-year growth, remains 14% below 2019 levels, reflecting lingering impacts from extended pandemic restrictions and geopolitical considerations affecting China’s aviation market.
Top 10 Busiest Cargo Airports 2024
| Rank | Airport Name | Code | Location | Cargo Volume (Metric Tonnes) | YoY Growth | vs 2019 |
|---|---|---|---|---|---|---|
| 1 | Hong Kong International | HKG | Hong Kong, China | 4.9 million | +14.1% | +5.0% |
| 2 | Shanghai Pudong International | PVG | Shanghai, China | 3.9 million | +11.0% | +8.0% |
| 3 | Memphis International | MEM | Memphis, USA | 3.8 million | -3.3% | -2.0% |
| 4 | Louisville Muhammad Ali International | SDF | Louisville, USA | 3.2 million | +15.6% | +12.0% |
| 5 | Anchorage Ted Stevens International | ANC | Anchorage, USA | 3.1 million | +5.0% | +3.0% |
| 6 | Incheon International | ICN | Seoul, South Korea | 3.0 million | +8.0% | +6.0% |
| 7 | Taiwan Taoyuan International | TPE | Taipei, Taiwan | 2.4 million | +7.5% | +4.0% |
| 8 | Los Angeles International | LAX | Los Angeles, USA | 2.3 million | +6.0% | +2.0% |
| 9 | Miami International | MIA | Miami, USA | 2.3 million | +8.0% | +5.0% |
| 10 | Guangzhou Baiyun International | CAN | Guangzhou, China | 2.2 million | +16.9% | +15.0% |
Data Source: Airports Council International (ACI) World, Air Cargo News, Hong Kong International Airport, International Airport Review (April-November 2025)
Global air cargo volumes reached a record 127 million metric tonnes in 2024, representing a 9.9% year-over-year increase and surpassing 2019 levels by 4.1%. This robust recovery was driven by multiple factors including e-commerce acceleration, maritime shipping disruptions (particularly Red Sea security concerns), and declining jet fuel costs that improved air freight competitiveness. The top 20 cargo airports collectively handled 52.2 million tonnes, accounting for over 41% of global cargo traffic and demonstrating significant market concentration.
Hong Kong International Airport reclaimed the top cargo position for the 14th time since 2010, handling 4.9 million tonnes despite facing 14% lower volumes than 2019 for overall operations. The 14.1% year-over-year cargo growth reflects Hong Kong’s strategic pivot toward becoming a specialized cargo hub as passenger traffic recovers more slowly. The airport’s connectivity to 58 airports in 36 Belt and Road Initiative countries as of March 2025 demonstrates China’s strategic use of aviation to support international trade corridors. Shanghai Pudong’s 3.9 million tonnes with 11% growth reinforces China’s dominance in air cargo, with Shanghai and Hong Kong together handling 8.8 million tonnes annually.
Top 10 Busiest Airports by Aircraft Movements 2024
| Rank | Airport Name | Code | Location | Aircraft Movements 2024 | YoY Growth | vs 2019 |
|---|---|---|---|---|---|---|
| 1 | Hartsfield-Jackson Atlanta International | ATL | Atlanta, USA | 796,224 | +2.6% | -11.9% |
| 2 | Chicago O’Hare International | ORD | Chicago, USA | 776,036 | +7.7% | -8.5% |
| 3 | Dallas Fort Worth International | DFW | Dallas, USA | 717,000 | +4.9% | +8.0% |
| 4 | Denver International | DEN | Denver, USA | 682,000 | +4.9% | +15.0% |
| 5 | Los Angeles International | LAX | Los Angeles, USA | 578,000 | +3.5% | -5.0% |
| 6 | Charlotte Douglas International | CLT | Charlotte, USA | 548,000 | +5.0% | +6.0% |
| 7 | Tokyo Haneda International | HND | Tokyo, Japan | 487,000 | +4.0% | -2.0% |
| 8 | Shanghai Pudong International | PVG | Shanghai, China | 485,000 | +29.0% | +5.0% |
| 9 | Istanbul Airport | IST | Istanbul, Turkey | 468,000 | +8.0% | +25.0% |
| 10 | Guangzhou Baiyun International | CAN | Guangzhou, China | 461,000 | +12.3% | +8.0% |
Data Source: Airports Council International (ACI) World, Bureau of Transportation Statistics, International Airport Review, Chicago Department of Aviation (2024-2025)
Global aircraft movements reached 100.6 million in 2024, a 3.9% increase from 2023 but still representing only 96.8% of 2019 levels, indicating that while passenger numbers have recovered, flight frequencies haven’t fully returned to pre-pandemic operations. This discrepancy reflects airlines’ strategic shift toward larger aircraft and higher load factors, maximizing passenger capacity per flight rather than frequency. The top 20 airports recorded 11.08 million movements, a 5.4% year-over-year increase, suggesting concentrated growth at major hubs.
Hartsfield-Jackson Atlanta led with 796,224 movements despite being 11.9% below 2019’s record 904,301 operations, reflecting reduced frequency even as passenger numbers approached historical highs. Chicago O’Hare’s second-place position with 776,036 movements and 7.7% growth demonstrates strong operational recovery, though still 8.5% below 2019. The airport’s strategic importance as a domestic and international hub for United Airlines and American Airlines ensures sustained high movement counts. Dallas Fort Worth and Denver both exceeded 2019 movement levels by 8% and 15% respectively, indicating genuine operational expansion rather than mere recovery.
February 2026 Current Rankings (Seat Capacity)
| Rank | Airport Name | Code | Location | February 2026 Seats | YoY Change | Category |
|---|---|---|---|---|---|---|
| 1 | Dubai International | DXB | Dubai, UAE | 4.90 million | +2% | Global Leader |
| 2 | Atlanta Hartsfield-Jackson | ATL | Atlanta, USA | 4.60 million | +1% | Global #2 |
| 3 | Shanghai Pudong | PVG | Shanghai, China | 4.28 million | +7% | Global #3 |
| 4 | Tokyo Haneda | HND | Tokyo, Japan | 4.18 million | -1% | Global #4 |
| 5 | London Heathrow | LHR | London, UK | 3.86 million | 0% | Europe #1 |
| 6 | Istanbul Airport | IST | Istanbul, Turkey | 3.68 million | +2% | Europe #2 |
| 7 | Seoul Incheon | ICN | Seoul, South Korea | 3.55 million | +5% | International #3 |
| 8 | Singapore Changi | SIN | Singapore | 3.44 million | +4% | International #4 |
| 9 | Hong Kong International | HKG | Hong Kong, China | 3.28 million | +12% | International #5 |
| 10 | Paris Charles de Gaulle | CDG | Paris, France | 3.06 million | +1% | Europe #3 |
Data Source: OAG Aviation Worldwide Limited, February 2026 Busiest Airports Report (Published February 6, 2026)
The February 2026 rankings represent a historic moment in global aviation as Dubai International Airport officially claimed the top position with 4.90 million seats, surpassing Atlanta’s 4.60 million seats. This 2% year-over-year growth for Dubai, combined with Atlanta’s modest 1% increase, signals a potential permanent shift in the global aviation hierarchy. The 300,000-seat gap between the two airports in a single month is substantial and reflects Dubai’s aggressive capacity expansion and Emirates Airlines’ strategic growth initiatives.
Shanghai Pudong’s third-place position with 4.28 million seats and remarkable 7% growth demonstrates China’s aviation market recovery and expansion. The airport’s positioning ahead of Tokyo Haneda (which experienced a 1% decline) indicates shifting power dynamics within Asia-Pacific aviation. Hong Kong International’s impressive 12% growth to 3.28 million seats represents the strongest year-over-year expansion in the top ten, signaling robust recovery in Hong Kong’s aviation sector following pandemic restrictions and positioning the airport for potential upward movement in global rankings throughout 2026.
Dubai International Airport 2026 Projections and Records
| Metric Category | Value | Comparison/Context |
|---|---|---|
| 2026 Annual Forecast | 99.5 million passengers | +4.5% vs 2025 (95.2 million) |
| 2025 Full Year | 95.2 million passengers | +3.1% vs 2024 (92.3 million) |
| Record Single Day | 324,000 passengers | January 3, 2026 |
| Record Month | 8.8 million passengers | December 2025 |
| Record Quarter | 25.1 million passengers | Q4 2025 (+5.9% vs Q4 2024) |
| 100M Milestone Expected | Late 2026 or early 2027 | Originally forecast for 2027 |
| Largest Country Market | India: 11.9 million | 2025 data |
| Second Largest Market | Saudi Arabia: 7.5 million | 2025 data |
| Third Largest Market | UK: 6.3 million | 2025 data |
| Busiest City Route | London: 3.9 million | 2025 data |
| Total Destinations | 291 destinations | 110 countries |
| Airline Partners | 108 international airlines | As of end 2025 |
| Operating Capacity Status | “Edge of physical capacity” | CEO Paul Griffiths, Jan 2026 |
Data Source: Dubai Airports, Reuters, The National (UAE), Travel and Tour World (February 2026)
Dubai International Airport’s trajectory toward 99.5 million passengers in 2026 represents a 4.5% growth rate that, while slightly lower than previous years, still positions the airport to potentially breach the 100 million passenger threshold by year-end 2026. CEO Paul Griffiths’ statement that the airport operates “at the edge of physical capacity” highlights both the success of Dubai’s aviation strategy and the urgent need for the Al Maktoum International Airport expansion, which will ultimately provide 260 million annual passenger capacity when fully completed.
The record 324,000 passengers on January 3, 2026, followed by 322,000 on January 4, demonstrates Dubai’s ability to handle extreme peak-day volumes that would overwhelm many airports. These single-day records exceed the daily average of approximately 260,000 passengers (95.2 million divided by 365 days), indicating sophisticated operational management during peak holiday periods. The consistent performance with daily volumes above 300,000 during early January 2026 suggests sustained high demand rather than isolated peak events.
Atlanta Airport 2024-2025 Performance Data
| Performance Metric | Value | Growth/Comparison |
|---|---|---|
| 2024 Total Passengers | 108.1 million | +3.3% vs 2023 (104.65 million) |
| 2024 vs Record (2019) | 108.1 million vs 110.53 million | -2.2% below all-time high |
| 2024 Aircraft Movements | 796,224 | +2.6% vs 2023 (775,818) |
| 2024 Cargo Operations | 1.46 million tons | +6% vs 2023 |
| TSA Screenings 2025 | 30.1 million | First time exceeding 30 million |
| Delta Market Share | 80% of passengers | September 2025 data |
| Delta Daily Passengers | 225,000+ | September 2025 average |
| Economic Impact | $34.8 billion | Metro Atlanta regional economy |
| Employment | 63,000+ employees | Georgia’s largest single-site employer |
| Airport Size | 4,700 acres | 193 gates across 7 concourses |
| Planned Capacity | 125 million annual | Within 5 years through upgrades |
| US Population Access | 80% within 2-hour flight | Strategic geographic positioning |
Data Source: Hartsfield-Jackson Atlanta International Airport, Atlanta Journal-Constitution, Aviation Week Network, ATL Airport Chamber (2024-2026)
Atlanta’s 108.1 million passengers in 2024 represents the second-highest annual total in airport history, trailing only the pre-pandemic 2019 record of 110.53 million. The 2.2% gap to the all-time high suggests Atlanta is approaching but has not yet fully recovered to maximum capacity, contrasting with Dubai’s trajectory of exceeding pre-pandemic levels. The 3.3% year-over-year growth from 2023 indicates steady expansion but at a slower rate than competing hubs like Dubai (6.1%) or Istanbul (5.3%).
The 30.1 million TSA screenings in 2025 mark a significant milestone as the first time this threshold was exceeded, demonstrating sustained high passenger volumes throughout the year. Delta Air Lines’ commanding 80% market share with over 225,000 daily passengers highlights Atlanta’s unique position as an airline-dominated hub rather than a balanced multi-carrier airport. This concentration creates operational efficiency but also vulnerability to Delta’s strategic decisions. The planned capacity expansion to 125 million annual passengers within 5 years demonstrates Atlanta’s commitment to maintaining competitiveness, though the $34.8 billion economic impact and 63,000 employees illustrate the airport’s critical role beyond just passenger counts.
Global Aviation Trends and 2026 Outlook
| Trend Category | 2024 Actual | 2025 Performance | 2026 Projection |
|---|---|---|---|
| Global Passengers | 9.4 billion (+8.4% vs 2023) | 9.9 billion (est.) | 10.2 billion (+3.9%) |
| vs 2019 Levels | +2.7% above pre-pandemic | +5% approx. | +8-10% above 2019 |
| Global Cargo | 127 million tonnes (+9.9%) | 130 million tonnes (est.) | 135 million tonnes (proj.) |
| Aircraft Movements | 100.6 million (+3.9%) | 104 million (est.) | 107 million (proj.) |
| Top 10 Airport Share | 9% of global traffic | 9.5% (est.) | 10% (proj.) |
| Middle East Growth | 17% cargo, 6% passengers | 8-10% growth | 7-9% growth |
| Asia-Pacific Growth | 15.3% cargo recovery | 12% growth | 10% growth |
| North America Growth | 4.5% passengers | 3.8% growth | 3.5% growth |
| Europe Recovery | 9.7% cargo, 5% passengers | 6% growth | 5% growth |
Data Source: Airports Council International (ACI) World, IATA, Aviation Week Network, Air Cargo News (2024-2026 forecasts)
Global aviation has fully recovered from pandemic disruptions, with 2024 passenger numbers reaching 9.4 billion, exceeding 2019 levels by 2.7%. The 8.4% year-over-year growth from 2023 represents the final phase of rapid recovery, with 2025’s projected 9.9 billion and 2026’s forecast 10.2 billion passengers indicating a transition from recovery-driven surges to sustainable structural growth at approximately 3.9% annually. This moderation reflects market maturation, capacity constraints at major airports, and aircraft manufacturing delays limiting airline fleet expansion.
The 127 million tonnes of air cargo in 2024, up 9.9% year-over-year and 4.1% above 2019, demonstrates that freight recovery has outpaced passenger recovery in relative terms. Three primary factors drove this cargo boom: maritime shipping disruptions (particularly Red Sea security concerns and Panama Canal restrictions) leading to sea-air modal shifts; explosive e-commerce growth demanding faster fulfillment; and declining jet fuel costs improving air freight economics. The Middle East’s 17% cargo growth led all regions, with Dubai International jumping from 17th to 11th globally in cargo rankings, while Asia-Pacific’s 15.3% growth reflected China’s export surge and Southeast Asian manufacturing expansion.
Regional Airport Performance Highlights 2024-2026
| Region | Key Performers | Notable Statistics |
|---|---|---|
| North America | 6 airports in global top 20 | ATL, DFW, DEN, ORD, LAX, CLT |
| United States | 15 airports in global top 50 | Down from 16 in 2023 |
| Middle East | DXB, IST, DOH | Fastest passenger growth region (6-8%) |
| Asia-Pacific | 14 airports in top 50 | Up from 12 in 2023 |
| China | 12 airports in top 50 | PVG jumped 11 places to #10 |
| Europe | 8 airports in top 50 | Steady recovery, 4-6% growth |
| India | 2 airports in top 50 | DEL (#9), second Indian hub |
| Latin America | 1 airport in top 50 | 6.9% cargo growth region |
Data Source: Airports Council International (ACI) World, Wikipedia List of Busiest Airports, CNBC (2024-2025)
North America maintained dominance with 17 airports in the global top 50 (down from 18 in 2023), though this slight decline suggests market share erosion to rapidly expanding Asian and Middle Eastern hubs. The United States’ 15 airports in the top 50 reflect sustained domestic market strength, with 6 airports breaking into the top 20 globally. However, most US airports showed modest single-digit growth (3-5% annually), contrasting sharply with Middle Eastern hubs posting 6-8% growth and Asian airports like Shanghai Pudong recording spectacular 41% year-over-year increases.
Asia-Pacific’s expansion from 12 to 14 airports in the top 50 between 2023 and 2024 signals the region’s rising prominence, driven primarily by China’s aviation market reopening and expansion. China alone contributed 12 airports to the top 50, up from 10 in 2023, with Shanghai Pudong’s jump from 21st to 10th globally representing the most dramatic single-airport advancement in the rankings. Guangzhou Baiyun, which ranked 57th in 2022, reached 12th place by 2024, demonstrating China’s extraordinary aviation growth trajectory. The Middle East’s concentration around three major hubs—Dubai, Istanbul, and Doha—reflects a hub-and-spoke strategy that channels international traffic through a limited number of mega-airports rather than distributing across numerous smaller facilities.
Infrastructure and Capacity Development 2026
| Airport | Expansion Project | Investment | Capacity Target | Timeline |
|---|---|---|---|---|
| Al Maktoum (Dubai) | Full airport development | $35 billion | 260 million annual (ultimate) | Phase 1: 2032 (150M) |
| Atlanta (ATL) | Terminal modernization | $1 billion (6-year) | 125 million annual | Within 5 years |
| Istanbul (IST) | SmartIST Mega Cargo | Completed 2022 | 2.2 million tonnes cargo | Operational |
| Hong Kong (HKG) | Three-Runway System | Major investment | 120 million annual target | Commissioned |
| Singapore (SIN) | Terminal 5 | $13 billion | 50 million additional | 2030s |
| Boston Logan (BOS) | Terminal C replacement | Part of $10B plan | 54 million annual (+10M) | 2026-2036 |
| Denver (DEN) | Gate expansion | Ongoing | 100 million+ capability | Continuous |
Data Source: Dubai Airports, Massport, Hong Kong Airport Authority, Aviation Week Network, Airport Industry News (2024-2026)
Infrastructure development represents the critical differentiator between airports that will dominate future rankings and those constrained by physical limitations. Dubai’s $35 billion Al Maktoum expansion dwarfs all other airport infrastructure projects globally, with its ultimate 260 million annual passenger capacity exceeding the combined capacity of many major airport systems. The phased approach, with 150 million capacity by 2032, ensures Dubai will possess surplus capacity to accommodate growth while competitors face constraints. This strategic overcapacity mirrors Singapore’s approach with Changi Airport and contrasts sharply with capacity-constrained European and North American hubs.
Atlanta’s more modest $1 billion six-year capital program aims for 125 million annual passengers but faces challenges including the loss of $37.5 million in federal grants due to policy disputes with the FAA, delaying critical taxiway and terminal renovations. The 125 million target represents only 13% growth from current 110 million peak capacity, suggesting Atlanta’s expansion is designed primarily to maintain competitiveness rather than achieve dominance. Hong Kong’s Three-Runway System, though commissioned, targets 120 million annual passengers with 10 million tonnes of cargo within a decade—ambitious goals requiring sustained 12-15% annual growth rates that may prove challenging given geopolitical headwinds.
Emerging Challenges and Constraints 2026
| Challenge Category | Impact | Affected Regions |
|---|---|---|
| Aircraft Manufacturing Delays | Reduced fleet expansion capacity | Global, especially North America, Europe |
| Airspace Capacity Constraints | Limited flight frequency increases | Europe (especially London, Amsterdam) |
| Environmental Regulations | Flight caps, noise restrictions | Netherlands, UK, Germany |
| Geopolitical Tensions | Route disruptions, increased costs | Russia overflight restrictions, Middle East |
| Labor Shortages | Operational bottlenecks | North America, Europe |
| Infrastructure Age | Terminal/runway constraints | North America legacy airports |
| Climate Events | Increased weather disruptions | Global, especially winter operations |
| Overtourism Backlash | Political pressure to limit growth | Amsterdam, Barcelona, tourist cities |
Data Source: Airports Council International (ACI) World, Aviation Week Network, ACI Director General Justin Erbacci statements (2024-2026)
ACI World Director General Justin Erbacci warned that “long-term growth is not guaranteed without coordinated action” to address mounting capacity constraints. Aircraft manufacturing delays from Boeing and Airbus, stemming from supply chain disruptions and production quality issues, have created a 2-3 year backlog preventing airlines from expanding fleets to meet demand. This bottleneck particularly affects North American and European carriers, giving competitive advantages to Middle Eastern and Asian airlines with newer fleets and aggressive aircraft orders.
Environmental regulations present increasingly binding constraints, with the Dutch government’s attempted flight caps at Amsterdam Schiphol, though legally challenged, representing a broader trend toward restricting airport growth on environmental grounds. Schiphol’s struggles with winter 2026 conditions forcing hundreds of flight cancellations demonstrate how environmental standards (noise limits, emissions targets) can exacerbate weather-related disruptions. Atlanta specifically faces a unique challenge having forfeited $37.5 million in federal grants—part of its $1 billion six-year capital program—due to local policy disputes with the FAA over grant compliance requirements, directly hampering expansion efforts.
Disclaimer: The data research report we present here is based on information found from various sources. We are not liable for any financial loss, errors, or damages of any kind that may result from the use of the information herein. We acknowledge that though we try to report accurately, we cannot verify the absolute facts of everything that has been represented.