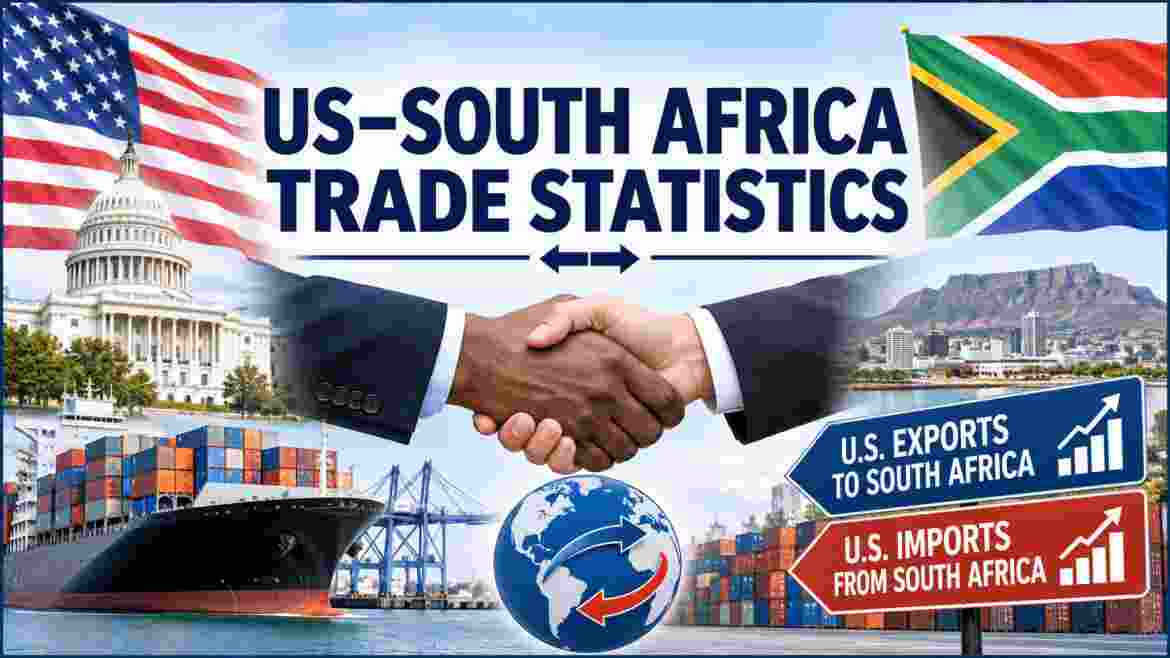
US–South Africa trade for 2026 show a US goods deficit of $3.26 billion in January through August 2026, down 60.3% from $8.20 billion a year earlier, after a 2025 deficit of $10.16 billion on $6.29 billion of US exports and $16.45 billion of imports. On November 2, 2026, the US announced it will suspend South Africa from AGOA duty-free access effective January 1, 2027, affecting about $1.7 billion of 2025 exports, while a 12.5% Section 301 tariff has applied to most South African goods since July 24, 2026.
US–South Africa Trade 2026 – Introduction
US–South Africa trade is under pressure on three fronts at once. Tariffs on South African goods have taken four different levels since April 2025, the African Growth and Opportunity Act is about to end for South Africa, and the monthly numbers have swung sharply. On November 2, 2026, Washington said South Africa will lose AGOA duty-free access on January 1, 2027. The US ran a goods deficit of $10.16 billion with South Africa in 2025.
The deficit is shrinking in 2026, but not because trade has stopped. US exports to South Africa are up and imports are down. The picture also depends on which months you compare, because early 2025 imports were unusually large. This report covers the US–South Africa trade statistics that matter most: annual and monthly goods trade, product mix, tariff rates, AGOA exposure and tariff impact estimates.
Interesting Facts about US–South Africa Trade 2026
US GOODS TRADE WITH SOUTH AFRICA, 2025 (billions of dollars; each █ = $0.5B)

US exports to South Africa  | █████████████ 6.29
US imports from South Africa| █████████████████████████████████ 16.45
US goods deficit            | ████████████████████ 10.16
| Fact | 2026 Data |
|---|---|
| US goods exports to South Africa, 2025 | $6.29 billion |
| US goods imports from South Africa, 2025 | $16.45 billion |
| US goods deficit, 2025 | $10.16 billion |
| US goods deficit, January to August 2026 | $3.26 billion |
| South African exports under AGOA, 2025 | About $1.7 billion |
| Current tariff on most South African goods | 12.5%, since July 24, 2026 |
| AGOA suspension date | January 1, 2027 |
| US services surplus with South Africa, 2025 | $1.9 billion |
Source: US Census Bureau, Trade in Goods with South Africa; Reuters, November 2, 2026; Office of the US Trade Representative, 2025 estimates. Census figures are nominal and not seasonally adjusted.
The US imported $16.45 billion of goods from South Africa in 2025 and exported $6.29 billion, leaving a deficit of $10.16 billion. That deficit was 14.7% larger than in 2024. In services, the US ran a surplus of $1.9 billion, with $4.0 billion of exports against $2.0 billion of imports, according to US Trade Representative estimates. Total goods and services trade reached about $28.8 billion.
The 2026 numbers point the other way. Through August, the goods deficit was $3.26 billion, against $8.20 billion a year earlier, by our calculation. A 12.5% tariff now applies to most South African goods. AGOA, which lets many African exports enter duty free, will end for South Africa on January 1, 2027, according to the US Trade Representative.
US–South Africa Goods Trade by Year 2016 to 2025
US GOODS DEFICIT WITH SOUTH AFRICA BY YEAR (billions; each █ = $0.5B)

2016 | ████ 2.2
2017 | █████ 2.7
2018 | ██████ 2.9
2019 | █████ 2.4
2020 | ██████████████ 7.0
2021 | █████████████████████ 10.3
2022 | ████████████████ 8.1
2023 | ██████████████ 6.8
2024 | ██████████████████ 8.9
2025 | ████████████████████ 10.2
| Year | US Exports | US Imports | Goods Deficit |
|---|---|---|---|
| 2016 | $4.60 billion | $6.78 billion | $2.18 billion |
| 2017 | $5.05 billion | $7.74 billion | $2.68 billion |
| 2018 | $5.53 billion | $8.47 billion | $2.93 billion |
| 2019 | $5.37 billion | $7.79 billion | $2.43 billion |
| 2020 | $4.38 billion | $11.36 billion | $6.99 billion |
| 2021 | $5.47 billion | $15.74 billion | $10.26 billion |
| 2022 | $6.49 billion | $14.57 billion | $8.08 billion |
| 2023 | $7.14 billion | $13.97 billion | $6.83 billion |
| 2024 | $5.82 billion | $14.68 billion | $8.86 billion |
| 2025 | $6.29 billion | $16.45 billion | $10.16 billion |
Source: US Census Bureau, Trade in Goods with South Africa, nominal US dollars, not seasonally adjusted. The 10-year deficit total and percentage changes are our calculation.
The deficit jumped between 2019 and 2020, from $2.43 billion to $6.99 billion, as imports rose from $7.79 billion to $11.36 billion. It peaked at $10.26 billion in 2021 and hit $10.16 billion in 2025, the second-highest on record. Over 10 years, imports grew 142.5%, from $6.78 billion to $16.45 billion, while US exports grew 36.8%, from $4.60 billion to $6.29 billion, by our calculation.
The 2016 to 2025 deficits total $61.4 billion, by our calculation. In 2025, US exports rose 8.1% and imports rose 12.1% from 2024, which lifted the deficit 14.7%. The 2023 peak in US exports at $7.14 billion has not been matched since. Precious metals, vehicles and industrial inputs drive the import side, so commodity prices explain much of the year-to-year movement.
US–South Africa Monthly Goods Trade January to August 2026
US GOODS DEFICIT WITH SOUTH AFRICA BY MONTH, 2026 (millions; each █ = $50M)

January  | ████████████ 620.0
February | █████████ 472.4
March    | █ 51.4
April    | ████ 175.6
May      | ██ 113.2
June     | █████████████ 664.0
July     | █████████ 454.4
August   | ██████████████ 707.1
| Month (2026) | US Exports | US Imports | Balance |
|---|---|---|---|
| January | $375.6 million | $995.6 million | -$620.0 million |
| February | $366.9 million | $839.3 million | -$472.4 million |
| March | $782.5 million | $833.9 million | -$51.4 million |
| April | $641.6 million | $817.3 million | -$175.6 million |
| May | $863.7 million | $976.9 million | -$113.2 million |
| June | $505.3 million | $1,169.2 million | -$664.0 million |
| July | $478.7 million | $933.1 million | -$454.4 million |
| August | $606.0 million | $1,313.1 million | -$707.1 million |
| Total | $4,620.3 million | $7,878.3 million | -$3,258.1 million |
Source: US Census Bureau, Trade in Goods with South Africa, 2026 monthly data through August. Nominal dollars, not seasonally adjusted.
The monthly balance moved widely. March was close to balanced at a deficit of $51.4 million, helped by exports of $782.5 million. May exports reached $863.7 million, the highest of the year, and the May deficit was $113.2 million. The deficit then widened to $664.0 million in June and $707.1 million in August. August imports of $1,313.1 million were the highest of any month in 2026.
Imports were higher in summer. They averaged $876.0 million in March through May and $1,138.5 million in June through August, by our calculation, a rise of 30.0%. Exports fell from a spring average of $762.6 million to $530.0 million over the summer. The Census data do not give reasons, and they cover goods only. The 12.5% Section 301 tariff took effect on July 24, so it touches only the last weeks of the table.
US–South Africa Trade 2026 vs 2025 Comparison
US GOODS TRADE WITH SOUTH AFRICA, JANUARY TO AUGUST (millions; each █ = $500M)

2025 exports | █████████ 4,285.0
2026 exports | █████████ 4,620.3
2025 imports | █████████████████████████ 12,484.2
2026 imports | ████████████████ 7,878.3
| Measure | January to August 2025 | January to August 2026 | Change |
|---|---|---|---|
| US exports | $4,285.0 million | $4,620.3 million | +7.8% |
| US imports | $12,484.2 million | $7,878.3 million | -36.9% |
| Goods balance | -$8,199.2 million | -$3,258.1 million | -60.3% |
| Exports, March to August | $3,421.6 million | $3,877.8 million | +13.3% |
| Imports, March to August | $6,895.7 million | $6,043.4 million | -12.4% |
Source: US Census Bureau, Trade in Goods with South Africa, 2025 and 2026 monthly data. Sums and percentage changes are our calculation.
Over the first eight months, US exports to South Africa rose 7.8% to $4.62 billion, while imports fell 36.9% to $7.88 billion. The deficit narrowed 60.3%, from $8.20 billion to $3.26 billion. That headline is exaggerated by a base effect. January and February 2025 imports were $2.25 billion and $3.34 billion, together 44.8% of the whole eight-month 2025 import total, by our calculation.
Excluding those two months gives a fairer comparison. From March through August, exports rose 13.3% and imports fell 12.4%, a smaller but still real shift. The Census data do not explain the early 2025 spike. Tariffs, exchange rates and commodity prices are all possible factors, and nothing in this table proves cause. The AGOA suspension and the 12.5% tariff came after most of these months.
US Imports from South Africa by Product 2026
US IMPORTS FROM SOUTH AFRICA BY PRODUCT, 2024 (billions; each █ = $0.25B)

Precious stones and metals | █████████████████████████████████ 8.47
Vehicles                   | █████████ 2.27
Iron and steel             | ██ 0.52
Aluminum                   | ██ 0.40
Ores, slag and ash         | █ 0.38
Machinery                  | █ 0.29
Fruit, nuts and citrus     | █ 0.27
| Product Category | 2024 Imports | Share of $14.68 Billion |
|---|---|---|
| Precious stones and metals | $8.47 billion | 57.7% |
| Vehicles | $2.27 billion | 15.5% |
| Iron and steel | $518.7 million | 3.5% |
| Aluminum | $399.8 million | 2.7% |
| Ores, slag and ash | $383.1 million | 2.6% |
| Machinery | $292.9 million | 2.0% |
| Fruit, nuts and citrus | $266.7 million | 1.8% |
Source: United Nations Comtrade via Trading Economics, 2024 data; US Census Bureau for the $14.68 billion total. Shares are our calculation. These are the latest product figures retrieved; 2025 detail was not available.
Precious stones and metals dominate US imports from South Africa, at $8.47 billion, or 57.7% of the $14.68 billion total in 2024. Vehicles come next at $2.27 billion, or 15.5%. South Africa’s trade ministry puts platinum group metals at 31.8% and vehicles at 21.8% of its 2024 exports to the US, and says the categories it lists made up just over 80% of the basket. The two sources use different measures.
Smaller lines add detail. Iron and steel reached $518.7 million and aluminum $399.8 million. Ores totaled $383.1 million, machinery $292.9 million and edible fruit, nuts and citrus $266.7 million. Vehicles face a 25% Section 232 tariff and so fall outside the new Section 301 duty. That split explains why tariffs affect different parts of this table very differently.
US Exports to South Africa by Product 2025
SOUTH AFRICAN IMPORTS FROM THE US BY PRODUCT, 2025 (millions; each █ = $50M)

Machinery            | ████████████████████████████████ 1,600
Mineral fuels        | ████████████████████████ 1,210
Aircraft             | ██████████████ 697
Unspecified goods    | ████████████ 605
Optical and medical  | ██████████ 516
Vehicles             | █████████ 464
Electrical equipment | ███████ 371
| Product Category | 2025 Value | Share of $7.64 Billion |
|---|---|---|
| Machinery and boilers | $1.60 billion | 20.9% |
| Mineral fuels and oils | $1.21 billion | 15.8% |
| Aircraft and spacecraft | $696.8 million | 9.1% |
| Unspecified commodities | $604.6 million | 7.9% |
| Optical, photo and medical apparatus | $516.0 million | 6.8% |
| Vehicles | $463.6 million | 6.1% |
| Electrical equipment | $371.0 million | 4.9% |
Source: United Nations Comtrade via Trading Economics, 2025, South Africa’s reported imports from the United States. These are South African import records, which differ from US Census export data. Shares are our calculation.
These figures come from South Africa’s side of the ledger, so they differ from US Census data. South Africa reported $7.64 billion of imports from the US in 2025, against $6.29 billion of US-reported exports, a gap of about 21.4%, by our calculation. Differences like this reflect timing, valuation, shipping routes and how each country counts goods in transit. Product shares are still useful for ranking.
Machinery leads at $1.60 billion, or 20.9%, followed by mineral fuels at $1.21 billion, or 15.8%, and aircraft at $696.8 million, or 9.1%. Optical and medical equipment follow at $516.0 million, then vehicles at $463.6 million and electrical equipment at $371.0 million. Chemicals, pharmaceutical products and plastics each added between $258 million and $362 million. South Africa’s tariffs on US goods are not covered here.
US Tariffs on South African Goods Timeline 2025 to 2026
US TARIFF RATE ON MOST SOUTH AFRICAN GOODS (percent; each █ = 1%)

April 2025 to August 2025   | ██████████ 10%
August 2025 to February 2026| ██████████████████████████████ 30%
February 2026 to July 24    | ██████████ 10%
From July 24, 2026          | █████████████ 12.5%
| Period | Rate on Most Goods | Authority |
|---|---|---|
| April 2025 to August 2025 | 10% | Reciprocal tariff baseline |
| August 2025 to February 2026 | 30% | Reciprocal tariff on South Africa |
| February 2026 to July 24, 2026 | 10% | Section 122, 150-day global tariff |
| From July 24, 2026 | 12.5% | Section 301 forced-labor tariff |
| Autos and many steel and aluminum goods | 25% | Section 232 |
| Exempt from Section 301 | Section 232 goods, civil aircraft, patented medicines | Exemptions |
Source: Semafor, February 23, 2026; Daily Maverick, July 24 and August 5, 2026; Engineering News, July 24, 2026; US Trade Representative notices. Dates are approximate where sources differ.
The tariff rate has taken four different levels in 18 months. A 10% baseline arrived in April 2025, and a 30% reciprocal rate on South Africa followed in August. After the Supreme Court struck down those emergency tariffs in February 2026, a temporary 10% global tariff under Section 122 replaced them. That tariff expired on July 24, 2026 after its 150-day limit, and a new Section 301 tariff took over.
South Africa received 12.5%, in a higher tier with China, Japan and South Korea. The US says South Africa does not adequately enforce a ban on imports made with forced labor. South Africa rejects this and says it already bans such goods. The tariff covers 60 economies. Goods in transit on July 24 had until midnight on July 28. Section 232 tariffs of 25% apply to autos and some metals.
AGOA Statistics for South Africa 2026
SOUTH AFRICAN EXPORTS TO THE US IN 2025, AGOA VS OTHER (billions; each █ = $0.5B)

Under AGOA | ███ 1.7
Other      | ██████████████████████████████ 14.8
| AGOA Measure | Figure |
|---|---|
| South African exports under AGOA, 2025 | About $1.7 billion |
| Share of South Africa’s exports to the US | About 10% |
| Share of South Africa’s total global exports | About 1% |
| Original expiry | September 30, 2025 |
| Reauthorization signed | February 3, 2026, through December 31, 2026 |
| Suspension announced | November 2, 2026, effective January 1, 2027 |
| Annual eligibility review opened | June 30, 2026 |
Source: Reuters, November 2, 2026; South Africa’s Department of Trade, Industry and Competition; US Trade Representative notices, 2026. The $14.8 billion figure is our calculation: $16.45 billion of 2025 imports minus $1.7 billion.
South Africa was the largest AGOA beneficiary, sending about $1.7 billion of goods under the program in 2025. By our calculation that is about 10% of the $16.45 billion of US imports from South Africa, which matches the figure from South Africa’s trade department. It is about 1% of South Africa’s total exports to the world. Motor vehicles and parts, farm goods and wine make up most of the AGOA trade.
The program lapsed on September 30, 2025 and Congress renewed it on February 3, 2026, retroactively, through December 31, 2026. On November 2, USTR Jamieson Greer said the president found South Africa and Rwanda have practices inconsistent with AGOA’s eligibility criteria. Washington cited barriers to US trade and investment, corruption and threats to US national security and foreign policy interests. South Africa’s trade department said it was prepared for this outcome.
Tariff Impact Estimates on South African Exports 2026
ESTIMATED AVERAGE US TARIFF ON SOUTH AFRICAN EXPORTS (percent; each █ = 1%)

Non-gold exports at 30% tariff regime  | █████████████████ 16.9
Non-gold exports at 12.5% tariff       | ███████████ 11.2
Trade-weighted, before July 24         | █████████ 8.5
Trade-weighted, after July 24          | █████████ 8.9
| Estimate | Figure | Source |
|---|---|---|
| Average tariff on non-gold exports, 30% regime | 16.9% | Chien and Edwards, University of Cape Town |
| Average tariff on non-gold exports, 12.5% regime | 11.2% | Chien and Edwards |
| Trade-weighted tariff before July 24 | 8.5% | Naumann, Trade Law Centre |
| Trade-weighted tariff after July 24 | 8.9% | Naumann |
| Products facing Section 301 | Over 80% of about 2,700 | Chien and Edwards |
| Predicted drop in vehicle exports | 58% | Chien and Edwards |
Source: Business Day, August 28, 2026; Daily Maverick, August 5, 2026. These are economists’ estimates, not official figures.
Two economists estimate that replacing the 30% reciprocal tariff with 12.5% cuts the import-weighted average tariff on South African non-gold exports from 16.9% to 11.2%. Another, Eckart Naumann, says the shift from the 10% Section 122 tariff to Section 301 raised the trade-weighted applied tariff only from 8.5% to 8.9%. The averages are low because the Section 301 tariff covers only a fraction of export value.
The averages hide hard-hit sectors. Over 80% of the roughly 2,700 products the US imported from South Africa in 2024 face the Section 301 tariff, though they are of low aggregate value. Vehicles are hit hardest, by the 25% Section 232 tariff, and exports are predicted to fall 58%. Chemicals and basic metals are also strongly affected. These are projections, and actual 2026 and 2027 trade will decide whether they hold.
South Africa’s Share of US Trade and Economic Exposure 2026
TOTAL US GOODS AND SERVICES TRADE WITH SOUTH AFRICA (billions; each █ = $1B)

2024 | ██████████████████████████ 26.2
2025 | █████████████████████████████ 28.8
| Measure | Figure | Year |
|---|---|---|
| Total goods and services trade | $28.8 billion | 2025 |
| Total goods and services trade | $26.2 billion | 2024 |
| Goods trade | $22.7 billion | 2025 |
| US services exports and imports | $4.0 billion and $2.0 billion | 2025 |
| South Africa’s exports to the US as a share of its exports | 13.3% | 2024 |
| South African goods as a share of US imports | 0.44% | 2024 |
| Exports to the US as a share of South Africa’s GDP | 2.2% | 2024 |
Source: Office of the US Trade Representative estimates, 2024 and 2025; Daily Maverick, April 9, 2025; Serrari Group, 2025. USTR figures are estimates, not final customs data.
South Africa is a small US trading partner but a large market for itself. Total goods and services trade reached $28.8 billion in 2025, up 10.1% from $26.2 billion in 2024, according to USTR estimates. Goods made up $22.7 billion. US services exports were $4.0 billion and imports were $2.0 billion, which gives the US a services surplus of $1.9 billion that the goods deficit does not capture.
The exposure is lopsided. South African goods were just 0.44% of all US imports in 2024. The US took 13.3% of South Africa’s global exports, and those exports were equal to about 2.2% of its GDP. A tariff or AGOA change therefore matters far more to South African exporters than to US importers. South Africa’s trade department says it is seeking new markets and trade deals with other partners.
Frequently Asked Questions About US–South Africa Trade 2026
What is the US trade deficit with South Africa in 2026?
The US goods deficit with South Africa was $3.26 billion from January through August 2026, down 60.3% from $8.20 billion a year earlier, according to Census Bureau data.
How much did the US import from South Africa in 2025?
The US imported $16.45 billion of goods from South Africa in 2025, up 12.1% from 2024.
How much did the US export to South Africa in 2025?
US goods exports to South Africa were $6.29 billion in 2025, up 8.1% from 2024.
What is the US trade deficit with South Africa for 2025?
$10.16 billion in goods, up 14.7%, plus a US services surplus of $1.9 billion, according to US Trade Representative estimates.
What is AGOA and does South Africa still qualify in 2026?
AGOA is the African Growth and Opportunity Act, which gives many African exports duty-free access. The US announced on November 2, 2026 that South Africa will be suspended effective January 1, 2027.
How much does South Africa export under AGOA?
About $1.7 billion of goods in 2025, roughly 10% of its exports to the US and 1% of its global exports.
What is the US tariff on South Africa in 2026?
Most South African goods face a 12.5% Section 301 tariff since July 24, 2026. Autos and some steel and aluminum goods face 25% Section 232 tariffs.
Why did the US impose a 12.5% tariff on South Africa?
The US says South Africa does not adequately enforce a ban on imports made with forced labor. South Africa rejects the claim.
What does the US buy from South Africa in 2026?
Mainly precious stones and metals ($8.47 billion in 2024), vehicles ($2.27 billion), iron and steel, aluminum and ores.
What does the US sell to South Africa in 2026?
Machinery, mineral fuels, aircraft, optical and medical equipment, vehicles and electrical equipment, according to South Africa’s 2025 import records.
Is US–South Africa trade growing in 2026?
Mixed. US exports are up 7.8% in January through August 2026, while imports are down 36.9% because early 2025 imports were unusually high.
When will new US–South Africa trade data be released in 2026?
The Census Bureau publishes monthly trade data roughly five weeks after each month ends. Check its release schedule for the September 2026 date.
What share of US imports come from South Africa in 2026?
South African goods were about 0.44% of US imports in 2024, according to analysis of trade data. They were $16.45 billion in 2025.
How much does South Africa depend on the US market in 2026?
The US took about 13.3% of South Africa’s global exports in 2024, equal to about 2.2% of its GDP.
Disclaimer: The data research report we present here is based on information found from various sources. We are not liable for any financial loss, errors, or damages of any kind that may result from the use of the information herein. We acknowledge that though we try to report accurately, we cannot verify the absolute facts of everything that has been represented.