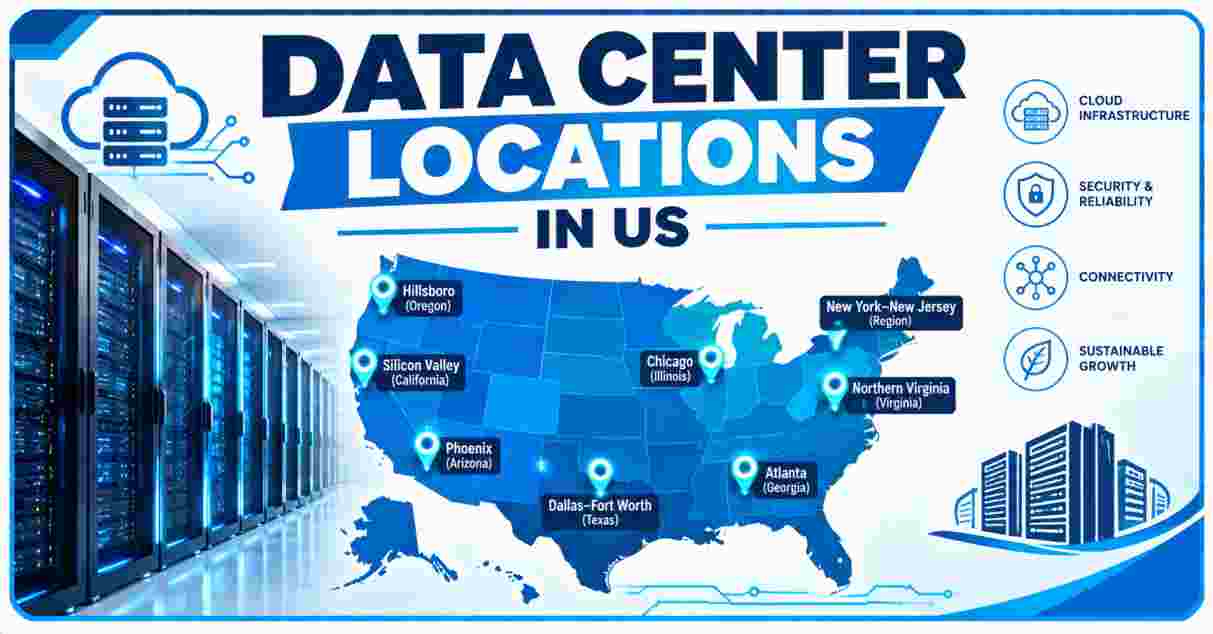
Virginia and Texas control the largest data center footprints in the United States in 2026, together hosting well over 1,000 facilities. Texas now leads the country in tracked power capacity at more than 135,000 megawatts, while Northern Virginia alone still processes an estimated 70% of global internet traffic daily.
Data Center Locations – Introduction
Data center locations across the United States have shifted dramatically over the past few years, moving well beyond the traditional Northern Virginia stronghold into a much wider map of emerging hubs across Texas, the Southeast, the Mountain West, and the Midwest. The US now hosts more data centers than any other country by a wide margin, with nearly 40% of the world’s facilities located within its borders, and 2026 has brought an unprecedented wave of new construction as AI computing demand pushes operators to chase cheap land, available power, and cooperative utilities wherever they can find them.
That search for power has begun to redraw the geography of the industry entirely. Virginia still holds the deepest, most mature cluster of operating facilities, anchored by Ashburn and the rest of Loudoun County, but Texas has surged ahead on both raw facility counts and total tracked power capacity, driven by massive announced projects that dwarf anything previously built in the sector. Understanding exactly where America’s data centers sit today, and which states and cities are positioned to capture the next wave of growth, requires looking at several overlapping but sometimes conflicting datasets tracking this fast-moving industry.
Interesting Facts
| Fact | Figure |
|---|---|
| Total US Data Centers (March 2026) | 4,011 |
| US Share of Global Data Centers | Nearly 40% |
| US Data Center Capacity (End of 2025) | Over 50 GW operating |
| Total US Data Center Pipeline (Operating + Under Construction + Planned) | Approximately 7,000 facilities |
| Total Pipeline Power Capacity | Roughly 521 GW |
| Top State by Facility Count | Virginia or Texas, depending on dataset |
| Top State by Power Capacity | Texas (135,000+ MW) |
| Share of Global Internet Traffic Through Northern Virginia | ~70% daily |
Source: CBRE, FERC State of the Markets Report (March 2026), Aterio.io US Data Center Database
These interesting facts about data center locations show an industry expanding at a pace that has outstripped even the most aggressive historical infrastructure buildouts. With roughly 7,000 facilities now somewhere in the operating, construction, or planning pipeline, representing an estimated 521 GW of power capacity, the scale of current and future US data center development dwarfs the 50 GW currently operating today.
The fact that Northern Virginia alone processes an estimated 70% of global internet traffic on any given day illustrates just how concentrated the industry’s most critical infrastructure remains, even as newer hubs in Texas, Ohio, and the Southeast rapidly close the gap in both facility counts and total capacity.
Top US States by Number of Data Centers in 2026
| Rank | State | Total Data Centers | Operating | Planned | Leading Hubs |
|---|---|---|---|---|---|
| 1 | Virginia | 685 | 398 | 287 | Ashburn, Loudoun County, Prince William |
| 2 | Texas | 466 | 296 | 170 | Dallas-Fort Worth, Austin, West Texas |
| 3 | California | 331 | 277 | 54 | Silicon Valley, Los Angeles |
| 4 | Illinois | 262 | 139 | 123 | Chicago (Elk Grove Village, Aurora) |
| 5 | Georgia | 235 | 94 | 141 | Atlanta (Douglasville, Palmetto) |
| 6 | Ohio | 223 | 166 | 57 | Columbus (New Albany), Hebron |
| 7 | Arizona | 184 | 98 | 86 | Phoenix (Mesa, Goodyear, Chandler) |
Source: Data Center Map facility counts as compiled by CBRE, reported via Pew Research
By raw facility count, Virginia remains the national leader, with 685 total data centers tracked across operating and planned status, nearly a quarter more than second-place Texas. The state’s dominance traces back to its decades-long head start as the birthplace of the modern internet exchange industry, with Ashburn and the rest of Loudoun County forming the historic core of what the industry still calls “Data Center Alley.”
Texas, with 466 total facilities, has closed much of that gap in recent years, spreading its growth across three distinct hubs: the established Dallas-Fort Worth metro, the fast-growing Austin corridor, and increasingly remote West Texas sites chosen specifically for cheap land and abundant wind and solar power. California, Illinois, and Georgia round out the next tier, each anchored by a single dominant metro hub, Silicon Valley, Chicago, and Atlanta respectively, that continues attracting new facility announcements even as land and power constraints grow tighter in each market.
Top US States by Data Center Power Capacity in 2026
| Rank | State | Tracked Power Capacity (MW) |
|---|---|---|
| 1 | Texas | 135,094 MW |
| 2 | Virginia | 59,204 MW |
| 3 | Georgia | 32,657 MW |
| 4 | Utah | 28,784 MW |
| 5 | Pennsylvania | 27,232 MW |
| 6 | Ohio | 26,873 MW |
| 7 | West Virginia | 21,770 MW |
Source: Aterio.io US Data Center Database (August 2026)
Ranking states by tracked power capacity rather than facility count produces a strikingly different picture. Texas leads by an enormous margin, with more than 135,000 megawatts of combined operating, under-construction, and announced capacity, roughly 2.3 times Virginia’s total despite Virginia having more total facilities. That gap reflects a fundamental shift in project scale: newer Texas developments increasingly represent single massive campuses in the multi-gigawatt range, rather than the dozens of smaller facilities that historically made up Virginia’s Data Center Alley.
AI Data Center Statistics in US covering the broader AI infrastructure boom help explain why capacity has become such an important measure alongside facility counts, since a single modern hyperscale AI campus can now consume as much electricity as 100,000 homes, with the largest sites under construction using 20 times that amount. West Virginia’s surprising seventh-place ranking, despite having only a handful of operating facilities, illustrates this trend clearly: a small number of massive announced projects can push a state’s tracked capacity total far higher than its current facility count would suggest.
Leading Data Center Cities and Hubs in 2026
| City/Metro Area | State | Primary Hub Type |
|---|---|---|
| Ashburn / Loudoun County | Virginia | Legacy hyperscale and colocation core |
| Dallas-Fort Worth | Texas | Established enterprise and hyperscale hub |
| Chicago (Elk Grove Village, Aurora) | Illinois | Established colocation and interconnection hub |
| Atlanta (Douglasville, Palmetto) | Georgia | Fast-growing hyperscale hub |
| Columbus (New Albany) | Ohio | Major new hyperscale campus development |
| Phoenix (Mesa, Goodyear, Chandler) | Arizona | Rapidly expanding hyperscale hub |
| Quincy | Washington | Hydropower-driven hyperscale hub |
Source: Data Center Map, CBRE North America Data Center Trends
Beyond the state-level totals, specific metro areas have emerged as the industry’s true centers of gravity. Ashburn remains the most internationally recognized data center hub in the world, a legacy of its early role hosting major internet exchange points that made it the natural home for cloud providers building out their first major East Coast presence. Dallas-Fort Worth and Chicago function as the industry’s other legacy hubs, each benefiting from central geographic positioning, established fiber connectivity, and large enterprise customer bases.
Newer hubs tell a different story about where the industry is headed next. Columbus, Ohio, and Phoenix, Arizona, have each attracted massive hyperscale campus announcements in recent years, drawn by a combination of available land, cooperative state and local governments offering tax incentives, and, critically, utilities willing to commit to the enormous power interconnection requests these projects require. Quincy, Washington, represents yet another model entirely, built around abundant, low-cost hydropower from the Columbia River rather than the fiber-connectivity advantages that drove earlier hub development elsewhere.
Northern Virginia: America’s Largest Data Center Market in 2026
| Metric | Figure |
|---|---|
| Total Inventory (End of Prior Year) | 4,039.6 MW |
| Vacancy Rate | 0.5% |
| Share of 2026 Scheduled Supply Pre-Committed | 96% |
| Net Absorption (2025) | 1,102.0 MW, led all US primary markets |
Source: CBRE North America Data Center Trends, H2 2025
Northern Virginia remains the single most important data center market in the country by nearly every traditional industry metric, even as its growth rate has begun to lag behind newer, land-abundant markets elsewhere. The region ended the prior year with 4,039.6 megawatts of total inventory and a vacancy rate of just 0.5%, among the tightest of any major commercial real estate market in the country regardless of asset type. With 96% of 2026’s scheduled new supply already pre-committed to tenants before completion, the market shows virtually no speculative development, reflecting overwhelming demand that continues to outstrip available power capacity.
Data Center Electricity Cost Statistics in US tracking the broader grid strain caused by this kind of concentrated demand help explain why Northern Virginia’s growth, while still substantial, has begun to plateau relative to newer markets: the region’s utilities face genuine physical constraints on how much additional power they can deliver without significant new transmission infrastructure, a bottleneck that has pushed much of the industry’s newest mega-scale development toward states with more available grid capacity.
Fastest-Growing Data Center States in 2026
| State | Operational | Under Construction | Announced | Total |
|---|---|---|---|---|
| Texas | 212-238 | 140-176 | 610-946 | 962-1,360 |
| Virginia | 320-347 | 136-140 | 498-560 | 954-1,047 |
| Georgia | 62-70 | 56 | 340-356 | 458-482 |
| Pennsylvania | 37-41 | 11-26 | 209-333 | 257-400 |
Source: Visual Capitalist, Aterio.io, PoweredByWho tracked project databases
Multiple independent trackers now agree on the broad trend even when their exact facility counts differ: Texas is on track to overtake Virginia as the state with the most total data centers, driven overwhelmingly by an enormous pipeline of announced projects that has not yet reached operational status. Depending on the specific database consulted, Texas’s announced project count ranges from roughly 610 to 946 facilities, several times larger than its current operating base, a gap that reflects the sheer scale of new commitments flowing into the state’s power-abundant, land-rich regions.
Georgia and Pennsylvania occupy a similar position one tier down, each showing announced project pipelines that vastly exceed their current operating footprints. Pennsylvania’s growth has been particularly notable given its more modest historical presence in the industry, with tracked capacity reaching as high as 27,232 megawatts according to some databases, driven by aggressive new campus announcements taking advantage of the state’s existing natural gas infrastructure and relatively available grid interconnection capacity compared to more saturated East Coast markets.
National Data Center Pipeline and Capacity Totals in 2026
| Metric | Figure |
|---|---|
| Total US Data Centers Tracked (Operating + Construction + Planned) | ~7,000 |
| Total Pipeline Power Capacity | ~521 GW (521,077 MW) |
| Capacity Under Construction | ~73,352 MW |
| US Data Center Capacity CAGR (2020-2025) | 24% |
| US Share of Global Hyperscale Capacity | 54% |
Source: Aterio.io, FERC State of the Markets Report (March 2026)
Taken as a whole, the national data center pipeline reveals an industry still in the earliest stages of a massive build-out. Roughly 7,000 facilities now sit somewhere between operational and merely announced status, representing a combined 521 gigawatts of tracked power capacity, more than ten times the roughly 50 gigawatts currently operating. Even the portion already under active construction, some 73,352 megawatts, exceeds the entire operating capacity of several major national electricity grids combined.
Renewable Energy Statistics in US tracking the parallel buildout of solar, wind, and other generation capacity add important context to these figures, since much of the new power capacity data centers are requesting will need to come from a combination of new renewable generation and extended natural gas infrastructure over the coming years. With data center capacity having grown at a 24% compound annual rate between 2020 and 2025, and the US already accounting for 54% of global hyperscale capacity, the geographic scramble for the next wave of sites, and the power to run them, shows no signs of slowing as 2026 continues.
Data Center Locations in US 2026 FAQ
Which US state has the most data centers?
Virginia leads by total facility count with 685 data centers, though Texas is projected to overtake it based on the much larger volume of announced projects still in the pipeline.
Which state has the most data center power capacity?
Texas leads by a wide margin with more than 135,000 megawatts of tracked operating, under-construction, and announced power capacity.
How many data centers are there in the entire United States?
The US hosted 4,011 operational data centers as of March 2026, with an additional pipeline of roughly 3,000 facilities under construction or announced.
What percentage of global internet traffic passes through Northern Virginia?
An estimated 70% of global internet traffic passes through Northern Virginia on any given day, reflecting its status as the world’s most concentrated data center hub.
What is Northern Virginia’s current data center vacancy rate?
Northern Virginia’s vacancy rate stood at just 0.5% at the end of the prior year, with 96% of 2026’s scheduled new supply already pre-committed to tenants.
Which cities are emerging as new data center hubs?
Columbus, Ohio, Phoenix, Arizona, and Quincy, Washington, have each emerged as significant new hubs, drawn by available land, cooperative utilities, and, in Quincy’s case, low-cost hydropower.
How much total data center capacity is currently in the US pipeline?
The full US pipeline, combining operating, under-construction, and announced projects, represents an estimated 521 gigawatts of power capacity.
How fast has US data center capacity grown in recent years?
US data center capacity grew at a 24% compound annual growth rate between 2020 and 2025, according to FERC’s State of the Markets Report.
What share of global data centers are located in the United States?
The United States hosts nearly 40% of all data centers worldwide, far more than any other single country.
Why is Texas attracting so many new data center projects?
Texas offers a combination of abundant land, favorable regulatory treatment, and significant wind and solar generation capacity, particularly in West Texas, making it attractive for the largest new hyperscale campus developments.
Disclaimer: The data research report we present here is based on information found from various sources. We are not liable for any financial loss, errors, or damages of any kind that may result from the use of the information herein. We acknowledge that though we try to report accurately, we cannot verify the absolute facts of everything that has been represented.