Canada EU Trade in 2026
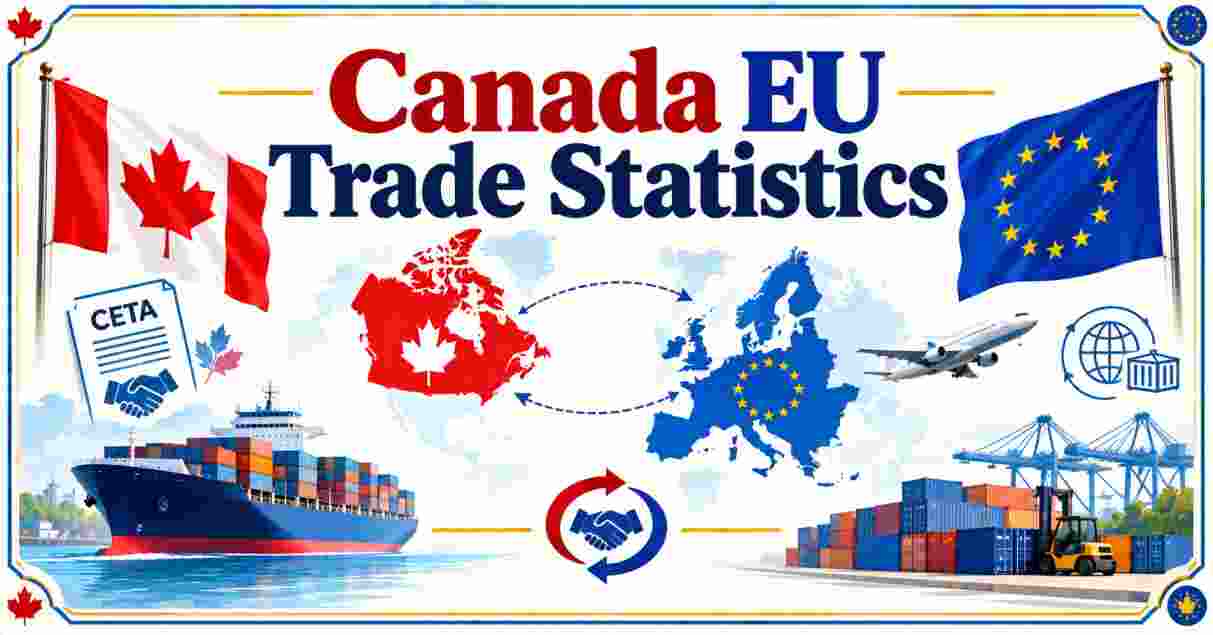
Canada EU trade reached €130.8 billion in goods and services in 2025, the most recent full-year figure confirmed by the European Council in June 2026. That total sits inside a partnership that spans a combined population of roughly 490 million people and, together, accounts for close to one-fifth of global GDP and about 19% of global trade in goods and services. The relationship runs on the Comprehensive Economic and Trade Agreement, or CETA, which has removed 98% of tariffs between the two economies since it began provisional application in September 2017, and which Ottawa is now leaning on harder than ever as its trade relationship with Washington deteriorates through 2026.
The scale of that shift matters. Canada’s goods and services trade with the EU works out to roughly 8.7% of Canada’s total trade, making the bloc Canada’s second-largest trading partner behind only the United States. From the EU’s side, Canada ranks a comparatively modest 12th among its trading partners, a reminder that this is a much bigger relationship for Ottawa than it is for Brussels. That asymmetry is exactly why Canada EU trade figures have become a live policy story in 2026: with US tariffs on Canadian goods running as high as 50% on entire product categories since August, Canada has strong incentive to deepen ties with the one major partner that still offers near-tariff-free access to a market of hundreds of millions of consumers.
Interesting Facts
| Metric | 2025/2026 Confirmed Figure |
|---|---|
| Total EU-Canada trade in goods and services | €130.8 billion (2025) |
| EU exports of goods to Canada | €48.9 billion |
| EU imports of goods from Canada | €32.9 billion |
| EU exports of services to Canada | €29.4 billion |
| EU imports of services from Canada | €19.7 billion |
| Trade growth in goods, 2016–2025 | +76% |
| Trade growth in services, 2016–2025 | +90% |
| Combined goods and services trade growth, 2016–2025 | +81.2% |
| EU FDI stock in Canada (2024) | €244.7 billion |
| Canadian FDI stock in the EU-27 (2024) | €230 billion |
| CETA tariffs eliminated | 98% |
Source: Council of the European Union, EU-Canada trade facts and figures, data extracted June 2026 from Eurostat.
The +81.2% combined trade growth figure since 2016 is the single number that best captures what CETA has actually done. That is not organic global trade growth measured against a flat baseline; it is growth specific to the EU-Canada corridor over a period when the agreement removed the overwhelming majority of tariff lines between the two economies. An ex-post evaluation commissioned as part of that tracking found the deal has added an estimated €3.2 billion to EU GDP every year, a modest but durable dividend that has compounded since 2017 without needing a single additional negotiating round.
The FDI numbers tell a parallel story of deepening entanglement beyond simple trade flows. €244.7 billion in EU investment stock sitting inside the Canadian economy, against €230 billion flowing the other way into the EU-27, means the two economies now hold nearly half a trillion euros in cross-invested capital. That is a stickier, harder-to-unwind form of economic integration than a shipment of goods, and it is one reason CETA has proven durable even as ratification by individual EU member states has dragged on for nearly a decade — as of 2026, only 17 of 27 EU states have formally ratified the agreement, though provisional application has covered nearly all of it since 2017 regardless.
Canada EU Trade Value Statistics 2026
| Trade Flow | Value (2025) | Direction |
|---|---|---|
| EU goods exports to Canada | €48.9 billion | EU → Canada |
| EU goods imports from Canada | €32.9 billion | Canada → EU |
| EU services exports to Canada | €29.4 billion | EU → Canada |
| EU services imports from Canada | €19.7 billion | Canada → EU |
| EU trade surplus in goods with Canada | €16.0 billion | In the EU’s favor |
| EU trade surplus in services with Canada | €9.7 billion | In the EU’s favor |
Source: Council of the European Union, EU-Canada trade facts and figures; Eurostat trade in goods (DS-059341) and trade in services (bop_its6_det) datasets.
The EU runs a trade surplus with Canada across both goods and services, and the size of that surplus is worth sitting with: €16.0 billion on goods and €9.7 billion on services adds up to roughly €25.7 billion in combined EU surplus for 2025. That is not a marginal imbalance. It reflects the structure of what each side sells the other — European exporters send finished machinery, pharmaceuticals, and manufactured goods into Canada, while Canadian exports to Europe lean more heavily on raw and semi-processed mineral products, a lower-value-added mix that keeps the trade balance tilted toward Brussels even as overall volumes climb.
Services trade, while smaller in absolute terms than goods, has grown faster in percentage terms — 90% since 2016 against 76% for goods — and the EU’s surplus there is proportionally even wider relative to total volume. That points to Europe’s continued strength in exporting professional, scientific, and technical services into the Canadian market, an area where Canada has struggled to build a comparable services export base aimed at Europe. For a market this size, a persistent double surplus of this scale is the kind of structural detail trade negotiators on both sides watch closely heading into any future CETA review.
What Canada and the EU Trade in 2026
| Category | Flow Direction | Role in the Relationship |
|---|---|---|
| Machinery | Both directions | Leading traded goods category overall |
| Chemicals and pharmaceutical products | Both directions | Second-largest goods category |
| Mineral products | EU imports from Canada | Canada’s leading export category to the EU |
| Transport equipment | EU exports to Canada | EU’s leading export category to Canada |
| Professional, scientific, and technical services | Both directions | Top traded services category |
| Travel | Both directions | Second-largest services category |
| Transport services | Both directions | Third-largest services category |
| Telecommunications, computer, and information services | Both directions | Fourth-largest services category |
Source: Council of the European Union, EU-Canada trade facts and figures, Eurostat, 2026.
Machinery sits at the top of the goods relationship in both directions, which reflects how integrated European and Canadian industrial supply chains have become since CETA cut the tariff friction that once separated them. Chemicals and pharmaceutical products follow closely, a category that has grown in strategic importance on both sides of the Atlantic as governments push to diversify pharmaceutical supply chains away from single-source dependency, whether on China or on any one trading partner.
The asymmetry between mineral products and transport equipment captures the underlying comparative-advantage story of this relationship in a single line. Canada’s resource base — potash, uranium, various industrial minerals — feeds directly into EU imports, while Europe’s advanced manufacturing base, particularly in vehicles and industrial transport equipment, flows the other way into Canada. On the services side, professional and technical services leading the list signals a relationship increasingly built on knowledge work and cross-border expertise rather than pure goods shipment, a pattern common among advanced-economy trading partners with mature, tariff-light agreements like CETA in place.
CETA Impact on Canada EU Trade 2026
| CETA Metric | 2026 Status |
|---|---|
| Tariffs eliminated since provisional application | 98% |
| Provisional application start date | September 21, 2017 |
| EU member states with full ratification | 17 of 27 |
| EU member states with ratification pending | 10 of 27 |
| Annual EU GDP gain attributed to CETA | €3.2 billion |
| CETA Joint Committee investor-protection clarification | March 2026 |
Source: Comprehensive Economic and Trade Agreement documentation, European Commission Directorate-General for Trade, 2026.
Nine years after provisional application began, CETA remains in an unusual legal limbo that has not stopped it from working. Because the agreement is a “mixed agreement” under EU law, full entry into force requires ratification by all 27 individual EU member states as well as the EU institutions themselves, and as of 2026 only 17 states have completed that process. France’s Senate voted against ratification in March 2024, Ireland’s Supreme Court found in 2022 that ratification would be unconstitutional under existing Irish law without legislative amendment, and Cyprus’s parliament rejected the deal outright in 2020. None of that has interrupted the roughly 98% of tariff lines that were eliminated the moment provisional application began, since that portion of the agreement falls squarely within exclusive EU competence and does not require individual state ratification to take effect.
The March 2026 clarification from the CETA Joint Committee is the most significant recent development inside the agreement’s legal architecture. Responding to years of criticism over how CETA’s investor-state dispute mechanism might affect national sovereignty, the Committee issued narrower interpretations of what counts as “fair and equitable treatment” and “indirect expropriation,” effectively tightening the standard investors must meet to bring a successful claim against either government. That move addresses one of the longest-running objections raised by CETA’s European critics without reopening the treaty text itself, and it may help unlock ratification in some of the ten states still holding out — though Ireland’s constitutional hurdle in particular is unlikely to move without a change in domestic law rather than a reinterpretation at the CETA committee level.
Canada’s Trade Diversification Toward the EU in 2026
| Export Market | Share of Canadian Exports (2025) |
|---|---|
| United States | 76.4% |
| European Union | 4.4% |
| China | 3.8% |
| United Kingdom | 3.6% |
| Japan | 1.9% |
| All other markets | 9.9% |
Source: Economy of Canada national accounts summary, 2025 trade data.
This table is the most important reality check in the entire diversification conversation. Even with CETA fully operational for nearly a decade and Canada’s relationship with Washington under real strain in 2026, the EU’s 4.4% share of total Canadian exports is dwarfed by the 76.4% still flowing to the United States. Political rhetoric about “pivoting to Europe” runs well ahead of what the trade data actually shows: Canada’s economy remains extraordinarily concentrated on its southern neighbor, and even a booming EU relationship growing at 80%-plus over a decade has not meaningfully dented that concentration in percentage terms, because US trade volumes are simply so much larger in absolute dollars.
That gap is precisely what gives the current US-Canada tariff dispute its teeth, and precisely why Ottawa has been vocal about wanting to accelerate EU ties through 2026. Total US-Canada goods and services trade ran to roughly $879.9 billion in 2025 — more than six times the entire EU-Canada relationship in nominal terms even before currency conversion is factored in. Diversifying meaningfully away from that level of dependency would take years of sustained effort even under the best conditions, which is part of why Canada’s response to the escalating tariff dispute has focused as much on domestic “Buy Canadian” procurement policy as on redirecting export volumes abroad; further detail on that domestic side of Ottawa’s strategy is available in our report on US products banned in Canada, which tracks the procurement and retail restrictions Canada has layered on top of its EU outreach.
US-Canada Tariff Dispute Context for EU Trade 2026
| Metric | 2026 Figure |
|---|---|
| New US Section 338 tariff rate on Canadian goods | 50% |
| Value of Canadian goods newly covered | ~$20 billion (~5% of Canadian exports to the US) |
| Legal basis for new US tariffs | Section 338, Tariff Act of 1930 |
| Effective date of new US tariffs | August 22, 2026 |
| Canada’s retaliatory tariff package | ~$20 billion (C$27.6 billion), 700+ product lines |
| Canada’s retaliation effective date | September 8, 2026 |
| Total US-Canada trade, 2025 | $879.9 billion |
Source: The White House; Office of the US Trade Representative; Prime Minister of Canada official statements, August-September 2026.
The timeline behind these figures explains why Canada EU trade has become such a live policy topic in 2026 rather than a slow-moving background story. High-level US-Canada trade talks collapsed on August 21, 2026, and within hours the Trump administration began enforcing new 50% tariffs on roughly $20 billion worth of Canadian dairy, alcohol, motor vehicles, and other goods under Section 338 of the Tariff Act of 1930 — a legal mechanism that applies regardless of USMCA compliance and carries no built-in expiry date. Prime Minister Mark Carney responded with a dollar-for-dollar retaliatory package covering more than 700 US product lines, which took effect September 8, 2026.
That confrontation sits directly behind the political urgency around deepening EU ties, even though the underlying trade math, as the diversification figures above show, means any meaningful rebalancing will take years rather than months. Readers following the full arc of this dispute, including the earlier September 2025 rollback of Canadian retaliatory tariffs and the collapsed CUSMA review deadline that preceded this latest escalation, can find the complete timeline in our report on Canada’s tariffs on US goods, which covers the sector-by-sector breakdown of which American industries and which Canadian provinces are most exposed to the ongoing standoff.
Canada and EU Economic Scale Comparison 2026
| Metric | EU (2026) | Canada (2026) |
|---|---|---|
| Population | 451,990,314 | 41,417,056 (Q2 2026) |
| Nominal GDP | $23.035 trillion | $2.42 trillion |
| GDP growth forecast | +1.3% | -1.4% (2025) |
| GDP per capita (nominal) | $51,027 | $60,305 |
| Unemployment rate | 5.9% (EU27, May 2026) | 6.6% (May 2026) |
Source: Eurostat; Economy of the European Union and Economy of Canada national accounts summaries, 2026.
The scale mismatch between these two economies is stark: the EU’s $23.035 trillion GDP is roughly 9.5 times the size of Canada’s $2.42 trillion economy, and the EU’s population of 452 million is more than ten times Canada’s 41.4 million. That imbalance is exactly why the trading relationship looks so different depending on which side is measuring it — a relationship worth 8.7% of Canada’s total trade barely registers as Canada’s 12th-ranked partner from the EU’s vantage point, purely because the EU has so many other large economies to trade with relative to its own size.
Canada’s higher GDP per capita, at $60,305 against the EU’s $51,027, reflects a resource-rich economy with a smaller, more concentrated population base rather than any broader measure of economic strength. The divergence in growth forecasts is also worth noting: Canada’s economy contracted 1.4% in 2025 amid the trade disruption with the US, while the EU is projected to grow 1.3% in 2026, a gap that, if it persists, gives Ottawa additional incentive to lean into whichever trading relationships are still expanding rather than contracting.
Frequently Asked Questions About Canada EU Trade 2026
How much trade happens between Canada and the EU in 2026?
The most recent confirmed figure, covering full-year 2025 and published by the European Council in June 2026, puts total EU-Canada trade in goods and services at €130.8 billion.
What is CETA and is it still in effect in 2026?
CETA is the Comprehensive Economic and Trade Agreement between Canada and the EU. It has been provisionally applied since September 21, 2017, eliminating 98% of tariffs between the two economies, and remains in effect in 2026 even though only 17 of 27 EU member states have completed full ratification.
Is the EU Canada’s largest trading partner?
No. The EU is Canada’s second-largest trading partner in goods and services, representing about 8.7% of Canada’s total trade, behind the United States, which accounts for 76.4% of Canadian exports alone.
What does Canada export most to the EU?
Canada’s leading export category to the EU is mineral products, alongside significant machinery and chemical and pharmaceutical product exports, both of which trade heavily in both directions.
What does the EU export most to Canada?
Transport equipment is the EU’s leading goods export category to Canada, alongside machinery and chemical and pharmaceutical products.
Has EU-Canada trade grown since CETA took effect?
Yes. Between 2016 and 2025, goods trade between the EU and Canada grew by more than 76%, services trade grew by around 90%, and combined goods and services trade grew by 81.2%.
Is Canada trying to shift trade away from the US toward the EU in 2026?
Ottawa has publicly emphasized deepening EU ties amid its escalating tariff dispute with Washington, but the trade data shows the EU still accounts for only 4.4% of Canadian exports against 76.4% for the United States, meaning any meaningful shift will take years.
How much foreign investment flows between Canada and the EU?
As of 2024, EU foreign direct investment stock in Canada stood at €244.7 billion, while Canadian FDI stock in the EU-27 stood at €230 billion.
Does the EU or Canada run a trade surplus with the other?
The EU runs a trade surplus with Canada in both goods (€16.0 billion) and services (€9.7 billion) as of 2025.
Why has EU-Canada trade become a bigger story in 2026?
The US imposed new 50% tariffs on roughly $20 billion of Canadian goods on August 22, 2026, under Section 338 of the Tariff Act of 1930, prompting Canada to retaliate and increasing political attention on alternative trading partners like the EU.
How many EU countries have ratified CETA as of 2026?
17 of 27 EU member states have fully ratified CETA as of 2026. The remaining 10, including France and Ireland, have not completed ratification, though the agreement’s tariff provisions remain in force regardless under provisional application.
Disclaimer: The data research report we present here is based on information found from various sources. We are not liable for any financial loss, errors, or damages of any kind that may result from the use of the information herein. We acknowledge that though we try to report accurately, we cannot verify the absolute facts of everything that has been represented.