Social Media Health Trends in America 2026
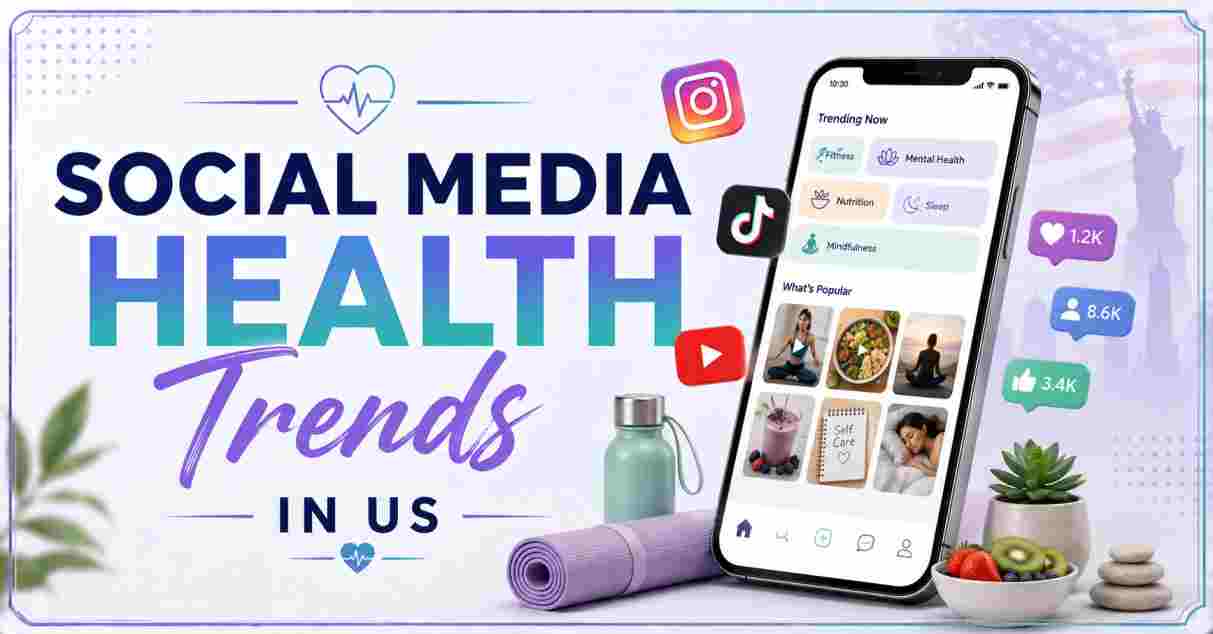
Social media health trends in the US have moved from a niche corner of the internet into the dominant force shaping how Americans discover, discuss, and act on wellness information in 2026. From fibermaxxing and sleepmaxxing to viral GLP-1 weight-loss content and a booming menopause conversation on “Meno TikTok,” platforms like TikTok, Instagram, and YouTube have become the primary health information source for millions of Americans — often ahead of, or in place of, doctors and traditional medical institutions. According to Pew Research Center, 36% of US adults say they get health information from social media at least sometimes, while a separate Health Information National Trends Survey found that 84.8% of adults have shared personal or general health information on these platforms.
This report compiles the latest verified statistics on social media health trends in the US for 2026, covering usage patterns, influencer economics, viral fitness and supplement crazes, weight-loss and hormone-health discourse, mental health content, sleep and gut-health “maxxing” trends, wearable technology adoption, and the scale of health misinformation now circulating across these platforms. Every figure is drawn from Pew Research Center, the CDC’s Health Information National Trends Survey, Nutrition Business Journal, Sprout Social, Rock Health, and peer-reviewed research, giving marketers, clinicians, and everyday users a clear, current picture of how deeply social media now shapes American health behavior.
Interesting Facts About Social Media Health Trends in 2026
| Fact | Data Point |
|---|---|
| Americans who get health info from social media at least sometimes | 36% (Pew Research, Oct. 2025) |
| Adults who have shared health information on social media | 84.8% |
| US dietary supplement sales in 2025 | $72.88 billion, up 5.5% |
| Supplement sales through TikTok Shop (year ending Jan. 2026) | 3% of all sales, up 71% year-over-year |
| TikTok posts under the #Ozempic hashtag | Over 273 million views |
| Menopause hashtag views on TikTok | More than 1 billion views |
| TikTok videos on ADHD containing inaccurate claims | More than half |
| Americans who own at least one wearable device | 57% |
| Fitness content views on TikTok in 2026 (year-to-date) | Over 980 billion views |
| US adults who say they trust most health info they see on social media | Fewer than 1 in 10 |
Source: Pew Research Center, Nutrition Business Journal, pharmaphorum, CBC News, StudyFinds/Journal of Social Media Research, Rock Health.
Taken together, these figures reveal an ecosystem defined by a striking paradox: Americans are consuming health content from social media at massive scale while simultaneously expressing deep skepticism about its accuracy. Fewer than 1 in 10 social media users say they trust most of the health information and advice they encounter on any platform, yet 84.8% of adults actively share such content themselves, and 72% of adults report seeing weight-loss, diet, or nutrition content on social media in just the past month — exposure that occurs even among people who say they never actively seek out health information there.
This gap between skepticism and consumption has real commercial consequences. TikTok Shop’s supplement sales channel grew 71% year-over-year through January 2026, and vitamins and supplements now represent 13% of all TikTok Shop sales, making them the platform’s single top-selling product category — ahead of skincare, cosmetics, and hair care combined. With fitness content alone generating nearly a trillion views on TikTok in 2026 year-to-date, and branded fitness partnerships delivering an average 6.3x return on investment, the platform economics increasingly reward whichever health narrative — evidence-based or not — proves most shareable.
Social Media Health Information Usage Statistics 2026
| Metric | Figure |
|---|---|
| Adults who get health info from social media “at least sometimes” | 36% |
| Adults who have ever gotten health info from social media | 61% |
| Adults who have shared personal/general health content | 84.8% |
| Adults who saw weight-loss/diet content in the past month | 72% |
| Adults who saw mental health-related content in the past month | 58% |
| Gen Z who reject doctors’ guidance in favor of social media info | 38% (Edelman, 2025) |
| Users who trust most health information they see | Under 10% |
Source: Pew Research Center, Health Information National Trends Survey (HINTS), Medical Economics, Edelman Trust Barometer.
Social media health information usage statistics show consumption patterns that vary sharply by demographic group. Pew Research Center’s October 2025 survey found that Hispanic (49%), Asian (47%), and Black adults (45%) are considerably more likely to get health information from social media at least sometimes than White adults (30%) — a gap researchers attribute partly to differing levels of trust in, and access to, traditional healthcare institutions. The same survey found that among the majority of adults who do encounter health content on these platforms, White adults were more likely (51%) than Black adults (34%) to describe that information as “not too” or “not at all” accurate, suggesting the skepticism itself is unevenly distributed.
The scale of passive exposure is arguably more consequential than active searching: even people who say they never deliberately seek health information on social media report being exposed to it regularly, with 72% of all adults encountering weight-loss or nutrition content and 58% encountering mental health content in just the past month. A separate HINTS survey of 7,278 respondents, representative of 262 million US adults, found that a striking 84.8% had shared health-related content themselves — evidence that the flow of health information on these platforms is now bidirectional and largely peer-driven, operating through what researchers describe as “algorithmically curated, engagement-driven environments increasingly shaped by artificial intelligence-generated content often lacking editorial oversight.”
Health and Wellness Influencer Statistics 2026
| Metric | Figure |
|---|---|
| Instagram engagement rate for fitness/sports content | 2.31%, among the highest content categories |
| TikTok engagement rate for wellness content | 4.2%, vs. 0.95% on Instagram |
| Gym members who follow at least one fitness influencer | 63% |
| TikTok fitness content views in 2026 (YTD) | Over 980 billion |
| Average influencer ROI for branded fitness partnerships on TikTok | 6.3x |
| Fitness influencer posts citing scientific references | Only 2.7% |
| Micro-influencer (10K-100K) fitness brand deal rate | $500-$3,000/post |
| Macro-influencer (500K+) fitness brand deal rate | $15,000-$50,000+/post |
Source: Sprout Social Influencer Marketing Benchmark Report, Web Tonic, Fitness Avenue, Rupa, Amra & Elma.
Health and wellness influencer statistics confirm that fitness and wellness content generates some of the strongest engagement of any social media category, even as the quality of that content raises persistent concerns. TikTok delivers a 4.2% engagement rate for wellness content, more than four times Instagram’s 0.95%, driven largely by the platform’s algorithmic preference for authentic, unpolished workout footage over produced advertising — content that performs 29% better when it looks genuinely amateur rather than professionally staged. That authenticity premium has reshaped how brands allocate influencer budgets: micro-influencers with 10,000 to 100,000 followers now command 2 to 4 times higher engagement rates than mega-influencers, and fitness creators with as few as 3,000 highly engaged followers can earn $2,000 to $5,000 monthly through coaching and digital products alone, without any brand sponsorship.
The scale of this economy sits uneasily alongside its evidence base. A market analysis of Canadian fitness influencers — a pattern mirrored across the US market — found that only 2.7% of fitness influencer posts cite any scientific references, despite supplement and wellness brands being among the highest-spending advertisers in the influencer marketing space. With 63% of gym members reporting they follow at least one fitness influencer, and branded partnerships generating an industry-leading 6.3x return on investment, the financial incentives to produce viral fitness content have clearly outpaced the incentives to ensure that content is medically accurate.
Viral Fitness Trend Statistics 2026
Google Search Interest Growth for Viral Fitness Trends
Japanese walking (interval walking)   |████████████████████████████████████████ +2,968%
Hyrox                                  |████████ +233%
Remote personal training               |█████ +414% (2024 baseline)
| Trend | Statistic |
|---|---|
| “Japanese walking” Google search increase (past year) | +2,968% |
| Hyrox Google search growth year-over-year | +233% |
| #HYROX hashtag views on TikTok | Over 55 million |
| #hyrox posts on TikTok | Over 316,000 |
| Estimated Hyrox competitors globally in 2025 | ~650,000 across 83 events |
| 75 Hard Challenge structure | 75 days, 2×45-min workouts daily, zero rest days |
| Participants reporting increased motivation from group fitness content | 70% |
| “Wall Pilates” search interest decline (lack of scalability) | -55% |
Source: The Globe and Mail, Gymfluencers Agency, The Conversation, Accio TikTok trend analysis.
Viral fitness trend statistics for 2026 show a clear shift away from single-modality workouts toward hybrid, competition-based formats. Hyrox — an indoor race combining running with functional strength stations like sled pushes and wall balls — has seen Google search interest climb 233% year-over-year, with the #HYROX hashtag surpassing 55 million views on TikTok and roughly 650,000 competitors expected to participate across 83 global events in the 2025 season alone. Meanwhile, “Japanese walking,” a simple interval-walking technique alternating three minutes of brisk pace with three minutes of gentle walking, saw the single largest search spike of any 2026 fitness trend at nearly 3,000% growth, reflecting a broader pivot toward low-barrier, science-adjacent trends that require no equipment or gym membership.
Not every viral trend holds up under scrutiny, however. The 75 Hard Challenge — requiring two 45-minute workouts daily, a strict diet, a gallon of water, and progress photos for 75 consecutive days with zero rest days — remains one of the most widely shared fitness trends on TikTok despite sports science research flagging its no-recovery structure as fundamentally counterproductive, since physiological adaptation to exercise occurs during rest, not during training itself. Other short-lived 2025 trends like “Wall Pilates” saw search interest drop 55% once users discovered its lack of scalability, illustrating how quickly TikTok’s fitness trend cycle now turns over compared to the multi-year lifespan of trends in the pre-social-media era.
Supplement Trends on Social Media Statistics 2026
| Supplement | 2026 Social Media Status |
|---|---|
| Magnesium | Most-discussed individual supplement on TikTok, driven by sleep/cortisol angle |
| Creatine | 2nd most discussed; crossed from bodybuilding into mainstream wellness/cognitive health |
| Berberine | 3rd most discussed; dubbed “nature’s Ozempic” in viral content |
| US supplement industry total sales (2025) | $72.88 billion, +5.5% |
| Sports nutrition category growth (2025) | +8%, fastest-growing major category |
| TikTok Shop supplement sales growth (YoY, through Jan. 2026) | +71% |
| Vitamins/supplements share of all TikTok Shop sales | 13% — the platform’s top-selling category |
| Global creatine supplement market (2024→2030 projection) | $1.11B → $4.21B, ~25.2% CAGR |
Source: Nutraceuticals World, Advanced Supplements, Vitaquest, NutraSeller, Glanbia Nutrition.
Supplement trend statistics on social media reveal magnesium’s unlikely rise to the top of TikTok’s wellness conversation, driven almost entirely by its association with sleep and stress rather than its traditional bone-health positioning. Creators linking magnesium glycinate to deeper sleep and reduced nighttime anxiety generated hundreds of millions of views, pushing “magnesium for sleep” search volume up 22% year-over-year to roughly 110,000 monthly US searches. Creatine has undergone a similarly dramatic repositioning: once associated almost exclusively with bodybuilding, it now draws interest from women, older adults, and cognitive-wellness audiences, with Google Trends showing 4x increased interest since 2023 and related keywords generating 6.2 million monthly searches.
The commercial impact of this social-first supplement discovery model is now measurable at the industry level. TikTok Shop became the fastest-growing sales channel for supplements in the year ending January 2026, with sales through the platform growing 71% even as overall industry growth held at a comparatively modest 5.5%. Industry analyst Jack O’Leary of NielsenIQ singled out this shift as one warranting close attention, noting that vitamins and supplements are now TikTok Shop’s single top-selling product category at 13% of all sales — ahead of hair care, cosmetics, and facial/skin care. Three structural factors are driving this acceleration: TikTok’s algorithm rewarding educational content regardless of follower count, Google’s AI Overview surfacing ingredient-level information directly in search results, and Reddit functioning as a “trust validation layer” buyers consult before purchasing.
For readers researching how these consumption patterns fit into Americans’ broader digital habits, our US Social Media Statistics report breaks down platform usage, daily time spent, and demographic adoption across the major networks driving this wellness content economy.
Weight-Loss Trend Statistics on Social Media 2026
GLP-1 and Weight-Loss Content Reach on Social Media
#Ozempic hashtag views on TikTok         |███████████████████████████████ 273M+
#Ozempic TikTok video views (2023 study) |███████ ~70M
Americans currently using a GLP-1 drug   |█████ 12%
| Metric | Figure |
|---|---|
| #Ozempic hashtag views on TikTok | Over 273 million |
| Americans currently taking a GLP-1 drug | ~12% |
| Average weight loss reported with semaglutide | 12% to 15% of body weight |
| Content produced by individual users/influencers (GLP-1 study) | 98% of top 400 analyzed videos |
| Information quality score: influencer content vs. healthcare professionals | 34.53 vs. 52.31 (DISCERN scale) |
| Healthcare providers reporting patient-reported GLP-1 side effects | 75% |
| Most common reported side effects | Nausea (55%), diarrhea (12%), stomach pain (9%) |
Source: pharmaphorum, SingleCare, ScienceDirect (TikTokfluence study), eMarketer, Sermo survey.
Weight-loss trend statistics on social media center overwhelmingly on GLP-1 medications, which have transformed from a specialized diabetes treatment into what one industry analysis called a full-blown “lifestyle trend.” The #Ozempic hashtag has amassed more than 273 million views on TikTok alone, spawning everything from testimonial-style “before and after” content to viral parodies like the “Ozempic face” trend, where users joke about the gaunt appearance sometimes associated with rapid weight loss. A rigorous content-quality study analyzing the top 400 videos across the #Ozempic, #Semaglutide, #Mounjaro, and #Tirzepatide hashtags found that 98% were produced by individual users or influencers rather than healthcare professionals, and that this influencer-driven content scored significantly lower on a standardized reliability scale — 34.53 versus 52.31 — than content from medical professionals, with no meaningful correlation found between a video’s view count and its actual information quality.
A newer and more concerning variant of this trend emerged in 2026: GLP-1 microdosing, popularized partly through high-profile podcast appearances and endorsed even by influential figures like neuroscientist Andrew Huberman, who has 1.4 million followers. The practice — typically using compounded, non-name-brand GLP-1 formulations in vials rather than standardized injectable pens — is promoted as a way to offset muscle loss and avoid “Ozempic face,” despite 75% of healthcare providers who prescribe these medications reporting that patients experience side effects including nausea (55%), diarrhea (12%), and stomach pain (9%) even at standard, medically supervised doses. Separately, a wave of over-the-counter “GLP-1 mimicking” supplements — patches, vitamins, and powders sold heavily through TikTok Shop — has emerged claiming similar effects despite containing only vitamin blends and herbal ingredients with no demonstrated pharmacological equivalence to actual GLP-1 medications.
Menopause and Hormone Health Discussion Statistics 2026
| Metric | Figure |
|---|---|
| Menopause hashtag views on TikTok | Over 1 billion |
| Women turning to TikTok/Instagram to guide health decisions | 46% |
| Global women currently in a natural hormonal cycle or menopause stage | 2 in 3 |
| FDA action on HRT black-box warning | Removed in 2025, after 22 years |
| Potential Alzheimer’s risk reduction from early HRT (within 5 years of menopause) | Up to 30% |
| Popular viral menopause-related product trend | “Pepcid + Claritin” combination trend |
Source: CBC News, Coral, thehealthverge, Innova Market Insights, Tastewise.
Menopause and hormone health content statistics reflect one of the most significant shifts in women’s health discourse of the past several years, with “Meno TikTok” emerging as a genuine grassroots movement that has pushed the topic into mainstream visibility largely because, as multiple women interviewed by CBC News described it, traditional medical sources — including their own doctors — were failing to provide adequate information or treatment options. The menopause hashtag has surpassed 1 billion views on TikTok, and creators have documented real-world impact: women reporting that content discussing hormone replacement therapy (HRT) prompted them to return to their doctors and specifically request prescriptions they hadn’t previously known to ask for.
This social-media-driven advocacy arrived alongside genuine clinical developments that lent it new credibility. In 2025, the FDA removed its 22-year-old black-box warning on hormone replacement therapy, a landmark regulatory shift that made evidence-based HRT care more accessible just as public interest was already surging, and subsequent research has found that starting HRT within five years of menopause onset may reduce Alzheimer’s risk by up to 30%. With 46% of women now saying they turn to platforms like TikTok and Instagram specifically to guide health decisions — and with roughly two in three women worldwide currently navigating some stage of their natural hormonal cycle or menopause — this convergence of viral advocacy and shifting clinical guidance has made hormone health one of the fastest-growing categories in the broader women’s health content ecosystem for 2026.
Mental Health Content Trend Statistics 2026
TikTok Mental Health Content Accuracy by Topic
ADHD content containing inaccurate claims     |█████████████████████ >50%
Autism content containing inaccurate claims   |███████████████ 40-41%
#ADHD hashtag total views on TikTok           |███████████████████████████████████ 6.3 billion
| Metric | Figure |
|---|---|
| #ADHD hashtag views on TikTok | 6.3 billion |
| ADHD-related TikTok videos containing inaccurate/unsupported claims | More than half |
| Autism-related TikTok content rated inaccurate | 40% to 41% |
| Adults who suspect they have ADHD (vs. actual estimated prevalence) | 25% suspect vs. ~6% estimated prevalence |
| Platform with highest mental-health misinformation rate (of those studied) | TikTok |
| Studies reviewed in systematic misinformation analysis | 27 studies |
Source: StudyFinds/Journal of Social Media Research, Harvard Petrie-Flom Center, Simply Psychology, ResearchGate.
Mental health content trend statistics point to a platform ecosystem where relatability consistently outperforms clinical accuracy. A systematic review of 27 studies, conducted by researchers at the University of East Anglia’s Norwich Medical School and published in the Journal of Social Media Research, found that more than half of all TikTok videos about ADHD contained inaccurate or unsupported claims, while autism-related content was wrong 40% to 41% of the time — with both conditions showing consistently higher misinformation rates than content covering other mental health topics, a pattern researchers attribute to these topics attracting more personal storytelling and anecdote relative to clinical input. The #ADHD hashtag alone has accumulated 6.3 billion views on TikTok, reflecting a scale of exposure that dwarfs virtually any clinical education campaign.
Psychologists studying this phenomenon describe the appeal of self-diagnosis content through the lens of the “Barnum effect” — the tendency for people to see themselves reflected in descriptions of universal human experiences like distraction, mood swings, or social awkwardness, which viral videos increasingly frame as diagnostic signals rather than everyday variation. This dynamic has measurable downstream consequences: while roughly 25% of US adults now suspect they may have ADHD, actual clinically estimated prevalence sits closer to 6%, and researchers warn of a “credibility tax” in which clinicians grow warier, employers more skeptical, and the public more dismissive — with the cost of that skepticism landing hardest on people who have the genuine, clinically diagnosed condition. For a fuller picture of how these online mental health dynamics intersect with broader national trends, our Mental Health Statistics in the U.S report details prevalence, treatment access, and demographic patterns across the country.
Sleep Optimization Trend Statistics 2026
| Metric | Figure |
|---|---|
| “Sleepmaxxing” posts on TikTok (as of early 2026) | Over 100 million |
| “Magnesium for sleep” monthly US Google searches | ~110,000, +22% YoY |
| “Mouth taping” monthly US Google searches | ~60,500 |
| Studies showing real benefit from mouth taping (out of 10 reviewed) | Only 2 of 10 |
| US adults reporting a “sleep divorce” (sleeping separately from partner) | 31% |
| Oura Ring IPO filing valuation | $11 billion |
Source: Fawcett Mattress sleepmaxxing report, National Geographic, Healthline, Impressive Magazine sleep trends 2026.
Sleep optimization trend statistics show “sleepmaxxing” evolving from a niche hashtag into one of the most commercially significant wellness trends of the past two years, with TikTok hosting an estimated over 100 million posts on the topic by early 2026, according to news coverage tracking the hashtag’s growth from roughly 98.6 million posts in late 2024. The trend encompasses everything from melatonin mocktails and magnesium-laced “sleepy girl” drinks to more contested interventions like mouth taping and nostril expanders — techniques search data shows continue to draw tens of thousands of monthly US searches despite thin supporting evidence. A peer-reviewed review of 10 studies covering 213 patients found that only 2 showed a genuine reduction in sleep apnea severity from mouth taping, and reviewers explicitly flagged a “potentially serious risk of harm” for anyone attempting the technique without medical guidance, including documented cases of aspiration pneumonia.
The commercial and cultural momentum behind sleep optimization has nonetheless been substantial: smart ring maker Oura filed for an IPO at an $11 billion valuation, while the trend has driven measurable behavioral shifts, including 31% of US adults now reporting a “sleep divorce” — choosing to sleep separately from a partner to protect sleep quality. By mid-2026, however, a documented backlash had begun: Harvard Health published analysis questioning whether sleepmaxxing actually improves outcomes, and the Global Wellness Institute flagged a shift “from sleepmaxxing to simplicity” as an emerging 2026 counter-narrative, warning that the underlying anxiety around optimizing sleep — a phenomenon sleep researchers term orthosomnia — can itself become the very thing that makes falling asleep harder.
Gut Health Trend Statistics 2026
Fibermaxxing Trend Growth Timeline
First verifiable videos (mid-2024)      |████ Early stage
Trend reached critical mass (late 2025) |████████████████████ Rapid growth
Peak engagement (Q1 2026)               |████████████████████████████████████ Peak
| Metric | Figure |
|---|---|
| Americans with a fiber deficiency | 95% |
| Gen Z interested in high-fiber food/beverage products | 60% |
| “Fibermaxxing” daily fiber target promoted by creators | 40-50 grams |
| Trend origin | Mid-2024, reached critical mass late 2025 |
| Broader “maxxing” trend family | Looksmaxxing, gymmaxxing, sleepmaxxing, fibermaxxing |
Source: Fox News, Forum Health, TrendWatch, Marie Claire.
Gut health trend statistics highlight fibermaxxing as arguably the rare viral nutrition trend that has earned genuine praise from registered dietitians and gastroenterologists rather than the usual expert pushback. Gastroenterologist Dr. Will Bulsiewicz, discussing the trend on Fox News, noted that 95% of Americans suffer from a fiber deficiency, framing the trend’s core message — deliberately maximizing daily fiber intake to somewhere in the 40 to 50 gram range, roughly double or triple typical American consumption — as one of the few viral health crazes actually well-aligned with decades of nutritional epidemiology research, including Lancet-published meta-analyses on fiber’s role in digestive and metabolic health.
The trend’s viral mechanics mirror the broader “maxxing” ecosystem that also produced sleepmaxxing and gymmaxxing: it emerged from the same aggressive-optimization framing first popularized by looksmaxxing content, with the first verifiable fibermaxxing videos appearing in mid-2024 before reaching critical mass in late 2025 and peak engagement in the first quarter of 2026. Analysts attribute fibermaxxing’s unusually strong staying power to its measurability — unlike more qualitative wellness trends, creators can post exact daily fiber totals, recipes engineered to hit specific gram targets, and visual before-and-after gut-health content, a format perfectly suited to TikTok’s preference for quantifiable, trackable progress. With 60% of Gen Z consumers telling researchers at food-industry analytics firm Datassential that they’re specifically interested in high-fiber products, the trend has already begun reshaping food and beverage industry product development well beyond the platforms where it originated.
Women’s Health Trend Statistics 2026
| Metric | Figure |
|---|---|
| Women who turn to TikTok/Instagram to guide health decisions | 46% |
| Women who most associate wellness with specific “power foods” | 29% |
| Global women currently in a hormonal cycle stage or menopause | 2 in 3 |
| Top platforms influencing women’s health product choices | Instagram, TikTok, podcasts |
| Consumer preference shift | Toward intuitive eating over restrictive diet labels |
Source: Tastewise Women’s Health Trends 2026, Coral, thehealthverge.
Women’s health trend statistics for 2026 point to a broader reframing of the category, moving away from reactive, symptom-focused care toward what one industry report calls “proactive, personalized care” treating hormones as a foundational driver of long-term health rather than an occasional inconvenience to manage. Discovery of women’s health products and information is now overwhelmingly social-media-driven: 46% of women report turning to platforms like TikTok and Instagram to guide their health decisions, while a notable 29% associate wellness most strongly with specific functional foods — berries and leafy greens topping the list — reflecting a broader consumer shift toward foods framed around what they provide rather than what they restrict.
This shift extends across life stages, with pregnancy, postpartum, and menopause identified as the fastest-growing need states within the women’s health product category, each now supported by increasingly stage-specific social content and product marketing. Consumer research firm Tastewise found that women are gravitating toward high-protein, low-carb, anti-inflammatory, and plant-based dietary patterns, but with a notably intuitive rather than restrictive framing — a departure from the more rigid diet-culture messaging that dominated wellness content in previous years, and one that industry analysts say rewards brands emphasizing benefit-forward, functional positioning over generic weight-loss or elimination-based claims.
Longevity and Anti-Aging Trend Statistics 2026
| Metric | Figure |
|---|---|
| Bryan Johnson’s cumulative spending on his “Blueprint” protocol (since Oct. 2021) | Over $9 million |
| Bryan Johnson’s approximate annual spending | ~$2 million/year |
| Bryan Johnson’s daily supplement count | 100+ supplements |
| “Zone 2 cardio” positioning in longevity content | Championed by figures like Peter Attia, Andrew Huberman |
| Devices used simultaneously for biomarker tracking (Johnson’s stack) | WHOOP + Oura + custom app, 100+ biomarkers |
| 2026 global longevity spending trend | Positioned to surpass multi-trillion-dollar levels |
Source: TikTok discovery data, ToolFinder, FitnessAI, Fortune longevity coverage.
Longevity and anti-aging trend statistics are dominated by a handful of ultra-visible figures whose personal biohacking protocols have become de facto content templates for a much wider audience. Tech entrepreneur Bryan Johnson, who sold Braintree to PayPal for $800 million in 2013, has spent more than $9 million since launching his “Project Blueprint” anti-aging protocol in October 2021, publicly documenting a regimen that includes over 100 daily supplements, dozens of monthly medical procedures, continuous biometric monitoring via simultaneous WHOOP and Oura wearables tracking more than 100 biomarkers, and a strict 6:00 p.m. final meal — a level of radical, publicly broadcast transparency that has made his content simultaneously a source of genuine longevity-science education and a recurring subject of skepticism about diminishing returns on extreme optimization.
Beyond individual biohacker celebrity, 2026’s longevity content has increasingly centered on more broadly applicable, evidence-supported practices, particularly Zone 2 cardio — low-intensity, steady-state exercise performed at roughly 60-70% of maximum heart rate — championed by researchers and podcasters like Peter Attia and Andrew Huberman for its documented effects on mitochondrial function and metabolic flexibility. This shift toward more accessible longevity practices reflects a broader industry pattern: with recovery-focused content — cold plunges, red light therapy, guided breathwork — increasingly framed as “everyday nervous-system hygiene” rather than elite-athlete-only interventions, longevity content has moved from a fringe, ultra-wealthy pursuit toward mainstream wellness positioning, even as the most viral individual case studies remain firmly out of reach for the average follower’s budget.
Wearable Health Tracking Trend Statistics 2026
| Metric | Figure |
|---|---|
| US adults who own at least one wearable device | 57% |
| Rise in wearable ownership over the past decade | +33 percentage points |
| Global smart wearable market size (2026) | $118.89 billion, up from $99.36B in 2025 |
| Oura Rings sold worldwide (cumulative) | Over 5.5 million |
| Oura’s projected 2026 revenue | Nearly $2 billion |
| WHOOP valuation (2026 funding round) | Over $10 billion |
| Smartwatch users who wear their device daily | 43% |
| First-time wearable buyers citing health monitoring as primary driver | 61% |
Source: MDDI Online, Fierce Healthcare/Rock Health, Mordor Intelligence, Companies History wearable trends report.
Wearable health tracking statistics confirm that devices once considered niche fitness-enthusiast tools have crossed decisively into the mainstream, with 57% of US adults now owning at least one wearable — a 33-percentage-point increase over the past decade, according to Rock Health’s Consumer Adoption of Digital Health Survey. The category’s two fastest-growing players illustrate the scale of this shift: Oura, having sold over 5.5 million rings worldwide and quadrupled its revenue over the past two fiscal years, is projected to generate nearly $2 billion in 2026 sales and has filed for an IPO, while competitor WHOOP secured a $575 million Series G funding round valuing the company at over $10 billion, despite a well-publicized 2025 FDA warning that doesn’t appear to have slowed its growth trajectory.
This adoption surge is directly intertwined with the social-media-driven health trends covered throughout this report: 61% of first-time wearable buyers in 2025 cited health monitoring — rather than fitness tracking alone — as their primary purchase driver, reflecting the same shift toward continuous biomarker awareness visible in longevity and sleepmaxxing content. The global smart wearable market reflects this momentum, growing from $99.36 billion in 2025 to a projected $118.89 billion in 2026, with smart rings specifically identified as the fastest-growing wearable subcategory by percentage growth. Notably, 76% of smart ring users report wearing their device primarily to track sleep — directly connecting wearable adoption to the sleepmaxxing trend discussed earlier — while 55% say they’re willing to pay for premium subscription-based health insights, evidence that the hardware purchase itself is increasingly just the entry point into a recurring-revenue wellness data ecosystem.
Health Misinformation Statistics on Social Media 2026
| Metric | Figure |
|---|---|
| TikTok users who trust most health info they encounter | Fewer than 1 in 10 |
| GLP-1 content produced by non-professionals | 98% of top 400 analyzed videos |
| Information quality score: influencer vs. healthcare professional content | 34.53 vs. 52.31 |
| ADHD TikTok content rated inaccurate | More than 50% |
| Autism TikTok content rated inaccurate | 40-41% |
| Gen Z who reject doctor guidance in favor of social media info | 38% |
| #healthtips posts on TikTok | ~1.5 million |
| Platform with highest documented misinformation rate (mental health content) | TikTok (vs. other platforms studied) |
Source: Medical Economics, ScienceDirect (TikTokfluence study), StudyFinds/Journal of Social Media Research, Edelman Trust Barometer, CBS19 News.
Health misinformation statistics on social media reveal a consistent pattern across virtually every health topic examined in this report: content quality and content popularity are largely uncorrelated, and in some cases, appear to move in opposite directions. The rigorous GLP-1 content study cited earlier found “no significant correlation between engagement metrics — views and likes — and information quality,” meaning the most-watched videos about weight-loss medications were no more likely to be accurate than the least-watched ones. This finding echoes across the mental health misinformation research discussed earlier, where TikTok registered the highest misinformation rate of any platform studied across a systematic review of 27 academic papers, and it aligns with physician Dr. Bakhtiar’s on-the-record observation that “I’ve had patients delay seeking help because of something they read online, and others try unproven remedies that did nothing or made things worse.”
The generational dimension of this trend is particularly stark: a 2025 global survey by communications firm Edelman found that 38% of Gen Z respondents said they reject their doctor’s guidance in favor of information they found on social media — a figure that helps explain why researchers increasingly describe platforms like TikTok as operating through “algorithmically curated, engagement-driven environments… often lacking editorial oversight.” With roughly 1.5 million posts carrying the #healthtips hashtag on TikTok alone, and content spanning everything from evidence-supported fiber and Zone 2 cardio advice to unsupported mouth-taping and GLP-1-mimicking supplement claims, the sheer undifferentiated volume of health content now circulating makes the platform-level trust gap — where fewer than 1 in 10 users say they trust most of what they see — one of the defining tensions shaping American health behavior heading into the rest of 2026. Readers wanting fuller context on how these dynamics intersect with broader national weight and obesity trends can consult our US Obesity Statistics report for state-by-state prevalence data and demographic breakdowns.
Disclaimer: The data research report we present here is based on information found from various sources. We are not liable for any financial loss, errors, or damages of any kind that may result from the use of the information herein. We acknowledge that though we try to report accurately, we cannot verify the absolute facts of everything that has been represented.