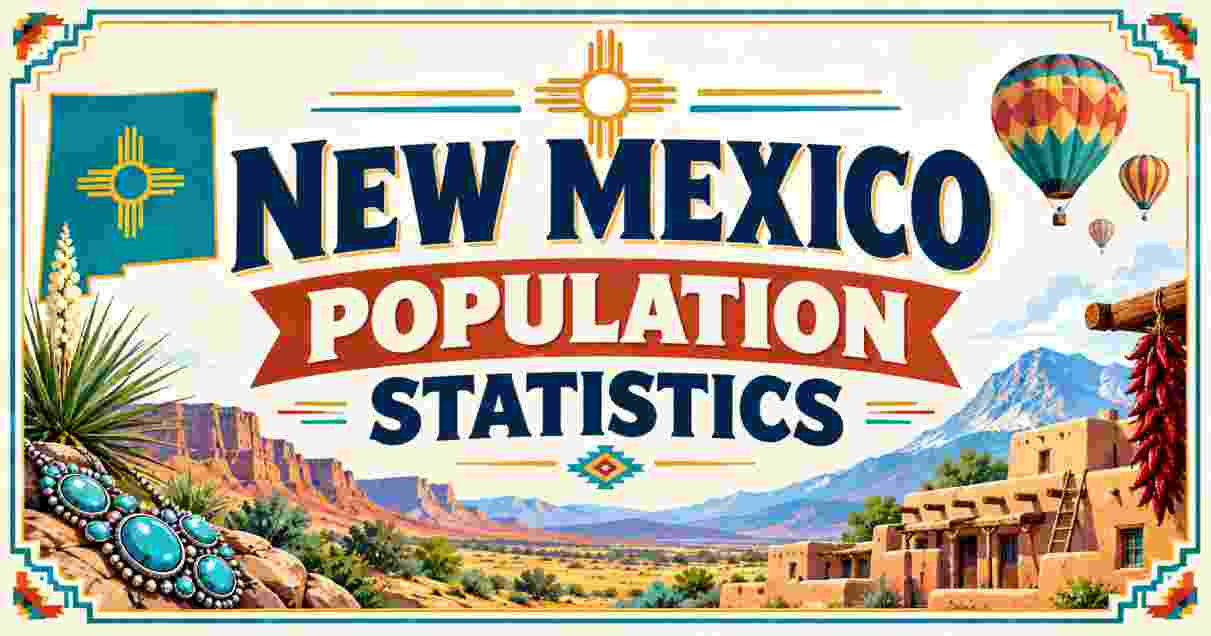
New Mexico sits in the southwestern United States, bordered by Colorado to the north, Texas and Oklahoma to the east, Texas and the Mexican states of Chihuahua and Sonora to the south, and Arizona to the west. The state covers 121,590 square miles and its capital, Santa Fe, sits at roughly 35.69°N, 105.94°W in the northern Rio Grande valley.
New Mexico Location 2026
New Mexico is a landlocked state positioned in the Mountain Time Zone, occupying the southern edge of the American Southwest. Anyone typing “New Mexico” into a search bar wants a fast answer, and the fast answer is this: it is the fifth-largest state by land area, ranked 36th by population, and it shares an international border with Mexico along its southern edge. The terrain ranges from the Sangre de Cristo Mountains in the north to the Chihuahuan Desert in the south, with the Rio Grande cutting through the middle of the state from north to south. Elevation swings from 2,842 feet near Red Bluff Reservoir on the Texas line to 13,161 feet at Wheeler Peak.
This geography shapes everything else in this report. New Mexico’s population clusters along the Rio Grande corridor, particularly around Albuquerque, while vast stretches of the eastern plains and western high desert remain sparsely settled. The state joined the union on January 6, 1912, becoming the 47th state. Santa Fe, founded by Spanish colonists in 1610, holds the title of the oldest state capital in the country and sits at the highest elevation of any state capital in the United States. Below, every core statistic on New Mexico’s population, land area, economy, and demographics is broken down section by section using verified 2026 data.
Interesting Facts About New Mexico (2026)
| Category | Confirmed 2026 Data |
|---|---|
| Statehood | January 6, 1912 (47th state) |
| Capital | Santa Fe |
| Largest City | Albuquerque |
| Total Population | 2,124,222 |
| Total Area | 121,590 sq. miles |
| State Rank by Area | 5th largest |
| State Rank by Population | 36th |
| Number of Counties | 33 |
| Highest Point | Wheeler Peak, 13,161 ft |
| State GDP | $120.9 billion |
| Median Household Income | $64,059 |
| Time Zone | Mountain Time (UTC-7) |
Source: U.S. Census Bureau, U.S. Bureau of Economic Analysis
New Mexico’s identity is built on a mix of geographic scale and demographic modesty. It ranks among the largest states in the nation by land, yet only 36th by population, which produces one of the lowest population density figures in the country. The 121,590 square miles of territory sit almost entirely landlocked, with a tiny water share of roughly 292 square miles, meaning the vast majority of the state’s footprint is desert, mesa, plain, and mountain rather than lake or river surface.
The economic figures tell a parallel story. A $120.9 billion state GDP, driven heavily by government spending and the oil and gas sector in the Permian Basin, sits alongside a median household income of $64,059, a figure below the national median. 33 counties administer a state where more than 65% of residents live inside incorporated cities and towns, even though those cities occupy only about 1% of the total land area. That contrast between wide-open land and concentrated population defines nearly every statistic that follows.
New Mexico Population Statistics 2026
New Mexico Population Trend (2020–2026, millions)
2020 ██████████████████████████████████ 2.118M
2022 ██████████████████████████████████ 2.113M
2024 ███████████████████████████████████ 2.127M
2025 ███████████████████████████████████ 2.125M
2026 ███████████████████████████████████ 2.124M
| Year | Population | Annual Change |
|---|---|---|
| 2020 | 2,118,446 | +0.90% |
| 2022 | 2,112,859 | -0.21% |
| 2023 | 2,119,349 | +0.31% |
| 2024 | 2,126,774 | +0.35% |
| 2025 | 2,125,498 | -0.06% |
| 2026 | 2,124,222 | -0.06% |
Source: U.S. Census Bureau, Vintage Population Estimates
The New Mexico population has held remarkably flat across the last six years, moving inside a narrow band of roughly 14,000 people despite national growth trends pulling in a different direction. 2024 produced the strongest single-year gain in this window, adding close to 7,400 residents, largely credited to net migration into the Albuquerque and Santa Fe metro corridors. That gain reversed slightly heading into 2025 and 2026, with the state recording small net losses of about 1,300 people each year, driven by a combination of domestic out-migration from rural counties and a birth rate that barely outpaces the death rate among an aging resident base.
Context matters here. A population near 2.12 million places New Mexico at 36th among the fifty states, representing roughly 0.62% of the total U.S. population. Compared to 1900, when the territory counted under 200,000 residents, today’s figure is more than ten times larger, reflecting a full century of railroad expansion, federal research investment (Los Alamos and Sandia National Laboratories), and Sun Belt migration. Even so, the growth curve has flattened dramatically since the 1980s boom years, when annual increases regularly topped 2%. The state now sits in a slow-growth, near-equilibrium phase that planners expect to continue through the rest of this decade.
New Mexico Area and Land Size Statistics 2026
Land vs Water Area (sq. miles)
Land  █████████████████████████████████████████ 121,298
Water █ 292
| Metric | Measurement |
|---|---|
| Total Area | 121,590 sq. mi (314,917 sq. km) |
| Land Area | 121,298 sq. mi (314,161 sq. km) |
| Water Area | 292 sq. mi (757 sq. km) |
| National Area Rank | 5th |
| Length (North–South) | Approx. 391 miles |
| Width (East–West) | Approx. 352 miles |
Source: U.S. Census Bureau, Geography Division
New Mexico’s area of 121,590 square miles makes it the fifth-largest state in the country, trailing only Alaska, Texas, California, and Montana. What stands out in the numbers is how little of that territory is water. Only 292 square miles, less than 0.25% of the total, is classified as water area, a figure that ranks among the lowest water shares of any U.S. state. This is a landlocked, arid geography where nearly every acre is either high desert, grassland, mesa, or mountain forest, and where reservoirs like Elephant Butte and Navajo Lake account for most of the surface water that does exist.
Physically, the state stretches roughly 391 miles from its northern border with Colorado to its southern border with Texas and Mexico, and about 352 miles from the Arizona line to the Texas Panhandle. That scale explains why New Mexico contains such dramatic internal variation, from alpine tundra above 12,000 feet in the Sangre de Cristo range to the Chihuahuan Desert floor below 3,000 feet near the Texas border. Land size this large paired with a population barely over 2.1 million produces a population density of roughly 17 people per square mile, among the lowest densities of any state outside the Mountain West and Alaska.
New Mexico Largest Cities Population 2026
Top 5 Cities by Population (thousands)
Albuquerque ████████████████████████████████████████████████ 562.5
Las Cruces  ██████████ 112.6
Rio Rancho  █████████ 106.5
Santa Fe    ███████ 88.2
Roswell     ████ 47.8
| City | 2026 Population | County |
|---|---|---|
| Albuquerque | 562,488 | Bernalillo |
| Las Cruces | 112,612 | Doña Ana |
| Rio Rancho | 106,533 | Sandoval |
| Santa Fe | 88,224 | Santa Fe |
| Roswell | 47,823 | Chaves |
| Farmington | 46,339 | San Juan |
Source: U.S. Census Bureau, Population Estimates Program
Albuquerque dominates every ranking of New Mexico cities, holding a population of 562,488, which is roughly five times larger than the second-place city, Las Cruces, at 112,612 residents. This single-city dominance is unusual among U.S. states of comparable population; Albuquerque alone accounts for more than 26% of the entire state’s population, and the Albuquerque metropolitan area, which spans Bernalillo, Sandoval, Torrance, and Valencia counties, holds close to 935,000 people, nearly 44% of all New Mexicans in one metro footprint.
Beyond the top tier, growth patterns diverge sharply by geography. Rio Rancho, in Sandoval County, has posted some of the fastest gains in the state, expanding roughly 10% since the 2020 census base as Albuquerque commuters push into its subdivisions. Santa Fe, the capital, continues steady single-digit growth tied to tourism, state government employment, and an influx of remote workers. Meanwhile, cities tied to the state’s older mining and agricultural economy, including Roswell, Clovis, and Gallup, have posted flat or declining populations over the same period, reflecting the broader rural-to-urban migration pattern playing out across the American Southwest.
New Mexico Economy and GDP Statistics 2026
GDP by Leading Industry (2025, $ billions)
Government             ████████████████████████████ 24.3
Mining & Oil/Gas       █████████████████████ 18.0
Prof. & Business Svcs. ██████████████████ 15.6
| Economic Indicator | 2025 Figure |
|---|---|
| Real State GDP | $120.9 billion |
| GDP per Capita | $56,900 |
| Leading Industry | Government ($24.3B) |
| 2nd Industry | Mining, Oil & Gas ($18.0B) |
| 3rd Industry | Professional & Business Services ($15.6B) |
| Median Household Income | $64,059 |
| Per Capita Income | $36,218 |
Source: U.S. Bureau of Economic Analysis
New Mexico’s economy produced a real GDP of $120.9 billion in 2025, a 1.5% increase over the prior year and the highest inflation-adjusted output the state has ever recorded. Government activity remains the single largest contributor at $24.3 billion, a reflection of the state’s heavy federal footprint through Los Alamos National Laboratory, Sandia National Laboratories, Kirtland Air Force Base, and White Sands Missile Range. Mining, quarrying, and oil and gas extraction ranks second at $18 billion, and this sector has grown the fastest of any industry in the state, now generating 2.4 times the output it produced a decade earlier, driven almost entirely by Permian Basin drilling activity in Lea and Eddy counties.
Household-level numbers sit below these headline production figures. Median household income of $64,059 trails the national median by a meaningful margin, and per capita income of $36,218 reflects a state economy where enormous extraction-sector revenue does not always translate evenly into wages across every county. GDP per capita of $56,900, up 1.6% year over year, ranks New Mexico 38th among the fifty states on this inflation-adjusted measure. The gap between total production and household income is a defining feature of the state’s economic profile, with oil and gas royalties flowing heavily into state government coffers and public-sector budgets rather than directly into private paychecks.
New Mexico Demographics Statistics 2026
Race & Ethnicity Share of Population (%)
White               ████████████████████████████████ 80.5
Hispanic or Latino  ████████████████████████████ 49.0
American Indian/AK  █████ 11.4
| Demographic Metric | Share of Population |
|---|---|
| White (alone) | 80.5% |
| Hispanic or Latino | 49.0% |
| American Indian/Alaska Native | 11.4% |
| Black or African American | 2.9% |
| Asian | 2.1% |
| Under 18 Years | 21.0% |
| 65 Years and Over | 20.2% |
| Female Population | 50.2% |
Source: U.S. Census Bureau, American Community Survey
New Mexico’s demographic profile stands apart from most U.S. states because of its Hispanic and Native American population shares. Nearly half of all residents, 49.0%, identify as Hispanic or Latino, one of the highest shares of any state and a reflection of nearly 400 years of continuous Spanish and Mexican settlement history predating U.S. statehood by centuries. The American Indian and Alaska Native population sits at 11.4%, roughly eight times the national average, driven by the presence of the Navajo Nation in the northwest, plus 19 Pueblo communities and Apache tribal lands spread across the state.
Age structure also stands out. 20.2% of residents are 65 or older, a share that has climbed steadily as younger residents leave rural counties for job opportunities in Colorado, Arizona, and Texas, leaving behind an aging population base in much of the eastern plains and northern mountain counties. Meanwhile, 21.0% of the population is under 18, keeping the dependency ratio elevated on both ends of the age spectrum. Gender distribution remains close to the national norm, with women making up 50.2% of residents, and the overall picture is a state whose population is older, more rural in large stretches, and more ethnically distinct than the national average by a wide margin.
New Mexico Counties and Geography Facts 2026
Population by Top 3 Counties (thousands)
Bernalillo  ████████████████████████████████████████ 675
Doña Ana    ███████████████ 229
Santa Fe    ██████████ 157
| County | Population (2025) | County Seat |
|---|---|---|
| Bernalillo | ~675,000 | Albuquerque |
| Doña Ana | 229,091 | Las Cruces |
| Santa Fe | 156,907 | Santa Fe |
| Sandoval | ~155,000 | Bernalillo |
| San Juan | ~121,000 | Aztec |
Source: U.S. Census Bureau, County Population Estimates
New Mexico’s 33 counties vary enormously in both size and density. Bernalillo County, home to Albuquerque, is by far the most populous, holding close to one-third of the entire state’s residents inside a county that covers barely 1,169 square miles. Doña Ana County, anchored by Las Cruces near the Texas and Mexico borders, ranks second with 229,091 residents spread across 3,814 square miles, a land area more than three times larger than Bernalillo yet with a fraction of the population density.
At the other extreme, counties like Harding, De Baca, and Catron hold fewer than 3,000 residents each across thousands of square miles of open range and national forest, some of the lowest population densities anywhere in the continental United States. Santa Fe County, with 156,907 residents, sits third statewide and includes the state capital along with a significant share of the state’s tourism and arts economy. This lopsided county-level distribution, five metro-adjacent counties holding the bulk of the population while roughly two dozen rural counties share the rest, mirrors the urban concentration pattern already visible in the city-level statistics above.
The practical effect of this imbalance shows up in everything from school district funding to rural healthcare access. Counties with fewer than 10,000 residents frequently operate with a single hospital, one or two K-12 school districts, and limited broadband infrastructure, while Bernalillo, Doña Ana, and Santa Fe counties absorb the bulk of new state and federal infrastructure spending. Water rights add another layer of complexity across county lines, since the Rio Grande and its tributaries flow through several jurisdictions with competing agricultural, municipal, and tribal claims. Any reader trying to understand New Mexico’s statistics at a granular level needs to treat the state not as one uniform population but as a cluster of dense metro counties surrounded by a much larger, sparsely populated rural periphery.
New Mexico Key Facts and Symbols 2026
Elevation Extremes (feet)
Wheeler Peak (highest)     ██████████████████████████ 13,161
Red Bluff Res. (lowest)    ███████ 2,842
| Fact | Detail |
|---|---|
| State Nickname | Land of Enchantment |
| State Bird | Greater Roadrunner |
| State Flower | Yucca Flower |
| Highest Elevation | 13,161 ft, Wheeler Peak |
| Lowest Elevation | 2,842 ft, Red Bluff Reservoir |
| Number of Pueblo Nations | 19 |
| Statehood Number | 47th |
Source: New Mexico Secretary of State, National Park Service
New Mexico’s official nickname, the Land of Enchantment, appears on state license plates and tourism materials, and it reflects the dramatic elevation range packed inside one state’s borders. The gap between Wheeler Peak at 13,161 feet and the low point near Red Bluff Reservoir at 2,842 feet spans more than 10,000 vertical feet, producing climate zones that range from alpine tundra to Chihuahuan Desert scrub within a single day’s drive.
Cultural symbols carry equal weight in how the state is documented statistically. The Greater Roadrunner, chosen as state bird in 1949, and the Yucca Flower, adopted as state flower in 1927, both reflect the arid, high-desert ecology that defines most of the state’s land area. The presence of 19 federally recognized Pueblo nations, along with Navajo and Apache tribal governments, gives New Mexico one of the highest concentrations of sovereign Native nations of any U.S. state, a factor that shapes land use, water rights, and population statistics across the northwestern quarter of the state in particular.
Frequently Asked Questions About New Mexico 2026
Where is New Mexico located on the US map?
New Mexico sits in the southwestern United States, bordered by Colorado on the north, Texas and Oklahoma on the east, Texas and Mexico on the south, and Arizona on the west.
What is the population of New Mexico in 2026?
The 2026 population of New Mexico stands at approximately 2,124,222, ranking the state 36th in the nation.
How big is New Mexico in square miles?
New Mexico covers 121,590 square miles, making it the 5th largest state by total area in the United States.
What is the capital of New Mexico?
Santa Fe is the capital of New Mexico and the oldest state capital in the country, founded in 1610.
What is the largest city in New Mexico?
Albuquerque is the largest city in New Mexico, with a 2026 population of 562,488.
Is New Mexico part of Mexico?
No. New Mexico is a U.S. state that borders the country of Mexico along its southern edge but has been part of the United States since 1912.
When did New Mexico become a state?
New Mexico became the 47th U.S. state on January 6, 1912.
What is New Mexico’s state GDP in 2025?
New Mexico’s real GDP reached $120.9 billion in 2025, with government and oil and gas extraction as the top contributing industries.
How many counties does New Mexico have?
New Mexico is divided into 33 counties, with Bernalillo County holding the largest population.
What time zone is New Mexico in?
New Mexico operates on Mountain Time (UTC-7), observing daylight saving time for most of the year.
Disclaimer: The data research report we present here is based on information found from various sources. We are not liable for any financial loss, errors, or damages of any kind that may result from the use of the information herein. We acknowledge that though we try to report accurately, we cannot verify the absolute facts of everything that has been represented.