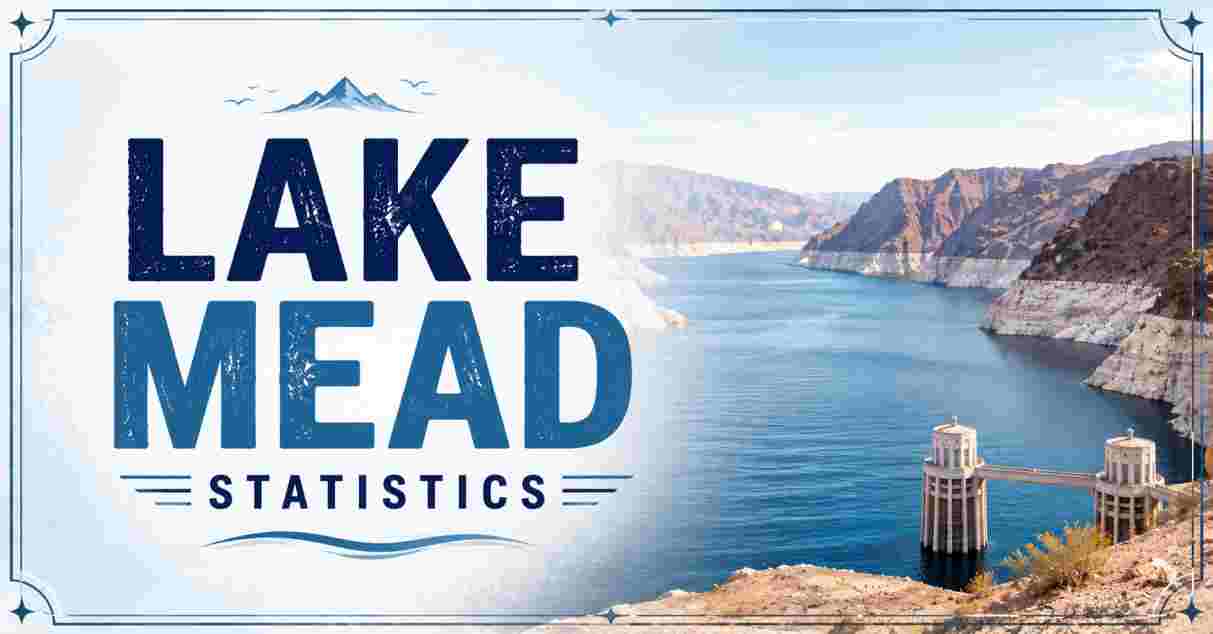
Lake Mead in 2026
Lake Mead, the reservoir formed by the Hoover Dam on the Colorado River, has spent the first half of August 2026 doing something it has never done before: falling to the lowest water level ever recorded since the reservoir first began filling in the 1930s. As the largest reservoir in the United States by storage capacity, Lake Mead supplies water to millions of people across Nevada, Arizona, California, and parts of northern Mexico, making its physical condition one of the most closely watched indicators of the American Southwest’s ongoing water crisis. The lake’s decline isn’t a single dramatic event but the latest chapter in a more than two-decade downward trajectory, driven by a persistent regional megadrought and water demand that has consistently outpaced the Colorado River’s natural flow.
This report compiles the latest verified Lake Mead statistics for 2026, covering the reservoir’s record-breaking water level decline, its current storage capacity, the critical hydropower thresholds it is approaching at Hoover Dam, and the broader Colorado River Basin water crisis driving the numbers. Every figure below is sourced directly from the U.S. Bureau of Reclamation, the federal agency responsible for managing the lake, along with reporting current as of August 10, 2026.
Interesting Facts About Lake Mead in 2026
Lake Mead 2026: Record Low vs. Historical Peak
Current elevation (Aug 8, 2026) |███████              | 1,040.34 ft
Historic peak (July 24, 1983)   |█████████████████████| 1,225.83 ft
| Interesting Fact | 2026 Figure |
|---|---|
| New record-low elevation | 1,040.34 feet (August 8, 2026) |
| Previous record low | 1,040.58 feet (July 28, 2022) |
| Current percent full | 26.8% |
| Current storage | 7,001,100 acre-feet |
| Total reservoir capacity | 26,120,000 acre-feet |
| Historic record-high elevation | 1,225.83 feet (July 24, 1983) |
| Gap below full capacity | ~185 feet lower than 1983 levels |
| People relying on Colorado River Basin water | ~40 million across seven states and Mexico |
Source: U.S. Bureau of Reclamation; ReservoirBench.com Daily Western Reservoir Conditions, August 10, 2026
Lake Mead’s plunge to 1,040.34 feet on August 8, 2026 — its lowest recorded elevation since daily tracking began in 1935 — now sits just 0.24 feet below the previous record set in July 2022, a gap so narrow that hydrologists describe the two events as part of the same long-term drought pattern rather than separate crises. What makes the current reading especially stark is the comparison to the reservoir’s all-time high: Lake Mead has not been full since July 24, 1983, when it reached 1,225.83 feet, meaning today’s water level sits roughly 185 feet lower than the last time the lake brimmed at capacity.
The reservoir’s importance extends far beyond Nevada and Arizona’s borders. As part of the broader Colorado River system, Lake Mead and its companion reservoir Lake Powell supply drinking and irrigation water to approximately 40 million people across seven US states and northern Mexico, making even relatively small percentage changes in storage — the lake currently sits at just 26.8% of capacity — carry outsized consequences for agriculture, drinking water supplies, and hydropower generation across the entire American Southwest.
Lake Mead Record Low Water Level Statistics in 2026
Lake Mead Elevation: Daily Decline, August 2026
Aug 6   |███████████████████████████████ | 1,040.50 ft — breaks 2022 record
Aug 7   |███████████████████████████████ | 1,040.5 ft — confirmed by Reclamation
Aug 8   |███████████████████████████████ | 1,040.34 ft — new record low
Aug 9   |███████████████████████████████▌| 1,040.3 ft
| Date (2026) | Elevation | Note |
|---|---|---|
| July 28, 2022 (prior record) | 1,040.58 feet | Previous all-time low |
| July 31, 2026 | Declining daily from this date | Start of the current continuous drop |
| August 6, 2026 (Thursday) | 1,040.50 feet | Breaks the 2022 record |
| August 8, 2026 (Saturday) | 1,040.34 feet | New all-time record low |
| August 9, 2026 (Sunday) | ~1,040.3 feet | Continued decline |
| Weekly change (as of Aug 8) | -0.72 feet | Over the previous 7 days |
| Monthly change | -2.67 feet | Over the previous 30 days |
| Annual change | -13.99 feet | Over the previous 12 months |
Source: U.S. Bureau of Reclamation daily elevation data; ReservoirBench.com; ABC News; CNN; UPI, August 6-10, 2026
Lake Mead’s water level has fallen every single day since July 31, 2026, according to Bureau of Reclamation data, first breaking the July 2022 record on August 6 at 1,040.50 feet, then continuing to drop to a new low of 1,040.34 feet on August 8 — a decline of nearly 14 feet over just the past year and roughly 0.72 feet in the most recent week alone. Hydrologists have been careful to frame the record itself with context rather than alarm: Jack Schmidt, director of the Center for Colorado River Studies at Utah State University, compared the record-breaking to a sports statistic, noting that “every record that’s broken is a teaching moment” about the underlying conditions driving the decline rather than a single dramatic threshold crossed.
The immediate cause of this year’s continued deterioration traces directly to conditions during the preceding winter and spring. Sarah Porter, director of the Kyl Center for Water Policy at Arizona State University, pointed to historically low snowpack across the Colorado River’s upper watershed combined with one of the lowest runoff years on record, meaning the system received essentially no meaningful recovery heading into the 2026 water year — a pattern that has now compounded on top of more than two decades of below-average conditions across the broader river basin.
Lake Mead Capacity and Storage Statistics in 2026
Lake Mead Storage vs. Total Capacity (August 8, 2026)
Current storage   |███████                   | 7,001,100 acre-feet (26.8%)
Total capacity    |██████████████████████████| 26,120,000 acre-feet
| Storage Metric | Figure |
|---|---|
| Current storage (August 8, 2026) | 7,001,100 acre-feet |
| Total reservoir capacity | 26,120,000 acre-feet |
| Percent full | 26.8% |
| Storage vs. 92-year historical average for this date | 38% |
| Combined Mead + Powell storage decline (12 months to July 28, 2026) | 3.04 million acre-feet lost |
| Combined Mead + Powell storage level context | Lowest since 1957 |
Source: U.S. Bureau of Reclamation; ReservoirBench.com; reservoirs.earth Colorado River Water Cuts analysis, August 2026
Lake Mead’s 7,001,100 acre-feet of current storage against a total design capacity of 26,120,000 acre-feet places the reservoir at just 26.8% full — and critically, that figure represents only 38% of what storage has historically averaged for this exact date across 92 years of Bureau of Reclamation record-keeping, underscoring how far below normal conditions the lake has fallen even by drought-era standards. One acre-foot of water — enough to cover a single acre one foot deep — is roughly enough to supply one to two average American households for a year, making the current storage level enough to serve only a fraction of the population the reservoir was designed to support during a full water year.
The broader system-level picture is equally sobering: combined storage across both Lake Mead and Lake Powell — the Colorado River’s two major reservoirs — dropped by 3.04 million acre-feet in the twelve months ending July 28, 2026, pushing their combined storage level to its lowest point since 1957, during the construction of the Glen Canyon Dam, before Lake Powell had even begun to fill. Kathryn Sorensen, director of research at Arizona State University’s Kyl Center for Water Policy, described the two reservoirs as “the region’s savings account,” warning that the basin has been “drawing it down for years because the river has been overallocated while enduring 25 years of persistent drought.”
Lake Mead Historical Water Level Comparison in 2026
Lake Mead Elevation: Key Historical Milestones
1983 (record high)      |████████████████████████| 1,225.83 ft
2022 (prior record low) |███████                 | 1,040.58 ft
2026 (new record low)   |███████                 | 1,040.34 ft
| Year / Event | Elevation | Context |
|---|---|---|
| 1941 | Reservoir first reaches capacity | 5 years after Hoover Dam opened (1936) |
| July 24, 1983 | 1,225.83 feet (all-time high) | Massive snowmelt forced spillway use — the only time in the dam’s history |
| February 16, 2022 | Low water level widely photographed | Prolonged drought visibly reshaping shoreline |
| July 28, 2022 | 1,040.58 feet (prior record low) | Held for four years before being broken |
| August 8, 2026 | 1,040.34 feet (new record low) | Lowest since daily tracking began Feb. 2, 1935 |
Source: U.S. Bureau of Reclamation; Cronkite News; ReservoirBench.com
The distance between Lake Mead’s 1983 record high of 1,225.83 feet and today’s 1,040.34-foot reading captures the scale of change the reservoir has undergone in a single generation. That 1983 peak was driven by an exceptionally heavy snowmelt year so significant that engineers had to open Hoover Dam’s spillways for the first and only time in the dam’s operating history — a scenario that stands in almost total contrast to the chronic under-supply conditions defining the reservoir today. Since that peak, receding water has progressively exposed what locals and geologists call “bathtub rings” — mineral deposits left on the reservoir’s canyon walls marking dozens of feet of previous, higher water lines — turning the shoreline itself into a visible timeline of the basin’s drought history.
The comparison between 2022 and 2026 is instructive in a different way: while the two record lows sit within a quarter of a foot of each other, the years between them tell an important story about the limits of temporary relief. Several wetter winters following the 2022 low allowed Lake Mead to partially recover, briefly easing the crisis — but that recovery proved insufficient to offset the combination of sustained high water demand and the return of severe drought conditions during the 2025-2026 winter, illustrating that a handful of good snow years can no longer reliably reverse the basin’s long-term trajectory.
Hoover Dam Hydropower Risk Statistics in 2026
Lake Mead: Distance to Critical Hydropower Thresholds
Current elevation (Aug 2026)  |███████████████████████████| 1,040.3 ft
Hydropower reduction threshold|██████████████████████████ | 1,035 ft (-5.3 ft away)
Dead pool threshold           |█████████████              | 895 ft (-145.3 ft away)
| Threshold | Elevation | Consequence |
|---|---|---|
| Current level (August 2026) | ~1,040.3 feet | — |
| Hydropower reduction threshold | 1,035 feet | Some Hoover Dam turbines forced to shut down; generation capacity drops 70% |
| Distance from current level to this threshold | ~5.3 feet | Bureau of Reclamation forecasts possible approach within months |
| Dead pool threshold | 895 feet | Water too low to flow downstream; dam can no longer generate any electricity |
| New turbine investment (announced May 21, 2026) | $52 million | Turbines redesigned for low-water operating conditions |
| Bureau forecast for reaching 1,035 ft | Possibly by spring 2027 | Per July 2026 Bureau of Reclamation report |
Source: TIME, August 10, 2026; Cronkite News, June 2026; Bureau of Reclamation July 2026 forecast
Lake Mead’s current elevation puts it uncomfortably close to a genuinely consequential engineering threshold: at 1,035 feet, some of Hoover Dam’s turbines would be forced to shut down entirely, and the dam’s overall electricity generation capacity would fall by roughly 70%. With the lake sitting at approximately 1,040.3 feet as of early August, that threshold is now only about five feet away — and a July 2026 Bureau of Reclamation forecast warned the reservoir could approach that mark within the next few months, with the possibility of falling below it entirely by spring 2027 if drought conditions persist through the coming winter.
In response, the Bureau of Reclamation announced in May 2026 that it would spend $52 million on new turbines specifically engineered to continue operating efficiently at the historically low water levels Lake Mead is now experiencing — an implicit acknowledgment from federal water managers that a return to historically normal lake levels is not the planning assumption driving current infrastructure investment. Should conditions deteriorate further toward the reservoir’s ultimate 895-foot “dead pool” threshold — the point at which water can no longer physically flow downstream through the dam at all — Hoover Dam would stop generating power entirely, though current projections suggest that far more severe outcome remains a considerably more distant risk than the nearer-term 1,035-foot hydropower threshold.
Colorado River Basin Drought and Water Cuts Statistics in 2026
Colorado River Lower Basin: Mandated Water Cuts, 2026
Required cut, 2026-2028 (final framework)  |████████             | ~20% (1.3 maf/year)
Maximum permitted cut if conditions worsen |███████████████████████████| ~40% (3.0 maf/year)
| Water Cut Metric | 2026 Figure |
|---|---|
| Shortage tier in effect since 2022 (Lake Mead) | Tier 1 Shortage Condition |
| Tier 2 shortage year (steeper cuts) | 2023 |
| New federal cuts framework published | July 31, 2026 |
| Required Lower Basin cuts, 2026-2028 | ~20% (~1.3 million acre-feet/year) |
| Lower Basin’s 2020-2024 average annual use | ~6.5 million acre-feet |
| Maximum permitted shortage if conditions worsen | 3.0 million acre-feet/year (~40% of entitlement) |
| Framework duration | Through 2036 |
Source: reservoirs.earth Colorado River Water Cuts analysis; Congress.gov CRS Report R45546; Western Water, July 2026
Lake Mead has operated under a federally mandated Tier 1 Shortage Condition continuously since 2022 — with the exception of 2023, when conditions were severe enough to trigger the steeper Tier 2 shortage — meaning Arizona and Nevada have already absorbed multiple consecutive years of reduced water deliveries even before this year’s record-low reading. With the seven Colorado River Basin states unable to reach a voluntary consensus agreement by the Bureau of Reclamation’s February 14, 2026 deadline, the federal government stepped in and published its own binding framework on July 31, 2026, requiring Arizona, California, and Nevada to cut their combined Colorado River use by roughly 20% — about 1.3 million acre-feet annually — over the following two years.
That new framework, which governs operations through 2036, also builds in room for far more severe reductions if conditions continue deteriorating: it permits shortages of up to 3.0 million acre-feet per year, or roughly 40% of the Lower Basin’s total legal entitlement, should Lake Mead and Lake Powell’s combined decline continue at anything close to the pace recorded over the past year. That safety margin matters because the basin’s reservoirs lost 3.04 million acre-feet combined in the twelve months ending July 28, 2026 — almost precisely matching the single-year maximum the new federal framework permits, illustrating just how thin the margin has become between the plan’s built-in flexibility and the pace of the actual drought unfolding on the ground.
Colorado River States Negotiations and Legal Battles in 2026
Colorado River Negotiations: What Each State Proposed vs. Received
Arizona proposed cut        |███████                | 27%
Nevada proposed cut         |█████                  | 17%
California proposed cut     |███                    | 10%
"No deal" scenario for AZ   |███████████████████████| Up to 77%
| Negotiation Detail | Figure |
|---|---|
| Deadline for states to reach voluntary agreement | February 14, 2026 (missed) |
| Arizona’s proposed self-cut | 27% |
| Nevada’s proposed self-cut | 17% |
| California’s proposed self-cut | 10% |
| Arizona’s potential cut under “no deal” federal proposal | Up to 77% |
| Upper Basin states’ position | Refused to share in mandatory cuts |
| Litigation risk | Arizona has raised the possibility of a lawsuit |
Source: Cronkite News, June 2026; lawnbyseason.com Colorado River 2026 analysis, April 2026
The negotiation breakdown behind this year’s federally imposed framework reflects a long-running structural dispute between the river’s two halves. The Lower Basin states — Arizona, California, and Nevada — draw directly from Lake Mead and have consistently argued that the Upper Basin states — Colorado, New Mexico, Utah, and Wyoming — should share in mandatory cuts during drought years. The Upper Basin has just as consistently refused, arguing that its states already use less than their full legal allocation and that Lower Basin states, which have historically drawn more heavily from the river, should bear primary responsibility for reductions. Individual state proposals reflected that same asymmetry: Arizona offered a 27% self-cut, Nevada 17%, and California just 10% — figures far below what a “no deal” federal scenario threatened to impose, which would have cut Arizona’s allocation by as much as 77%, a disproportionate outcome no other state faced under that draft proposal.
With the federal government’s July 2026 framework now in place, the immediate threat of an even harsher unilateral cut has eased somewhat, but tension between the basin states remains far from resolved — Arizona in particular has continued raising the possibility of litigation over the long-term allocation formula, a dispute observers say could still end up in lengthy, expensive court battles regardless of the current framework’s near-term stability. For a fuller picture of just how many people and how large a geographic footprint depend on the outcome of these negotiations, the full state-by-state US population data shows California, Texas, and Arizona all ranking among the nation’s largest and fastest-growing states — exactly the kind of sustained population growth that continues driving Colorado River demand even as the physical water supply shrinks.
Lake Mead Tourism and Recreation Impact Statistics in 2026
Lake Mead National Recreation Area: Key Facts
Designated                 → 1964 (first National Recreation Area in the US)
Formed by                  → Hoover Dam on the Colorado River
Location                   → Nevada and Arizona, near Boulder City/Las Vegas
Visible impact of drought  → "Bathtub rings," exposed intake pipes, relocated marinas
| Recreation Area Fact | Detail |
|---|---|
| Designation | America’s first National Recreation Area, established 1964 |
| Location | Nevada and Arizona, near Boulder City and Las Vegas |
| Visible drought marker | “Bathtub ring” mineral deposits on canyon walls |
| Notable drought-related discovery (2022) | Human remains found in a barrel as water receded |
| Infrastructure impact | National Park Service water intake pipes now exposed above the waterline |
Source: CNN, August 7, 2026; National Park Service
Lake Mead’s decline is not just a hydrological statistic — it has visibly reshaped one of the most heavily visited outdoor recreation destinations in the American Southwest. Designated in 1964 as the United States’ first National Recreation Area, Lake Mead draws boaters, anglers, and campers from across the region, but two decades of falling water levels have forced repeated relocations of marina facilities and left long stretches of former shoreline high and dry, exposing infrastructure like National Park Service water intake pipes that once sat safely underwater near features such as Pyramid Island. For broader context on how national recreation and park destinations across the US are performing amid these environmental pressures, the full national parks visitation and economic data shows the National Park System overall drawing a record 331.9 million visits, even as individual sites like Lake Mead face site-specific climate and drought challenges that don’t necessarily track the system-wide visitation trend.
The receding water has also produced more unsettling discoveries alongside the purely scenic changes: in 2022, falling levels exposed a barrel containing decades-old human remains, later identified as a homicide victim, drawing international media attention to just how dramatically the shoreline had retreated. That drought pattern sits within a broader climate context reshaping the entire Southwest — the same extreme heat and dry conditions depleting Lake Mead’s water supply are also driving the region’s mounting heat-mortality crisis, and the full heat-related death statistics for the US show Arizona and Nevada posting the nation’s highest heat-death rates per capita, underscoring how the same underlying drought and heat conditions are simultaneously straining the region’s water supply and public health systems.
Disclaimer: The data research report we present here is based on information found from various sources. We are not liable for any financial loss, errors, or damages of any kind that may result from the use of the information herein. We acknowledge that though we try to report accurately, we cannot verify the absolute facts of everything that has been represented.