Labor Day in America 2026
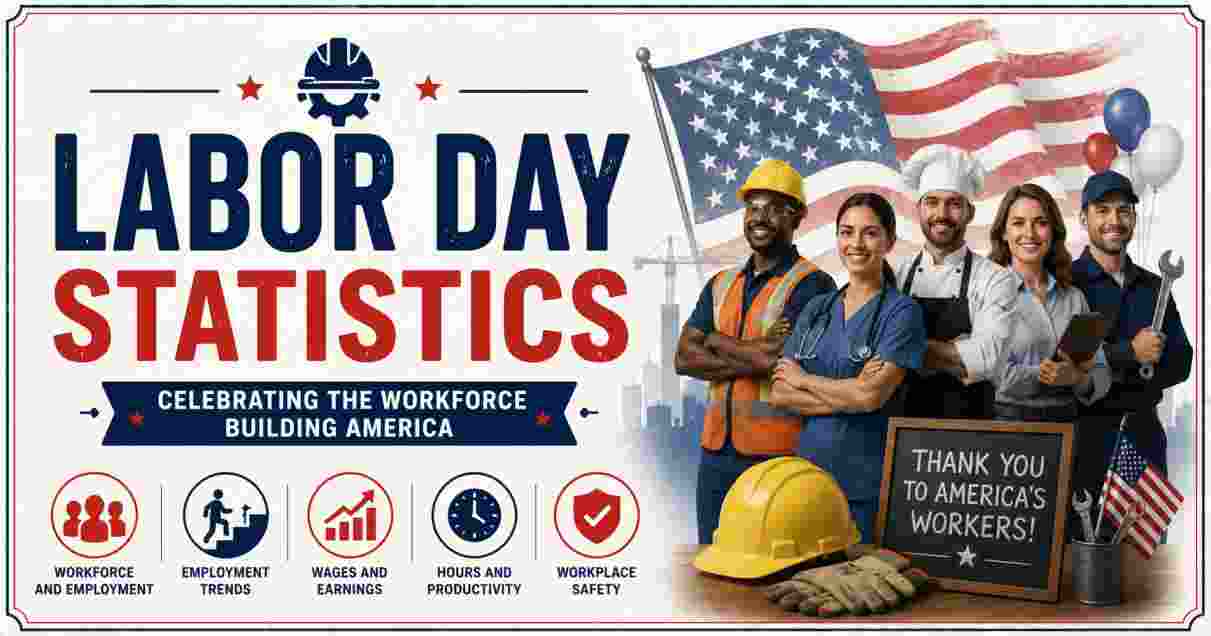
Labor Day falls on Monday, September 7, 2026, marking another year of the holiday that has anchored the American calendar since the late nineteenth century. Observed on the first Monday of September, it closes out the summer season with a three-day weekend that millions of households use for travel, shopping, and backyard gatherings. What began as a local parade organized by New York City’s Central Labor Union has grown into a nationwide observance recognized by every state and the federal government, one that still carries its original purpose: honoring the contributions of the American workforce to the country’s economic strength.
Beyond the long weekend, Labor Day sits at the intersection of several measurable economic moments — it doubles as the unofficial finish line of the back-to-school shopping season, one of the busiest air travel periods of the year, and a checkpoint for union membership and labor force data released annually by federal agencies. This article pulls together the most current verified statistics available as of August 2026 covering the holiday’s origins, travel patterns, workforce figures, and consumer spending, all sourced directly from official government releases and recognized industry research bodies.
Interesting Facts About Labor Day in the US 2026
| Fact | Detail |
|---|---|
| Labor Day 2026 Date | Monday, September 7, 2026 |
| First Labor Day Celebrated | September 5, 1882, in New York City |
| Became a Federal Holiday | June 28, 1894, signed by President Grover Cleveland |
| First State to Legalize It | Oregon, on February 21, 1887 |
| States With Laws by 1894 | 23 states had adopted the holiday before it became federal |
| Credited Founders | Peter J. McGuire and Matthew Maguire of the labor movement |
| US Households Owning a Grill or Smoker | 80% |
| Grill Owners Who Cook Out on Labor Day | 58% |
| TSA Travelers Screened, Labor Day Weekend | 10.4 million (record four-day total) |
| Union Membership Rate, US Workers | 10.0% |
Source: U.S. Department of Labor; Transportation Security Administration; Hearth, Patio & Barbecue Association; U.S. Bureau of Labor Statistics
Labor Day’s transformation from a single New York parade into a coast-to-coast federal observance happened faster than most people realize — just twelve years separated the first march in 1882 from President Cleveland’s signature on the federal holiday bill in 1894. That compressed timeline reflects how quickly the labor movement built political momentum during the late Gilded Age, using state-by-state legislation as a stepping stone toward Washington. The fact that 23 states had already independently created their own Labor Day laws by the time Congress acted shows this wasn’t a top-down decision; it was a groundswell that federal lawmakers eventually caught up with, partly under pressure following the deadly Pullman Strike earlier that same year.
The modern-day facts tell a different but related story — one of scale. A holiday that started as a symbolic gesture toward organized labor now moves 10.4 million air travelers in a single long weekend and touches 80% of American households through backyard grilling alone. These aren’t separate trends; they’re evidence that Labor Day has kept its identity as a workers’ holiday while absorbing an entirely new layer of consumer and travel behavior that didn’t exist when the observance was created. That dual nature — part civic tradition, part economic event — is what makes the statistics below worth tracking year over year.
Labor Day 2026 Date and Federal Holiday Status in the US
| Detail | Data |
|---|---|
| 2026 Observance Date | Monday, September 7, 2026 |
| Legal Basis | Act of Congress, June 28, 1894 (28 Stat. 96) |
| Signing President | Grover Cleveland |
| Introducing Legislator | Senator James Henderson Kyle of South Dakota (Bill S. 730) |
| Recognition Level | Federal holiday, observed in all 50 states |
| Fixed Scheduling Rule | First Monday in September, every year |
| Related Legislation | Uniform Monday Holiday Act, 1968 (82 Stat. 250) reaffirmed Monday-based federal holidays |
Source: U.S. Department of Labor; U.S. House of Representatives, Office of the Historian
Congress didn’t invent the first-Monday-in-September formula on a whim — it settled a genuine inconsistency. Before 1894, different cities and states celebrated Labor Day on the first day of September, the first Monday, or even the first Saturday, depending on local custom, so the federal statute served as much to standardize the date nationally as to create the holiday itself. That single legislative choice is why Labor Day 2026 lands on September 7 rather than a fixed calendar date like July 4 — it moves within a seven-day window each year based on which weekday the month begins on.
The 1968 Uniform Monday Holiday Act is a detail many people miss when discussing Labor Day, since it’s frequently associated with holidays like Washington’s Birthday and Veterans Day. In Labor Day’s case, the act didn’t change anything — the holiday was already Monday-based from 1894 — but it folded Labor Day into the broader federal framework guaranteeing government workers a predictable three-day weekend. That predictability is precisely why Labor Day weekend has become such a heavily trafficked period for travel and retail, a pattern the following sections cover in detail.
Labor Day Origins and History Timeline in the US 2026
| Year | Milestone |
|---|---|
| 1882 | First Labor Day parade held September 5 in New York City, drawing an estimated 10,000 to 20,000 workers |
| 1885–1886 | Municipal ordinances recognizing the day passed in several cities |
| 1887 | Oregon becomes the first state to pass a Labor Day law (February 21); Colorado, Massachusetts, New Jersey, and New York follow the same year |
| 1889–1890s | Connecticut, Nebraska, and Pennsylvania adopt state-level recognition |
| 1894 | 23 states have Labor Day laws before federal action; the Pullman Strike results in the deaths of 13 workers |
| June 28, 1894 | Labor Day becomes a federal holiday under President Cleveland |
Source: U.S. Department of Labor; Britannica
The Pullman Strike is the piece of this history that most shortens the distance between “state holiday” and “federal law.” After the Pullman Palace Car Company cut wages during the depression of the early 1890s, the resulting American Railway Union strike spread nationally and turned violent, leaving 13 workers dead. President Cleveland, eager to repair relations with organized labor without endorsing the more radical, internationally-linked May Day holiday, pushed the Labor Day bill through Congress within days of the strike’s end — a fast political response that explains why the federal signing came so soon after decades of slower, state-by-state adoption.
It’s also worth noting how contested the “founder” title remains even in official government sources. The U.S. Department of Labor itself acknowledges that either Peter J. McGuire, a vice president of the American Federation of Labor, or Matthew Maguire, a machinist linked to the Central Labor Union, may have proposed the idea first. Rather than a flaw in the record, this ambiguity reflects how Labor Day emerged organically from a broad organizing movement rather than a single person’s initiative — a detail that fits the holiday’s collective, worker-driven origins better than a tidy founder narrative would.
Labor Day Weekend Travel Statistics in the US 2026
| Metric | Figure (Most Recent Labor Day Period) |
|---|---|
| Total TSA Screenings, Friday–Monday | 10.4 million travelers |
| Busiest Single Day (Friday before Labor Day) | 2,971,217 passengers screened |
| Year-Over-Year Change | +3.3% versus the prior year’s Labor Day period |
| Historical Ranking of Peak Day | 15th busiest day in TSA’s nearly 24-year history |
| Average Domestic Round-Trip Airfare | $720 |
| Hotel Rate Change | -11% year-over-year |
| Rental Car Cost Change | -3% year-over-year |
Source: Transportation Security Administration; AAA
As of this writing in August 2026, the Transportation Security Administration and AAA have not yet published their forecasts for the upcoming Labor Day 2026 weekend — both organizations typically release holiday travel data in the final week of August, closer to the observance itself. The figures above reflect the most recent confirmed Labor Day travel period on record, and they show a holiday weekend that keeps setting new highs rather than plateauing: the 10.4 million four-day screening total was itself a record, built on a summer that had already produced eight of the ten busiest travel days in TSA’s history.
What stands out in the pricing data is the combination of record crowds and falling costs. Airfare, hotel rates, and rental cars all declined even as passenger volume climbed to an all-time high — a pattern largely attributed to expanded airline capacity and increased competition among travel providers heading into the fall shoulder season. For travelers weighing when to book, that combination historically makes the weekend before Labor Day one of the better value windows of the summer, provided they can tolerate the Friday getaway crush that produces the period’s single busiest travel day.
Labor Day Workforce and Union Statistics in the US 2026
| Metric | 2025 Data (Latest Released) |
|---|---|
| Union Membership Rate, All Workers | 10.0% |
| Total Union Members | 14.7 million |
| Workers Represented by a Union (incl. covered nonmembers) | 16.5 million |
| Public-Sector Union Membership Rate | 32.9% |
| Private-Sector Union Membership Rate | 5.9% |
| Median Weekly Earnings, Union Members | $1,404 |
| Median Weekly Earnings, Nonunion Workers | $1,174 |
| US Unemployment Rate (June 2026) | 4.2% |
Source: U.S. Bureau of Labor Statistics
The Bureau of Labor Statistics’ annual union membership report, covering 2025 and released in February 2026, shows a workforce where organized labor holds steady rather than expanding rapidly. The overall rate of 10.0% is described by BLS itself as “little changed” from the prior year’s 9.9%, but the flat headline number hides a more interesting split: public-sector unionization at 32.9% is now more than five times higher than the private-sector rate of 5.9%, and for the first time in years, federal government union membership has grown large enough to nearly match the entire manufacturing sector’s union total.
The earnings gap tied to union status remains one of the most consistent labor statistics year after year — full-time union members earned a median of $1,404 weekly in 2025, compared with $1,174 for nonunion workers, meaning nonunion pay sat at roughly 84% of union pay. That gap partly reflects industry and occupation mix rather than union status alone, since sectors like utilities (17.8%) and transportation and warehousing (13.6%) carry both higher unionization and higher baseline wages. For a broader look at how the national jobs picture has moved alongside these union figures, the US Unemployment Rate Statistics breakdown tracks the monthly trend that puts June 2026’s 4.2% rate in context.
Labor Day Back-to-School and Retail Spending Statistics in the US 2026
| Metric | 2026 Figure |
|---|---|
| Total Combined K-12 and College Spending | $146.8 billion (record) |
| K-12 Back-to-School Spending | $43.3 billion |
| College Back-to-School Spending | $103.5 billion (first time above $100 billion) |
| Average K-12 Family Spend | $863.86 |
| Average College Student/Family Spend | $1,437.79 |
| Shoppers Who Started by Early July | 62% |
| Prior Year Comparison (2025 Total) | $128.2 billion |
Source: National Retail Federation; Prosper Insights & Analytics
The National Retail Federation’s annual survey, fielded from July 1–8, 2026 among 7,677 consumers, timed the back-to-school shopping cycle that traditionally wraps up right around Labor Day weekend as families make their final purchases before classes resume. The $146.8 billion combined total represents a sharp jump from $128.2 billion in 2025, and the college segment crossing $100 billion for the first time is a genuine milestone in the survey’s history, which NRF has tracked since 2003. Even with 62% of shoppers starting early — slightly down from 67% the year before — total dollars spent kept climbing, suggesting higher per-item costs are doing more of the work than earlier shopping alone.
This spending surge sits alongside broader household financial pressures that shoppers are managing simultaneously, from grocery bills to revolving balances. Readers tracking how back-to-school and Labor Day-adjacent spending fits into the bigger household budget picture may find the Consumer Debt Statistics in US report useful context, since credit card and loan balances often absorb part of the seasonal spending bump documented here. Retailers, for their part, appear to be responding with earlier promotional windows and expanded discount events, a strategy NRF’s own chief economist has tied directly to consumers’ efforts to manage affordability concerns without cutting spending altogether.
Labor Day Grilling and Weekend Tradition Statistics in the US 2026
| Metric | Data (Latest HPBA Survey) |
|---|---|
| US Households Owning a Grill or Smoker | 80% |
| Preferred Grill Type: Gas | 64% |
| Preferred Grill Type: Charcoal | 44% |
| Preferred Grill Type: Electric | 9% |
| Grill Owners Who Cook Out on Labor Day | 58% |
| Canadian Household Grill Ownership (for comparison) | 80% |
Source: Hearth, Patio & Barbecue Association
The Hearth, Patio & Barbecue Association’s consumer survey remains the most cited source for grilling behavior tied to major US holidays, and its data shows Labor Day holding a firm position in the grilling calendar even though it trails Memorial Day and the Fourth of July as the year’s top cookout occasions. Grill ownership itself has climbed steadily over the past several years, rising from 64% of households in 2019 to 80% in the most recent survey cycle — a jump partly tied to increased outdoor living and patio investment during and after the pandemic years, and partly to the simple fact that grilling has become a year-round habit rather than a purely summer one.
Gas grills continue to dominate ownership at 64%, though many households own more than one type, which is why the ownership percentages across categories add up to more than 100%. For workers whose Labor Day plans double as a workplace safety topic — grills, propane, and outdoor equipment are a recurring source of seasonal injury claims — the Workers’ Compensation Statistics in US report offers relevant figures on how holiday-adjacent incidents factor into broader annual claims data. The 58% figure for Labor Day grilling specifically also underscores something distinct about the holiday compared with Memorial Day: it functions less as a “kickoff” event and more as one final, deliberate excuse to grill before the weather turns, a psychological framing HPBA’s own researchers have noted in past survey commentary.
Disclaimer: The data research report we present here is based on information found from various sources. We are not liable for any financial loss, errors, or damages of any kind that may result from the use of the information herein. We acknowledge that though we try to report accurately, we cannot verify the absolute facts of everything that has been represented.