Where is all the AI data center money actually going?
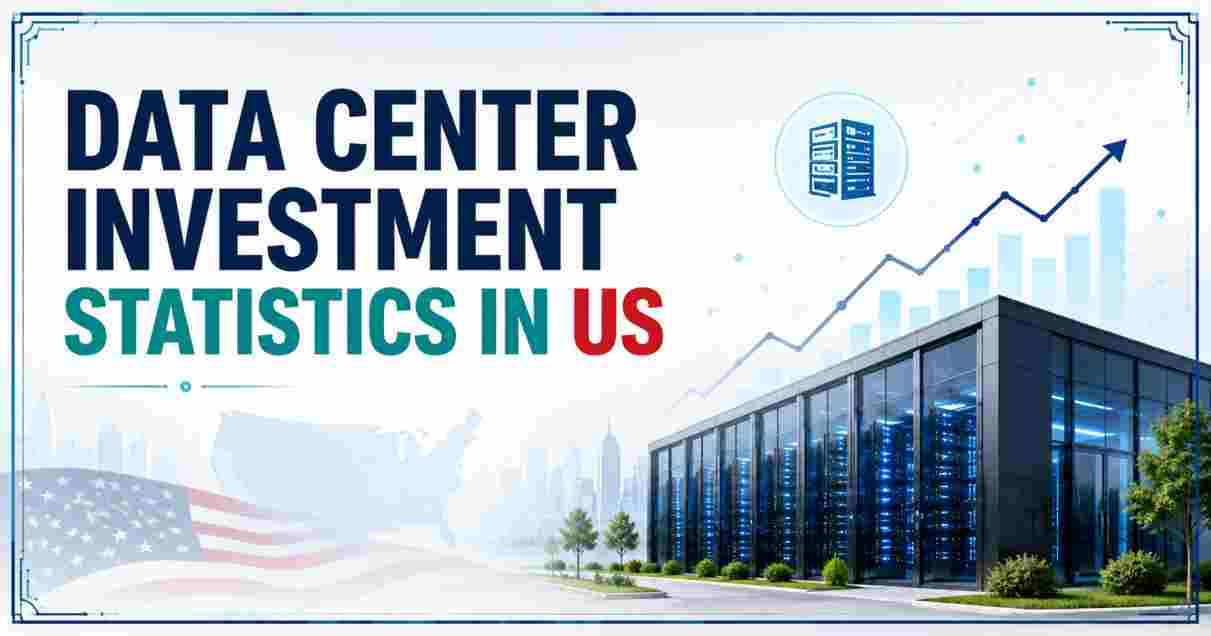
Data center investment in the United States has entered territory with no historical precedent — not in telecom, not in railroads, not in any prior industrial buildout. The five largest US cloud and AI infrastructure providers — Amazon, Alphabet, Microsoft, Meta, and Oracle — have collectively committed between $660 billion and $690 billion in capital expenditure for 2026 alone, nearly doubling the $388 billion these same companies spent in 2025. Roughly 75% of that spend, or about $450 billion, is directed specifically at AI infrastructure: GPU clusters, custom silicon, data center shells, and the networking equipment that ties it all together. This is not speculative money sitting on a balance sheet — it is being poured into concrete, steel, transformers, and racks of NVIDIA GPUs across dozens of American states right now.
What makes the 2026 investment cycle especially remarkable is where the money is landing. Project Stargate, the $500 billion joint venture between OpenAI, Oracle, and SoftBank, alone represents the single largest privately funded infrastructure announcement in US corporate history, with seven active US construction sites already underway. Meanwhile, US data center construction spending hit a monthly rate of $45.1 billion by the end of 2025, and year-to-date spending through April 2026 had already reached $49.5 billion — nearly four times the pace recorded in the same period a year earlier. Wall Street remains split on whether this level of spending is justified by AI revenue growth, but the hyperscalers themselves have shown no signs of slowing down.
Interesting Facts About Data Center Investment in the US 2026
| Fact Category | Key Data Point |
|---|---|
| Combined 2026 capex, Big Five hyperscalers | $660–690 billion, up from $388 billion in 2025 (roughly a 62–78% increase) |
| Share of hyperscaler capex targeting AI infrastructure | Approximately 75%, or roughly $450 billion |
| Amazon’s 2026 capex guidance | $200 billion, up from $125–131 billion in 2025 |
| Project Stargate total committed investment | $500 billion over four years; nearly $400 billion already committed across active sites |
| US data center construction spending, 2025 | $77.7 billion, a 190% year-over-year increase |
| US data center construction spending, Q1 2026 | $44.7 billion for the quarter alone |
| Global hyperscaler capex, 2025–2027 (Goldman Sachs projection) | $1.15 trillion, more than double the $477 billion spent from 2022–2024 |
| Debt raised by hyperscalers in 2025 to fund AI buildout | $108 billion, with projections of up to $1.5 trillion in debt issuance over coming years |
| Capital intensity as share of hyperscaler revenue | 45% to 57%, a level historically associated with utilities, not technology companies |
| Global data center capex on track to exceed $1 trillion | For the first time ever in 2026 — three years earlier than Dell’Oro Group had projected |
Source: CreditSights, Futurum Group, Goldman Sachs Research, Introl, American Industrial Magazine, Dell’Oro Group
These figures describe an investment cycle that has fundamentally reordered the priorities of America’s largest technology companies. A jump from $388 billion to as much as $690 billion in a single year is not incremental growth — it is a wholesale restructuring of how these companies allocate capital, with capital intensity now running at 45% to 57% of revenue, a ratio that resembles a utility or heavy industrial company far more than a traditional software business. The fact that hyperscalers raised $108 billion in debt in 2025 alone, with analysts at Morgan Stanley and JP Morgan projecting as much as $1.5 trillion in additional debt issuance ahead, signals that even companies generating tens of billions in free cash flow can no longer fund this buildout from operations alone.
The construction spending numbers tell the same story from a different angle: US data center construction starts grew from $14.9 billion in 2023 to $77.7 billion in 2025 — a four-year compound annual growth rate of roughly 98% — and the pace has only accelerated into 2026, with year-to-date spending through April already outpacing the entirety of the prior year’s comparable period by close to 4x. Whether this level of investment proves justified will depend heavily on whether AI revenue growth from companies like OpenAI and Anthropic can eventually catch up to the scale of infrastructure being built on their behalf, a gap that remains one of the central debates on Wall Street heading into the second half of 2026.
Hyperscaler Capital Expenditure Statistics in the US 2026
| Company | 2025 Capex | 2026 Guidance | Approx. YoY Change |
|---|---|---|---|
| Amazon | $125–131 billion | $200 billion | +53–60% |
| Alphabet / Google | $91 billion | $175–185 billion | +92–103% |
| Meta | $72 billion | $115–135 billion | +60–88% |
| Microsoft | $90 billion | $110–120 billion+ | +22–33% |
| Oracle | Smaller base | ~$50 billion | Significant increase |
| Combined (Big Five) | ~$388–443 billion | $660–690 billion | +50–78% |
Source: Company Q4 2025/Q1 2026 earnings calls; CreditSights; Futurum Group; CNBC
The individual hyperscaler numbers reveal just how uniformly aggressive this spending cycle has become across every major player, not just one or two front-runners. Amazon’s jump to $200 billion represents the single largest annual capital expenditure plan ever announced by any company in any industry, and CEO Andy Jassy specifically tied that figure to a $244 billion contracted revenue backlog — a 40% year-over-year increase — meaning much of this spending is racing to catch up with demand that customers have already committed to paying for, rather than speculative capacity building. Alphabet’s near-doubling to $175–185 billion is similarly demand-driven, with Google Cloud reporting revenue growth north of 80% in recent quarters that management says still can’t be served fast enough given current infrastructure.
Microsoft, by contrast, shows the most restrained percentage increase among the Big Five at roughly 22–33%, yet even that modest-by-comparison growth rate takes the company’s already massive base past $110–120 billion, with CFO commentary specifically citing an $80 billion backlog of unfulfilled Azure orders that the company simply cannot deliver against existing power-constrained capacity. Investors have not universally cheered this spending: shares of Google, Amazon, and Microsoft all sold off following earnings calls where these 2026 capex figures were disclosed, reflecting genuine skepticism about near-term returns even as management teams project confidence that the infrastructure will eventually pay for itself through AI service revenue.
Project Stargate Investment Statistics in the US 2026
Project Stargate — Committed Investment vs Target ($ Billions)
Committed to date (2026)   ███████████████ $400B+
Full program target        ███████████████████ $500B
| Stargate Metric | Data |
|---|---|
| Total program target | $500 billion over four years (announced January 2025) |
| Investment committed as of mid-2026 | Over $400 billion, ahead of original schedule |
| Target compute capacity | 10 gigawatts by 2029 |
| Current operational capacity (Abilene, Texas) | 0.3–1.2 gigawatts, with 450,000+ NVIDIA GB200 GPUs |
| Number of active US construction sites | Seven, spanning Texas, Ohio, New Mexico, Michigan, Wisconsin, and other states |
| Michigan campus investment (Saline Township) | $16 billion, groundbreaking held June 2026 |
| Oracle-OpenAI cloud computing contract | $300 billion over five years, beginning 2027 |
| NVIDIA’s investment commitment to OpenAI | Up to $100 billion, tied to chip supply agreements |
| Estimated onsite construction jobs created | 25,000+, per the initial five-site expansion announcement |
| Founding equity partners | OpenAI, SoftBank, Oracle, and Abu Dhabi’s MGX |
Source: OpenAI; Reuters; Data Center Dynamics; Epoch AI; CNBC
Project Stargate’s scale becomes clearer when broken into its individual site investments rather than viewed only as a single $500 billion headline figure. The $16 billion Michigan campus in Saline Township, developed by Related Digital for Oracle and OpenAI, is itself larger than most entire corporate data center portfolios built before the AI boom began, and it represents just one of seven active sites. The flagship Abilene, Texas campus — the most advanced site in the program — already houses an estimated 450,000 NVIDIA GB200-equivalent GPUs and has become something of a proof point for the entire initiative, with Oracle executives describing it as “not a data center in any traditional sense” but rather a purpose-built computing instrument.
The financial architecture underpinning Stargate extends well beyond the headline $500 billion figure: the separate $300 billion, five-year Oracle-OpenAI cloud computing contract, beginning in 2027, effectively locks in a revenue stream that helps justify the infrastructure spend, while NVIDIA’s up-to-$100-billion investment commitment to OpenAI ties chip supply directly to the financing structure in a way rarely seen in prior technology cycles. Critics have raised concerns about the durability of the jobs this investment creates — Bloomberg reporting cited in industry analysis estimated only around 57 ongoing permanent workers at the Abilene site despite the enormous capital outlay — a tension between headline investment figures and lasting local economic impact that mirrors the broader debate around Data Center Jobs Statistics in US, where the national data shows a similarly stark gap between capital deployed and permanent employment generated.
Data Center Construction Spending Statistics in the US 2026
US Data Center Construction Starts, 2023-2026 (USD Billions)
2023                  ████ $14.9B
2024                  ███████ $26.9B
2025                  █████████████████ $77.7B
2026 (Q1 annualized)  ███████████████████████████ ~$178.8B pace
| Construction Metric | Data |
|---|---|
| US data center construction starts, 2023 | $14.9 billion |
| US data center construction starts, 2024 | $26.9 billion |
| US data center construction starts, 2025 | $77.7 billion, a 190% year-over-year increase |
| 4-year compound annual growth rate (2021–2025) | Approximately 98% |
| Year-to-date spending through April 2026 | $49.5 billion, versus $13.6 billion in the same period 2025 |
| Q1 2026 construction spending alone | $44.7 billion |
| Monthly construction spending rate, December 2025 | $45.1 billion, up 85% from two years prior |
| Data center IT capacity currently under construction | More than 23 gigawatts globally, per BloombergNEF |
| Cost per square foot, 2026 estimate | Approximately $488 per square foot |
Source: American Industrial Magazine; BloombergNEF; Programs.com
The trajectory of raw construction spending is arguably the most direct, least speculative measure of the AI infrastructure boom, since it reflects money already contractually committed to concrete, steel, and site work rather than forward-looking guidance. The jump from $14.9 billion in 2023 to $77.7 billion in 2025 represents one of the steepest sector-specific construction growth curves ever recorded in US Census Bureau data, and the pace has only intensified into 2026: year-to-date spending through April reached $49.5 billion, compared with just $13.6 billion over the same months a year earlier — nearly four times the prior pace.
BloombergNEF’s finding that data center IT capacity under construction now tops 23 gigawatts globally puts a physical unit behind these dollar figures, and it helps explain why cost per square foot has climbed toward an estimated $488 in 2026 — as developers compete for the same limited pool of specialized contractors, cooling equipment, and grid-interconnection capacity simultaneously. Unlike the more volatile capex guidance hyperscalers issue on quarterly earnings calls, construction-start data reflects money that has already broken ground, making it one of the more reliable leading indicators for how much actual physical AI infrastructure will exist by the time these projects come online in 2027 and 2028.
AI Chip and Hardware Investment Statistics in the US 2026
Where AI Infrastructure Dollars Flow (Approximate share of $450B AI capex)
GPUs/AI Accelerators      ████████████████████████████ ~55-60%
Data Center Shells/Power  ████████████ ~20-25%
Networking/Other          ████████ ~15-20%
| Hardware Investment Metric | Data |
|---|---|
| NVIDIA’s share of AI accelerator spending | Approximately 80–90% of the AI accelerator market by revenue |
| NVIDIA Q1 FY2027 data center revenue (ended April 2026) | $75.2 billion, up 92% year-over-year |
| NVIDIA data center revenue as share of total revenue | Over 80% |
| NVIDIA’s CoWoS wafer allocation for 2026 | 595,000 wafers, roughly 60% of global CoWoS demand |
| Global semiconductor industry sales, 2025 | $791.7 billion, up 25.6% year-over-year |
| Logic chips (includes AI accelerators) sales, 2025 | $301.9 billion, up 39.9% |
| AMD data center revenue, Q1 2026 | $5.8 billion, up 57% year-over-year |
| AMD-OpenAI multi-year GPU partnership | 6-gigawatt commitment announced November 2025 |
| Average cost of an AI server rack in 2026 | $3.9 million, roughly 7.8x the cost of a traditional rack |
Source: NVIDIA SEC filings; Semiconductor Industry Association; AMD earnings releases; Programs.com
Nearly every dollar of hyperscaler infrastructure spending eventually flows through a remarkably concentrated hardware supply chain, and NVIDIA’s position at the center of that flow is difficult to overstate. The company’s $75.2 billion in data center revenue for the quarter ended April 2026 — a 92% year-over-year increase — makes NVIDIA’s single-quarter data center business larger than the full-year revenue of most publicly traded technology companies, and it captures the overwhelming majority of the capital that hyperscalers are calling “AI infrastructure spending” in their own earnings disclosures. NVIDIA’s reservation of 595,000 CoWoS packaging wafers for 2026 — roughly 60% of the entire world’s supply of this critical advanced packaging technology — illustrates how thoroughly a single company’s investment decisions can constrain the pace at which the rest of the industry can build.
The $3.9 million average cost of an AI server rack, roughly 7.8 times the price of a traditional enterprise server rack, helps explain why data center investment figures have scaled so much faster than data center square footage: modern AI infrastructure spending is buying dramatically more expensive, power-dense equipment per unit of physical space than the cloud buildouts of the previous decade. With AMD’s data center revenue also climbing 57% and its own six-gigawatt commitment from OpenAI signaling a genuine, if smaller, second source of AI compute supply, the hardware investment story in 2026 remains one of extraordinary demand concentrated among a handful of chip designers and their sole advanced manufacturing partner, a dynamic explored in more depth in the AI Chip Statistics report, which breaks down the full semiconductor supply chain behind this spending.
Data Center Debt Financing and Investor Sentiment Statistics in the US 2026
| Financing / Sentiment Metric | Data |
|---|---|
| Hyperscaler debt raised in 2025 to fund AI buildout | $108 billion |
| Projected total debt issuance for AI infrastructure (coming years) | Up to $1.5 trillion |
| Capital intensity, hyperscalers, as % of revenue | 45% to 57% |
| Alphabet free cash flow trend, 2026 | Turned negative amid capex surge, per Q2 2026 CFA analysis |
| Microsoft remaining performance obligations (RPO) | $678 billion as of Q2 2026 earnings |
| Investor reaction to 2026 capex guidance | Shares of Google, Amazon, and Microsoft sold off following disclosures |
| Goldman Sachs projected combined hyperscaler capex, 2025–2027 | $1.15 trillion |
| Utility sector capital plan through 2030, tied partly to data center demand | $1.4 trillion, up 27% from the prior year’s projection |
Source: Goldman Sachs Research; CreditSights; company earnings calls; American Industrial Magazine
The financing side of this investment cycle is where the most genuine uncertainty lives. Hyperscalers raising $108 billion in debt in 2025 alone — with projections running as high as $1.5 trillion over the coming years — marks a structural break from how these companies have historically funded growth, since Amazon, Google, Microsoft, and Meta have traditionally been viewed as cash-rich businesses with little need for external financing. Alphabet’s free cash flow turning negative in 2026, even as Google Cloud revenue grew more than 80%, illustrates just how far current spending has outpaced even rapidly growing operating cash flow, and Microsoft’s $678 billion remaining performance obligations figure shows a company with an enormous contracted revenue pipeline still choosing to fund current infrastructure through debt rather than waiting for that revenue to materialize.
Wall Street’s response has been genuinely mixed rather than uniformly bullish: share price declines following capex disclosures from Google, Amazon, and Microsoft reflect real investor concern about whether AI service revenue will scale quickly enough to justify spending at 45% to 57% of revenue — levels that would be considered alarming capital intensity for almost any other technology business. At the same time, the ripple effects extend well beyond the technology sector itself: America’s investor-owned utilities have unveiled a $1.4 trillion capital plan through 2030, up 27% from the prior year’s projection, driven substantially by the need to serve the electricity demand this same wave of data center investment is creating — a dynamic covered in detail in the AI Data Center Statistics in US report, which tracks the power and grid side of this same investment story.
Regional Data Center Investment Statistics in the US 2026
| State / Region | Notable Announced Investment |
|---|---|
| Texas | Stargate flagship site (Abilene), Milam County SB Energy campus; ERCOT deregulated grid draws heavy investment |
| Ohio | Meta’s Prometheus gigawatt-scale facility (New Albany); SoftBank/Foxconn modular fabrication plant (Lordstown) |
| Michigan | $16 billion Stargate campus, Saline Township, groundbreaking June 2026 |
| Wisconsin | $3.3 billion Microsoft campus, positioned as one of the world’s most powerful AI facilities |
| Indiana | $11 billion AWS AI infrastructure expansion |
| Louisiana | Meta’s Hyperion project, requiring an estimated 5+ gigawatts of power |
| New Mexico | Stargate site in Doña Ana County, part of the Oracle-OpenAI five-site expansion |
| Virginia | Largest existing concentration of US data centers; continues to draw new capex despite grid capacity constraints |
Source: OpenAI; CNBC; Data Center Dynamics; company announcements
The geographic spread of 2026 data center investment shows developers actively moving beyond the traditional hubs of Northern Virginia and Silicon Valley toward states offering cheaper land, more available grid interconnection capacity, and friendlier permitting environments. Texas has emerged as the clearest beneficiary of this shift, hosting both the flagship Stargate campus and additional SoftBank-backed sites, aided by ERCOT’s deregulated electricity market and abundant wind generation capacity that can be paired with new data center load. Ohio, Michigan, and Wisconsin — states with legacy manufacturing infrastructure and, in some cases, available industrial sites like the former Lordstown auto plant — have similarly attracted multi-billion-dollar single-site investments that would have been unthinkable for these regions just five years ago.
This dispersion carries real economic-development stakes for the states involved, even as questions persist about how many permanent jobs each investment ultimately delivers locally. Louisiana’s Hyperion project alone is expected to require more than 5 gigawatts of power — roughly three times the entire city of New Orleans’ electricity consumption — illustrating how a single investment decision by one hyperscaler can reshape the electricity planning assumptions of an entire state’s utility sector for years to come.
Disclaimer: The data research report we present here is based on information found from various sources. We are not liable for any financial loss, errors, or damages of any kind that may result from the use of the information herein. We acknowledge that though we try to report accurately, we cannot verify the absolute facts of everything that has been represented.