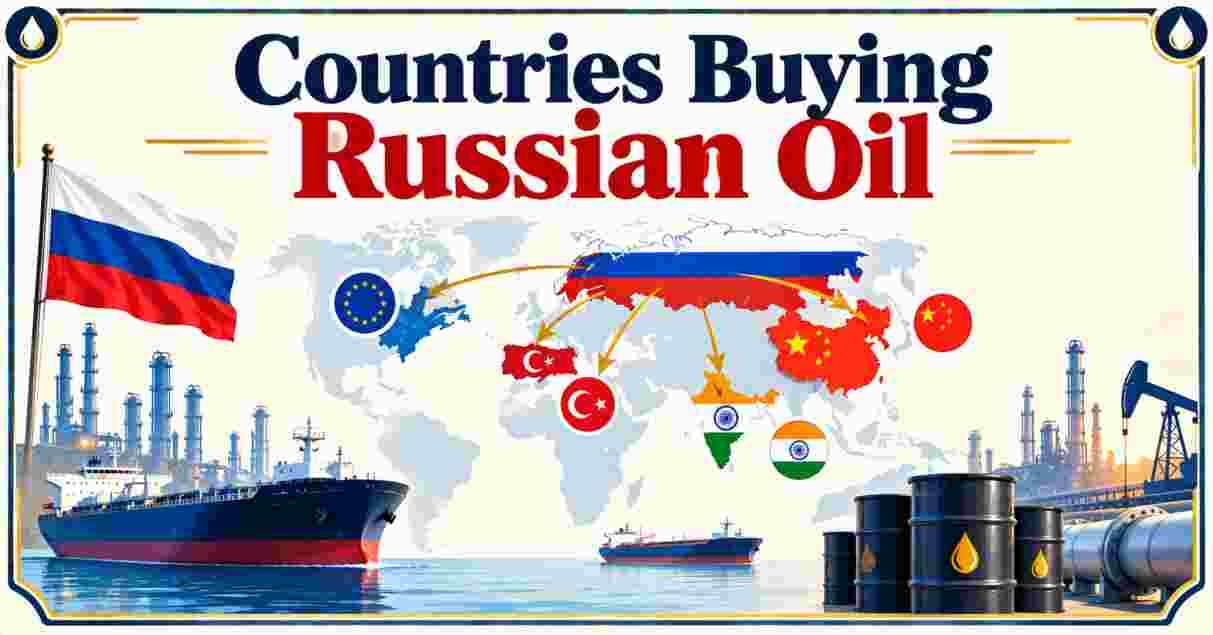
China and India remain the top two buyers of Russian oil in 2026, together purchasing 87% of Russia’s crude exports, while Russia’s fossil fuel export revenue fell to EUR 604 million per day in August 2026, an 8% month-on-month decline. On September 17, 2026, the US Congress passed the Lindsey O Graham Sanctioning Russia Act of 2026, giving the president authority to impose tariffs of up to 100% on the top five purchasers of Russian energy.
Countries Buying Russian Oil
Countries Buying Russian Oil refers to the nations that continue importing Russian crude, refined oil products, liquefied natural gas, and pipeline gas despite Western sanctions imposed after Russia’s full-scale invasion of Ukraine in February 2022. Since the European Union’s boycott of most Russian seaborne oil took effect in January 2023, the flow of Russian crude has shifted dramatically away from Europe toward Asia, with China, India, and Turkiye emerging as the dominant replacement buyers. The Centre for Research on Energy and Clean Air (CREA), a Finland-based independent research organization, tracks this trade monthly through tanker movements, port data, and pricing analysis, providing the most detailed public accounting of who is funding Russia’s war chest through energy purchases.
The dynamics behind Countries Buying Russian Oil in 2026 have grown more complicated than a simple sanctions-evasion story. Russia’s own refining capacity has been battered by sustained Ukrainian drone strikes throughout the year, forcing the country, once the world’s largest oil product exporter, to start importing gasoline and diesel from India, South Korea, and Turkiye to cover domestic fuel shortages. At the same time, the Strait of Hormuz crisis stemming from the US-Israel conflict with Iran has driven global energy prices higher, boosting Russia’s export revenues by an estimated EUR 31 billion over six months even as sanctions pressure has intensified. Understanding this topic in 2026 means tracking not just who buys Russian oil, but how a wartime energy market reshaped by multiple overlapping crises is affecting the volumes, prices, and politics involved.
Interesting Facts About Countries Buying Russian Oil in 2026
| Fact | Detail |
|---|---|
| China’s Share of Russian Crude Exports (Since Dec 2022) | 50% |
| India’s Share of Russian Crude Exports (Since Dec 2022) | 37% |
| Russia’s Daily Fossil Fuel Export Revenue (August 2026) | EUR 604 million, down 8% month-on-month |
| Urals Crude Price vs. Price Cap (August 2026) | $69.9/barrel vs. $44.1/barrel cap |
| Share of Russian Oil on Sanctioned ‘Shadow’ Tankers | 52% (August 2026) |
| New US Sanctions Law | Lindsey O Graham Sanctioning Russia Act, passed Sept 17, 2026 |
| Maximum Tariff on Top 5 Russian Energy Buyers | Up to 100% |
| Russia’s Oil Product Imports (August 2026) | 172,000 tonnes, 7x the prior monthly high |
The scale and character of Countries Buying Russian Oil in 2026 reflect a war economy under mounting strain on multiple fronts simultaneously. China alone accounted for 51% (EUR 8.4 billion) of Russia’s fossil fuel export revenue among the top five importers in August 2026, with its seaborne crude imports up 16% month-on-month and 62% higher than August 2025, driven substantially by a sanctioned refinery, Shandong Yulong Petrochemical, that increased its Russian crude imports by 141% in a single month. India followed as the second-largest buyer, importing EUR 4.8 billion in Russian hydrocarbons that same month, though its purchases actually fell 24% from the prior month after two consecutive months of record-high imports.
Perhaps the most striking 2026 development is Russia’s reversal from top oil-product exporter to fuel importer. Sustained Ukrainian drone strikes on Russian refineries, including a nine-day shutdown of the Novorossiysk export terminal, the longest disruption since the full-scale invasion began, pushed Russia to import 172,000 tonnes of oil products in August alone, more than seven times the previous post-invasion monthly high. Some of that fuel came from India’s Nayara Energy refinery, which is 49.13% owned by Rosneft, meaning Russia is effectively paying a refinery it partly owns to process its own crude into fuel before shipping it back around the world, a level of forced-workaround logistics unimaginable before the war.
Top Countries Buying Russian Oil 2026
Share of Russian Crude Oil Exports Since December 2022
China      █████████████████████████████████████████████  50%
India      █████████████████████████████████░░░░░░░░░░░░  37%
Turkiye    █████░░░░░░░░░░░░░░░░░░░░░░░░░░░░░░░░░░░░░░░░░  5%
EU         █████░░░░░░░░░░░░░░░░░░░░░░░░░░░░░░░░░░░░░░░░░  5%
           0%        20%        40%        60%
| Country/Bloc | Share of Russian Crude Exports (Since Dec 2022) |
|---|---|
| China | 50% |
| India | 37% |
| Turkiye | 5% |
| European Union | 5% |
| Combined China + India | 87% |
Source: Centre for Research on Energy and Clean Air (CREA), August 2026 Monthly Analysis of Russian Fossil Fuel Exports
Since the EU’s sanctions on Russian seaborne oil took full effect, China and India have absorbed 87% of all Russian crude exports between them, according to CREA’s cumulative tracking that runs from December 5, 2022, through the end of August 2026. China alone has purchased 50% of Russia’s crude exports over that period, while India has taken 37%, leaving Turkiye and the EU to split most of the remainder at roughly 5% each. This concentration among just two Asian buyers represents one of the starkest reroutings of a major global commodity flow in modern trading history, transforming what had been a Europe-centered oil relationship into an overwhelmingly Asia-centered one within roughly three years.
The composition of buyers differs meaningfully by product category rather than being uniform across all Russian fossil fuel exports. Turkiye leads specifically in oil products, purchasing 26% of Russia’s refined fuel exports, while the EU remains the largest buyer of Russian LNG (49%) and pipeline gas (32%), categories that have faced less complete sanctioning than crude oil and oil products. China ranks second in nearly every category: 12% of oil products, 24% of LNG, and 31% of pipeline gas, reflecting a buyer that has diversified its Russian energy purchases across essentially every available commodity type rather than concentrating solely on crude.
China’s Russian Oil Imports Statistics 2026
China's Russian Fossil Fuel Purchases — August 2026
Total (EUR 8.4bn)      ███████████████████████████████  100%
Crude Oil (70%)        ██████████████████████░░░░░░░░░  EUR 5.8bn
Pipeline Gas           ███░░░░░░░░░░░░░░░░░░░░░░░░░░░░  EUR 777mn
LNG                    ███░░░░░░░░░░░░░░░░░░░░░░░░░░░░  EUR 682mn
Coal                   ███░░░░░░░░░░░░░░░░░░░░░░░░░░░░  EUR 682mn
| Metric | Value |
|---|---|
| China’s Total Russian Fossil Fuel Imports (Aug 2026) | EUR 8.4 billion |
| China’s Share of Top-5 Buyer Revenue | 51% |
| Crude Oil Import Growth (Month-on-Month) | +16% |
| Crude Oil Import Growth (Year-on-Year) | +62% |
| Russia’s Share of China’s Seaborne Crude (Aug 2026) | 23%, up from 9% a year earlier |
Source: Centre for Research on Energy and Clean Air (CREA), August 2026 Monthly Analysis
China remained the single largest buyer of Russian fossil fuels in August 2026, spending EUR 8.4 billion, or 51% of the revenue Russia collected from its top five importers that month. Crude oil made up 70% (EUR 5.8 billion) of China’s purchases, with unloadings rising 16% month-on-month and 62% above August 2025 levels. Russia’s share of China’s total seaborne crude imports climbed to 23%, up sharply from just 9% a year earlier, showing that Chinese refiners have steadily deepened their reliance on discounted Russian barrels rather than reducing exposure under sanctions pressure.
A significant share of this growth traces to specific sanctioned entities rather than the Chinese market broadly. Shandong Yulong Petrochemical, a refiner sanctioned by both the EU and UK, drove much of August’s increase, with its Russian crude imports rising 141% month-on-month, while imports at the port of Yantai rose 83%. China also benefits from a structural advantage unavailable to India: a portion of its Russian crude arrives via the East Siberia-Pacific Ocean (ESPO) pipeline, an overland route immune to the maritime disruptions and Strait of Hormuz tensions affecting seaborne shipments elsewhere in the region. For broader context on how energy costs and trade flows factor into the US trade relationship with major economies, the report on US trade deficit by country statistics covers related patterns in bilateral trade imbalances.
India’s Russian Oil Imports Statistics 2026
India's Monthly Russian Crude Imports (Barrels per Day)
Jan 2026     ██████████████████░░░░░░░░░░░░░░░░  1.1 million
2025 Avg     ████████████████████████████░░░░░░  1.7 million
June-July    ██████████████████████████████████  Record highs
Aug 2026     ████████████████████████████░░░░░░  -24% from peak
             0        0.5M       1.0M       1.5M       2.0M
| Metric | Value |
|---|---|
| India’s Total Russian Fossil Fuel Imports (Aug 2026) | EUR 4.8 billion |
| Crude Oil Share of India’s Purchases | 87% (EUR 4.1 billion) |
| India’s Crude Imports from Russia (Jan 2026) | 1.1 million bpd, lowest since Nov 2022 |
| 2025 Average Daily Import Rate | 1.7 million bpd |
| August 2026 Change | -24% after two consecutive record months |
Source: Centre for Research on Energy and Clean Air (CREA); International Energy Agency tanker-tracking data
India was the second-largest buyer of Russian fossil fuels in August 2026, importing EUR 4.8 billion in total hydrocarbons, of which crude oil made up 87% (EUR 4.1 billion). India’s Russian crude imports have shown more volatility than China’s over the course of the year: they fell to just 1.1 million barrels per day in January 2026, the lowest level since November 2022, down from a 2025 average of 1.7 million bpd, before surging to record highs in both June and July 2026, then pulling back 24% in August. The three largest Indian refiners processing Russian crude, Jamnagar, Vadinar, and Paradip, showed mixed patterns that month, with Jamnagar falling 15%, Vadinar rising 5%, and Paradip up a modest 1%.
India’s position has drawn particular international attention because of its refinery Nayara Energy, which is 49.13% owned by Rosneft, Russia’s state oil company, and which has been sanctioned by the EU. In a striking illustration of Russia’s 2026 fuel crisis, Nayara’s Vadinar refinery, which took 100% of its crude from Russia in the first eight months of 2026, has been supplying gasoline back to Russia itself, refined from Russian crude and shipped through a ship-to-ship transfer off Egypt before unloading at Russia’s Arctic port. The International Energy Agency has separately warned that India’s rising reliance on crude imports overall carries “major implications” for its energy security, a concern that has grown more acute as new US sanctions specifically target major Russian oil purchasers.
Russian Oil Revenue and Export Statistics 2026
Russia's Daily Fossil Fuel Export Revenue (2026)
July 2026     ███████████████████████████  EUR 657mn/day (est.)
August 2026   ███████████████████████░░░░  EUR 604mn/day (-8%)
| Metric | Value |
|---|---|
| Russia’s Daily Export Revenue (Aug 2026) | EUR 604 million, -8% month-on-month |
| Crude Oil Export Revenue (Aug 2026) | EUR 350 million/day, -9% month-on-month |
| Urals Crude Price (Aug 2026) | $69.9/barrel, +23% month-on-month |
| EU/UK Price Cap | $44.1/barrel |
| Hormuz Crisis Revenue Boost (6 months) | EUR 31 billion |
Source: Centre for Research on Energy and Clean Air (CREA), August 2026 Monthly Analysis
Russia’s fossil fuel export revenues fell to EUR 604 million per day in August 2026, an 8% decline from July, with export volumes also down 7%. Crude oil revenue fell 9% to EUR 350 million per day, driven substantially by a 58% month-on-month drop in loadings at the Novorossiysk terminal after Ukrainian drone attacks disrupted operations there for nine consecutive days, the longest such disruption since the war began. Despite this operational disruption, the average price of Russia’s benchmark Urals crude actually rose 23% month-on-month to $69.9 per barrel, far above the $44.1 per barrel price cap that the EU and UK have set and frozen in place as part of their sanctions regime.
The gap between the price cap and the actual selling price of Russian crude illustrates one of the persistent weaknesses in the current sanctions structure, one that CREA has specifically flagged in its policy recommendations. Compounding this, the Strait of Hormuz crisis, triggered by the ongoing US-Israel conflict with Iran, has pushed global energy prices broadly higher throughout 2026, and CREA estimates this has boosted Russia’s seaborne oil and gas export revenues by approximately EUR 31 billion over the six months following the initial US-Israel strikes, a substantial offsetting benefit to Moscow even as direct sanctions pressure has simultaneously intensified.
New US Sanctions Legislation on Russian Oil Buyers 2026
Lindsey O Graham Sanctioning Russia Act of 2026 — Key Provisions
Passed House                    ████████████████████████████  Sept 17, 2026
Tariffs on Top 5 Energy Buyers  ██████████████████████████░░  Up to 100%
Tariffs on Direct RU Imports    ████████████████████████████  Up to 500%
US Imports from Russia (2025)   ████░░░░░░░░░░░░░░░░░░░░░░░░  $3.8 billion
| Provision | Detail |
|---|---|
| Bill Name | Lindsey O Graham Sanctioning Russia Act of 2026 |
| Passed US House | September 17, 2026 |
| Max Tariff on Top 5 Russian Energy/Military Buyers | Up to 100% |
| Max Tariff on Direct Russian Imports to US | Up to 500% |
| US Goods Imports from Russia (2025) | $3.8 billion |
| Legal Authority Invoked | International Emergency Economic Powers Act (IEEPA) |
Source: Al Jazeera, US congressional reporting on the Lindsey O Graham Sanctioning Russia Act, September 17, 2026
The US Congress passed the Lindsey O Graham Sanctioning Russia Act of 2026 on September 17, 2026, sending it to President Trump for signature in what reporting describes as the most significant US action against Moscow since the start of his second term. Named after the late Senator Lindsey Graham, a longtime supporter of Ukraine who died in July 2026, the bill grants the president authority under the International Emergency Economic Powers Act to impose sanctions on more than 20 top Russian officials and defense-linked companies, target Russia’s sanctioned “shadow fleet” of oil tankers, and apply tariffs of up to 100% on exports to the US from the top five purchasers of Russian energy or military equipment. The legislation also permits tariffs of up to 500% on goods imported directly from Russia, though US imports from Russia totaled only $3.8 billion in 2025, making the indirect tariff provision targeting China and India’s own US-bound exports the more consequential mechanism.
Reactions from the two most exposed countries diverged sharply. India’s Ministry of External Affairs stated it had “very clearly articulated” the potential implications for bilateral relations and said it would “take all necessary measures to protect its trade and economic interests,” while a Chinese Foreign Ministry spokesperson called the legislation’s extraterritorial jurisdiction unauthorized by the UN Security Council and said Beijing’s energy trade “is not directed against third parties.” Importantly, the bill gives the president discretionary authority rather than an automatic trigger, meaning the tariffs’ actual imposition and severity remain an open political decision rather than a fixed, immediate outcome as of the law’s passage.
Russian Oil Production Statistics 2026
Russia Crude Oil Production vs. OPEC+ Quota (Mid-2026)
June 2026 Production   █████████████████████░░░░  8.928 million bpd
June 2026 Quota        █████████████████████████  9.762 million bpd
July 2026 Production   ████████████████████░░░░░  8.887 million bpd
July 2026 Quota        █████████████████████████░  9.824 million bpd
| Metric | Value |
|---|---|
| Crude-Only Production (July 2026) | 8.887 million bpd |
| OPEC+ Quota (July 2026) | 9.824 million bpd |
| Production Shortfall vs. Quota | ~937,000 bpd below target |
| Total Liquids Production (2025) | ~10.53 million bpd |
| Oil & Gas Share of Russian GDP (2024) | 10.7% |
Source: OPEC Monthly Oil Market Report; Bloomberg; Worldometer, 2026
Russia’s crude-only oil production averaged 8.887 million barrels per day in July 2026, according to OPEC’s monthly report, running nearly 937,000 barrels per day below its OPEC+ target of 9.824 million bpd for that month. This gap reflects a combination of voluntary OPEC+ output restraint and genuine operational strain from sustained Ukrainian strikes on Russian energy infrastructure, rather than production capacity constraints alone. Including natural gas plant liquids and condensates, Russia’s total liquids production reached approximately 10.53 million barrels per day in 2025, keeping it among the world’s top three oil producers alongside the United States and Saudi Arabia, even as its refining sector has come under unprecedented pressure.
That refining pressure has produced one of 2026’s more unusual energy market developments: Russia, historically the world’s largest oil-product exporter, was forced to import 172,000 tonnes of refined fuel in August 2026 alone, more than triple its entire 2025 import volume, and became a net exporter of gasoline only in the narrow technical sense that its own citizens faced domestic shortages severe enough to require imports from India and South Korea. Russian gasoline output reportedly dropped 70% relative to domestic demand in late August following repeated drone strikes, a scale of disruption to a top-three global oil producer’s domestic fuel supply that has no clear precedent in the post-2022 sanctions era.
Shadow Fleet and Sanctions Evasion Statistics 2026
How Russian Oil Is Transported (August 2026)
Sanctioned 'Shadow' Tankers   ████████████████░░░  52%
G7+ Owned/Insured Tankers     ██████████████░░░░░  42%
Non-Sanctioned 'Shadow'                             6%
| Metric | Value |
|---|---|
| Share of Seaborne Oil on Sanctioned Tankers | 52% |
| Share on G7+ Owned/Insured Tankers | 42% |
| Falsely Flagged Vessels (End of Aug 2026) | 45 |
| Largest ‘Shadow’ Fleet Flag (After Russia) | Cameroon |
| New Vessels Entering Russian Trade (Aug 2026) | 9 |
Source: Centre for Research on Energy and Clean Air (CREA), August 2026 Monthly Analysis; Equasis vessel registry data
More than half of Russia’s seaborne oil, 52% in August 2026, moved on sanctioned “shadow” tankers, vessels operating outside G7+ ownership and insurance frameworks specifically to circumvent the price cap and other restrictions. A further 42% traveled on G7+-owned or insured tankers, meaning those vessels’ compliance with the $44.1 price cap is nominally required but, as the persistent gap between the cap and actual Urals prices shows, imperfectly enforced. At the end of August, 45 vessels were identified as flying false flags, with 31% of them having carried both Russian and Iranian oil at different points, suggesting a shared sanctions-evasion infrastructure serving both sanctioned trades interchangeably.
Flag-registry fraud has emerged as a specific enforcement battleground in 2026: Cameroon became the largest flag for Russian shadow-fleet vessels after Russia’s own registry, but investigators discovered that many vessels claiming Cameroonian registration had been fraudulently registered by an unauthorized body hijacking the country’s name. Cameroon’s government has since worked to strike these vessels from its rolls, removing 26 in July and 11 more in August, cutting the fraudulent count from 140 in February to 83 by month’s end. Separately, EU naval forces operating under Operation IRINI boarded a suspected shadow-fleet tanker in the Mediterranean in late August, the sixth such vessel intercepted by EU naval operations in recent months, reflecting a modest escalation in physical enforcement alongside the financial and regulatory sanctions described elsewhere in this report.
Turkiye, EU, and Other Buyers of Russian Oil 2026
Selected Buyers of Russian Fossil Fuels — August 2026
China        ███████████████████████████████████  EUR 8.4bn
India        ██████████████████████░░░░░░░░░░░░░  EUR 4.8bn
Turkiye      ███████░░░░░░░░░░░░░░░░░░░░░░░░░░░░  EUR 1.5bn
EU (5 buyers)███████░░░░░░░░░░░░░░░░░░░░░░░░░░░░  EUR 1.2bn (top 5 combined)
Egypt        ██████░░░░░░░░░░░░░░░░░░░░░░░░░░░░░  EUR 513mn
| Buyer | August 2026 Purchases | Primary Commodity |
|---|---|---|
| Turkiye | EUR 1.5 billion | Pipeline gas (34%), crude oil (32%) |
| Egypt | EUR 513 million | Crude and oil products |
| Hungary (largest EU buyer) | EUR 386 million | 100% pipeline gas |
| Slovakia | — | Crude and pipeline gas |
| France (LNG) | EUR 190 million | 100% LNG |
Source: Centre for Research on Energy and Clean Air (CREA), August 2026 Monthly Analysis
Turkiye was the third-largest buyer of Russian fossil fuels in August 2026, purchasing EUR 1.5 billion, with pipeline gas making up the largest share at 34% (EUR 493 million), followed by crude oil at 32% (EUR 467 million). Turkish oil-product imports from Russia actually fell 37% in August, the lowest monthly volume since mid-2022, even as the country’s overall Russian energy relationship deepened through pipeline gas. Egypt ranked fifth among global buyers, spending EUR 513 million despite a 29% month-on-month drop in volumes, while several EU member states continued importing Russian natural gas despite the bloc’s broader sanctions posture, with Hungary the largest EU buyer at EUR 386 million, entirely in pipeline gas, and Prime Minister Viktor Orbán previously vetoing a broader EU sanctions package over disruptions to Russian oil deliveries through the Druzhba pipeline.
This patchwork of continued European purchases, alongside 20 shipments of oil products refined from Russian crude that still reached EU ports in August despite an official ban, illustrates how incomplete the sanctions regime remains even among nominally aligned countries. Refineries in India, Turkiye, Brunei, and Georgia that process Russian crude exported EUR 510 million worth of oil products to sanctioning countries, including the US, EU, and Australia, in August 2026 alone, a practice regulators describe as a “refining loophole” that current rules have struggled to close. For readers tracking how this kind of sanctions evasion interacts with broader questions of international accountability, the report on International Criminal Court statistics covers related enforcement mechanisms operating alongside economic sanctions in the current conflict. Russia’s overall debt and credit position amid this sustained economic pressure is covered separately in the report on US credit rating history statistics, which offers comparative context on how sovereign financial standing is tracked during periods of sustained sanctions.
Frequently Asked Questions
Which countries buy the most Russian oil in 2026?
China and India are by far the largest buyers, together purchasing 87% of all Russian crude exports since December 2022, with China alone accounting for 50% and India for 37%.
How much money does Russia make from oil exports each day?
Russia’s total fossil fuel export revenue was EUR 604 million per day in August 2026, down 8% from the previous month, according to CREA.
What is the new US law targeting Russian oil buyers?
The Lindsey O Graham Sanctioning Russia Act of 2026, passed by Congress on September 17, 2026, allows the president to impose tariffs of up to 100% on the top five purchasers of Russian energy and up to 500% on direct Russian imports to the US.
Why is Russia importing oil products instead of just exporting them?
Sustained Ukrainian drone strikes have severely damaged Russian refining capacity, forcing the country to import 172,000 tonnes of oil products in August 2026 alone, over seven times its previous monthly high, to cover domestic fuel shortages.
Is India’s Nayara Energy refinery linked to Russia?
Yes. Nayara Energy, which supplied fuel back to Russia in 2026, is 49.13% owned by Rosneft, Russia’s state oil company, and has been sanctioned by the EU.
How much oil does Russia currently produce?
Russia’s crude-only production averaged 8.887 million barrels per day in July 2026, running below its OPEC+ quota of 9.824 million bpd, while total liquids production reached about 10.53 million bpd in 2025.
What percentage of Russian oil is transported by sanctioned tankers?
52% of Russia’s seaborne oil moved on sanctioned “shadow” tankers in August 2026, with a further 42% carried by G7+-owned or insured vessels.
Is Russian crude selling above the Western price cap?
Yes. Russia’s Urals crude averaged $69.9 per barrel in August 2026, well above the $44.1 per barrel price cap set by the EU and UK.
Does the European Union still buy any Russian energy?
Yes, primarily natural gas. The EU remains the largest global buyer of Russian LNG (49% of exports) and pipeline gas (32%), even as it has banned most Russian crude oil and oil products.
How did China and India respond to the new US sanctions bill?
India said it had raised the issue with US officials and would take “necessary measures to protect its trade and economic interests,” while China’s foreign ministry called the legislation’s extraterritorial reach unauthorized by the UN Security Council and defended its energy trade as normal economic cooperation.
Disclaimer: The data research report we present here is based on information found from various sources. We are not liable for any financial loss, errors, or damages of any kind that may result from the use of the information herein. We acknowledge that though we try to report accurately, we cannot verify the absolute facts of everything that has been represented.