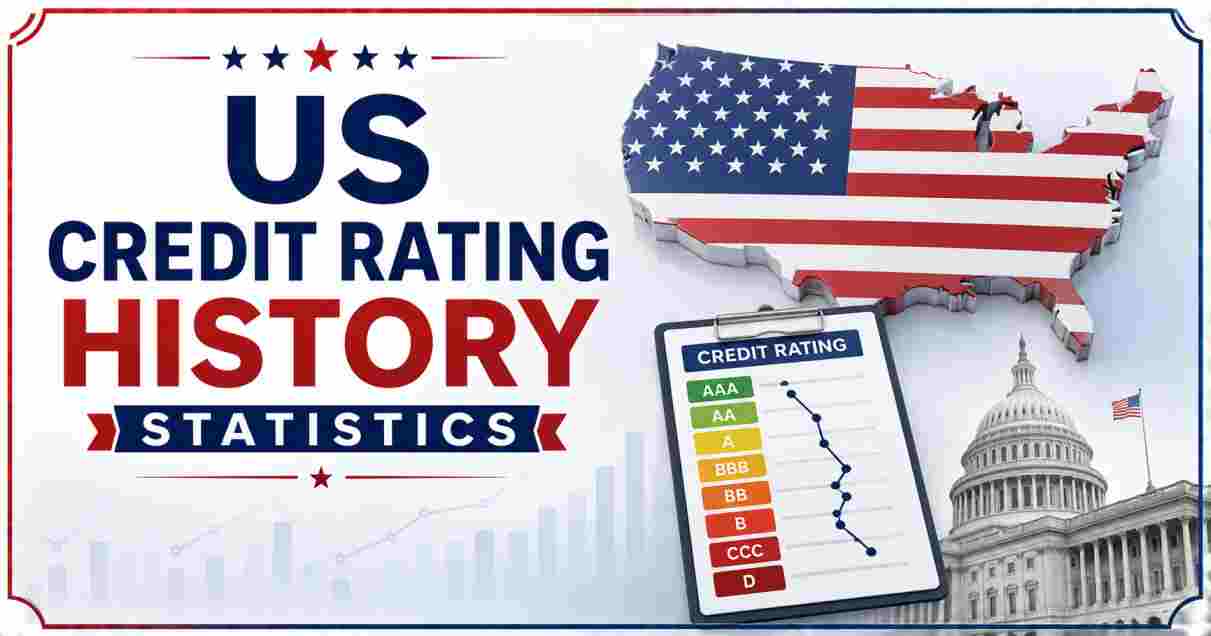
The United States has lost its top credit rating from all three major agencies: S&P cut it to AA+ in 2011, Fitch followed in 2023, and Moody’s downgraded it to Aa1 in May 2025. As of 2026, no major agency rates US sovereign debt at the top AAA/Aaa tier for the first time in over a century.
US Credit Rating History 2026
The US Credit Rating History is no longer a story about a country that never gets downgraded. For most of the 20th century, the United States sat at the top of every rating scale, a status that shaped how the entire bond market priced risk. That changed in 2011, and it changed twice more after that. Today, tracking the US Credit Rating History means tracking three separate downgrade decisions, three sets of agency reasoning, and a debt load that has grown past $38 trillion. Anyone researching sovereign credit risk in 2026 is looking at a fundamentally different picture than someone doing the same research in 2010.
This shift matters beyond financial headlines. A sovereign credit rating feeds directly into borrowing costs, mortgage pricing, corporate bond spreads, and how pension funds and foreign central banks allocate capital. When Standard & Poor’s, Fitch Ratings, and Moody’s each lowered their US ratings in separate years, they were responding to the same underlying pattern: rising debt, repeated debt ceiling standoffs, and a widening gap between what the government spends and what it collects. The sections below break down every major event in that timeline, the agencies behind each decision, and what the numbers say about where US credit standing goes from here.
Interesting Facts About US Credit Rating History 2026
| Fact | Data Point |
|---|---|
| First-ever S&P downgrade | August 5, 2011 — cut from AAA to AA+ |
| First-ever Fitch downgrade | August 1, 2023 — cut from AAA to AA+ |
| First-ever Moody’s downgrade | May 16, 2025 — cut from Aaa to Aa1 |
| Years Moody’s held a perfect rating | 108 years (since 1917) |
| Agencies currently rating the US below top tier | All 3 (S&P, Fitch, Moody’s) |
| Current gross national debt | Over $38.6 trillion |
| Current US debt-to-GDP ratio | Roughly 123% |
| 10-Year Treasury yield (Sept 2026) | Approximately 4.79%, highest since 2023 |
The table above captures the core numbers anyone searching US Credit Rating History 2026 needs first. Three separate downgrades across three separate agencies is not something that has happened to the United States before this current era — for over a century, at least one agency always held its highest grade on US debt. That streak ended completely in May 2025, closing a chapter that started in 1917.
What stands out is the compression of these events into a 14-year window. The 2011 downgrade came after a bruising debt ceiling fight. The 2023 downgrade came after another one. The 2025 downgrade came without a comparable political flashpoint, driven instead by the sheer trajectory of deficits and interest costs. Each agency reached the same conclusion through a slightly different path, and each decision pushed Treasury yields and borrowing costs a little higher.
US Credit Rating Downgrade Timeline 2026
Here is a simple representation of how each agency’s rating moved over time, expressed as a step down from the top tier:
S&P     AAA ████████████████████████ (1941–2011)
        AA+ ████████████████████     (2011–present)

Fitch   AAA ████████████████████████ (1994–2023)
        AA+ ████████████████████     (2023–present)

Moody's Aaa ████████████████████████ (1917–2025)
        Aa1 ████████████████████     (2025–present)
| Agency | Downgrade Date | Rating Before | Rating After |
|---|---|---|---|
| S&P Global Ratings | August 5, 2011 | AAA | AA+ |
| Fitch Ratings | August 1, 2023 | AAA | AA+ |
| Moody’s Ratings | May 16, 2025 | Aaa | Aa1 |
Source: Peter G. Peterson Foundation; Congressional Budget Office
Each of these three downgrades followed a similar script even though the specific triggers differed. S&P acted first in 2011, citing the weakened effectiveness and predictability of American policymaking after a debt ceiling standoff pushed the government close to default. Fitch followed twelve years later in 2023, pointing to high and rising debt, repeated last-minute political brinkmanship over the debt limit, and an absence of any credible plan to reverse the fiscal trend. Moody’s held out the longest, maintaining its perfect Aaa grade for over a century before finally moving in 2025.
The Moody’s downgrade in May 2025 carried extra symbolic weight because it removed the last perfect rating the United States held anywhere. Once that happened, the country lost its status as a triple-A borrower across the board for the first time since ratings agencies began evaluating sovereign debt this way. Moody’s cited an inability across successive administrations and Congresses to agree on measures that would reverse large annual deficits and rising interest costs, language that closely mirrors what S&P and Fitch had already said in their own downgrade statements years earlier.
Current US Sovereign Credit Ratings by Agency 2026
S&P Global   AA+  ▓▓▓▓▓▓▓▓▓▓▓▓▓▓▓▓▓▓  Stable
Fitch        AA+  ▓▓▓▓▓▓▓▓▓▓▓▓▓▓▓▓▓▓  Stable
Moody's      Aa1  ▓▓▓▓▓▓▓▓▓▓▓▓▓▓▓▓▓▓▓ Stable
| Agency | Current Rating | Outlook | Rank on Agency’s Scale |
|---|---|---|---|
| S&P Global Ratings | AA+ | Stable | 2nd tier (one notch below top) |
| Fitch Ratings | AA+ | Stable | 2nd tier (one notch below top) |
| Moody’s Ratings | Aa1 | Stable | 2nd tier (one notch below top) |
Source: S&P Global; Fitch Ratings; Moody’s Ratings public statements
All three agencies now place the United States one single notch below their respective top grades, and all three currently carry a stable outlook rather than a negative one. That stability signals the agencies do not expect an imminent further downgrade, even though each has flagged the same long-term risk: persistent deficits and a growing interest burden. Moody’s specifically pointed to the long history of effective, independent monetary policy from the Federal Reserve as one reason the US still deserves a rating close to the top of the scale despite its fiscal trajectory.
A stable outlook is different from a positive outlook or a return to AAA. It means the current AA+/Aa1 rating is not expected to move in the near term, not that the underlying fiscal picture has improved. Analysts commonly note that a negative outlook change usually precedes an actual downgrade by many months, so the fact that all three ratings currently sit at stable does not remove the possibility of a fourth downgrade if deficits keep widening at the pace CBO currently projects.
US National Debt Growth Statistics 2026
2000  $5.7T   ████
2010  $13.6T  ██████████
2020  $27.7T  ████████████████████
2024  $35.3T  ██████████████████████████
2026  $38.6T  █████████████████████████████
| Year | Gross National Debt | Debt-to-GDP Ratio |
|---|---|---|
| 2000 | $5.7 trillion | Roughly 55% |
| 2010 | $13.6 trillion | Roughly 90% |
| 2020 | $27.7 trillion | Roughly 100% |
| 2024 | $35.3 trillion | Roughly 120% |
| 2026 | $38.6 trillion | Roughly 123% |
Source: U.S. Treasury Fiscal Data; Congressional Budget Office
The pace of debt accumulation has accelerated sharply since 2000, when total gross debt sat at $5.7 trillion. It nearly tripled by 2020 and has grown by more than $10 trillion in just the years since, pushing the total past $38.6 trillion in early 2026. The debt-to-GDP ratio tells a similar story: it climbed from roughly 55% in 2000 to over 100% by 2020, a threshold economists often treat as a warning line for advanced economies.
The Congressional Budget Office projects federal debt held by the public will keep climbing, from around 101% of GDP in 2026 to 120% by 2036, a level that would exceed the previous historic high set at the end of World War II. Interest costs are a major driver of that trajectory rather than new program spending — net interest spending is projected to grow from about $1.0 trillion in 2026 to over $2.1 trillion by 2036. That rising interest bill, more than any single piece of legislation, is the pattern all three rating agencies have repeatedly flagged as their core concern.
US Debt Ceiling Crisis Statistics 2026
1960–2025  Debt limit raised or suspended  ███████████████████ 100+ times
2011 crisis  Near-default standoff           ██████████
2023 crisis  Near-default standoff           ██████████
| Debt Ceiling Event | Year | Outcome |
|---|---|---|
| Budget Control Act standoff | 2011 | Resolved days before default deadline; triggered S&P downgrade |
| Fiscal Responsibility Act standoff | 2023 | Resolved close to deadline; contributed to Fitch downgrade |
| Debt limit raises/suspensions since 1960 | 1960–2025 | Over 100 separate actions by Congress |
Source: U.S. Treasury Department; Congressional Research Service
The debt ceiling has been raised or suspended more than 100 times since 1960, and for most of that history the process barely made headlines. That changed in 2011 and again in 2023, when both parties in Congress pushed negotiations to the brink of the actual default deadline before reaching a resolution. Both agencies that downgraded the US around those events — S&P in 2011 and Fitch in 2023 — explicitly cited the brinkmanship itself as a factor, separate from the debt level alone.
What makes these two episodes different from the routine debt ceiling votes of prior decades is the closeness of the calls. Treasury officials in both years warned of a specific date on which the government would run out of extraordinary measures to keep paying its obligations, and lawmakers in both cases waited until days before that deadline to act. Rating agencies read that pattern as evidence of declining governance quality, a factor as important to their models as the debt figures themselves, and one that is much harder to reverse than a single year’s spending total.
Market Reaction to US Credit Downgrades 2026
2011 downgrade   S&P 500 drop over following week   ▓▓▓▓▓▓▓▓ -6.7%
2023 downgrade   S&P 500 drop over following week   ▓▓▓▓ -3.3%
2025 downgrade   S&P 500 drop over following week   ▓▓ -1.0%
| Downgrade Event | Stock Market Reaction | Treasury Yield Reaction |
|---|---|---|
| S&P downgrade (2011) | S&P 500 fell sharply in following sessions | 10-year yield initially fell on flight to safety |
| Fitch downgrade (2023) | S&P 500 declined moderately | 10-year yield rose toward multi-year highs |
| Moody’s downgrade (2025) | Markets largely stable | 10-year yield rose toward 4.47% in the following days |
Source: Federal Reserve Economic Data (FRED); market reporting compiled from major financial outlets
The market’s reaction to each downgrade tells its own story about how investors have adapted over time. The 2011 downgrade triggered the sharpest immediate reaction because it was unprecedented — nobody had a playbook for a downgraded US, and the S&P 500 sold off heavily even though Treasury yields paradoxically fell as investors still treated US debt as the safest available asset. By the time Fitch downgraded the US in 2023, the market treated the news with more composure, though yields moved higher rather than lower, reflecting genuine concern about fiscal capacity rather than a pure safety-driven reaction.
The 2025 Moody’s downgrade produced the calmest reaction of the three, in part because global financial institutions are structurally required to hold Treasuries regardless of rating, and in part because two prior downgrades had already conditioned markets to the idea that the US could lose top-tier status without triggering a crisis. Still, the 10-year Treasury yield climbed toward 4.47% in the days that followed, illustrating that even a “calm” downgrade still raises the government’s borrowing costs at the margin.
US Credit Rating Compared to Other AAA Nations 2026
Germany     AAA          ████████████████████████
Australia   AAA          ████████████████████████
Canada      AAA          ████████████████████████
Switzerland AAA          ████████████████████████
United States AA+ / Aa1  ████████████████████
| Country | S&P Rating | Moody’s Rating |
|---|---|---|
| Germany | AAA | Aaa |
| Canada | AAA | Aaa |
| Australia | AAA | Aaa |
| Switzerland | AAA | Aaa |
| United States | AA+ | Aa1 |
Source: S&P Global Ratings; Moody’s Ratings sovereign summaries
Germany, Canada, Australia, and Switzerland all continue to hold the top AAA/Aaa rating from both major agencies, placing the United States in an unusual position relative to several of its closest economic peers. This comparison matters for readers in Canada, the UK, and Australia specifically, since it shows the US is not simply following a universal global trend toward lower sovereign ratings — several large, developed economies have kept their top grade while the US has moved down a full notch across every agency.
The difference largely comes down to fiscal trajectory rather than absolute wealth or market size. Countries that retained their AAA rating generally run smaller structural deficits relative to GDP and have clearer paths to stabilizing their debt loads. The United States, by contrast, is projected by the CBO to see its deficit-to-GDP ratio widen rather than narrow over the next decade, which is precisely the pattern rating agencies use to distinguish a stable AAA credit from one that has already been downgraded.
US Federal Deficit and Interest Cost Statistics 2026
FY2026 total deficit         $1.9T   ████████████
FY2026 net interest spending $1.0T   ██████
FY2026 deficit as % of GDP   5.8%    ████████
| Metric | FY2026 Figure |
|---|---|
| Total federal deficit | $1.9 trillion |
| Deficit as share of GDP | 5.8% (vs. 3.8% 50-year average) |
| Net interest spending | Roughly $1.0 trillion |
| Average interest rate on marketable debt | 3.348% |
Source: Congressional Budget Office; U.S. Treasury monthly debt reports
The FY2026 deficit of $1.9 trillion equals 5.8% of GDP, well above the 3.8% average the country has run over the past fifty years. That gap between historical norms and current reality is exactly the pattern every downgrade statement from S&P, Fitch, and Moody’s has referenced. Interest spending alone — separate from any new program or tax decision — is now approaching $1.0 trillion annually and is projected to more than double within a decade as both the debt total and prevailing interest rates stay elevated.
This is the mechanism connecting a credit rating downgrade directly to household finances. As the average interest rate the government pays on its debt rises even slightly, from roughly 3.3% today toward higher levels, the dollar cost compounds across a debt base exceeding $38 trillion. That is billions of additional dollars in interest payments for every fractional percentage point increase, which is why analysts watching the US Credit Rating History treat interest cost trends as the single most important leading indicator for whether a fourth downgrade becomes likely.
None of this happens in isolation from the rest of the federal budget. Social Security, Medicare, and defense already account for the majority of mandatory spending, leaving relatively little room for lawmakers to close the gap without touching politically sensitive programs. Rating agencies factor that rigidity into their models directly, since a government that cannot easily adjust spending or revenue has fewer tools available if borrowing costs keep climbing. That structural constraint, more than any single year’s deficit number, is what keeps a fourth downgrade on the table for future review cycles.
Frequently Asked Questions About US Credit Rating History 2026
What is the current US credit rating in 2026?
The United States currently holds AA+ from both S&P Global Ratings and Fitch Ratings, and Aa1 from Moody’s Ratings. All three outlooks are listed as stable as of 2026.
When did the US lose its AAA credit rating?
The US first lost its AAA rating from S&P on August 5, 2011. It lost its AAA rating from Fitch on August 1, 2023, and lost its final perfect rating from Moody’s on May 16, 2025.
Why did S&P downgrade the US credit rating in 2011?
S&P cited weakening effectiveness, stability, and predictability of American policymaking and political institutions following a prolonged debt ceiling standoff, along with an insufficient plan to stabilize the government’s debt trajectory.
Why did Fitch downgrade the US in 2023?
Fitch pointed to the nation’s high and rising debt burden, repeated last-minute debt ceiling brinkmanship, and the absence of a credible medium-term plan to reverse the fiscal deterioration.
Why did Moody’s downgrade the US in 2025?
Moody’s downgraded the US because successive administrations and Congresses failed to agree on measures to reverse large annual fiscal deficits and growing interest costs, warning that fiscal performance would keep deteriorating relative to other highly-rated sovereigns.
Has the US ever had its credit rating fully restored to AAA?
No. As of 2026, none of the three major agencies have restored the US to its top rating following any of the three downgrades.
Which countries still have a perfect AAA credit rating?
Germany, Canada, Australia, and Switzerland are among the developed economies that continue to hold AAA/Aaa ratings from both S&P and Moody’s.
Does a US credit downgrade affect mortgage rates?
A downgrade itself does not set mortgage rates directly, but it can push Treasury yields higher, and mortgage rates are closely tied to the 10-year Treasury yield, which has trended upward alongside the downgrades.
What is the US national debt in 2026?
Gross national debt exceeds $38.6 trillion as of 2026, equal to roughly 123% of GDP.
Could the US face a fourth credit downgrade?
Analysts have not ruled it out. All three agencies continue to flag rising deficits and interest costs as ongoing risks, even with current outlooks listed as stable rather than negative, and each has said publicly that further deterioration in the fiscal trajectory could prompt another review in the coming budget cycles.
Disclaimer: The data research report we present here is based on information found from various sources. We are not liable for any financial loss, errors, or damages of any kind that may result from the use of the information herein. We acknowledge that though we try to report accurately, we cannot verify the absolute facts of everything that has been represented.