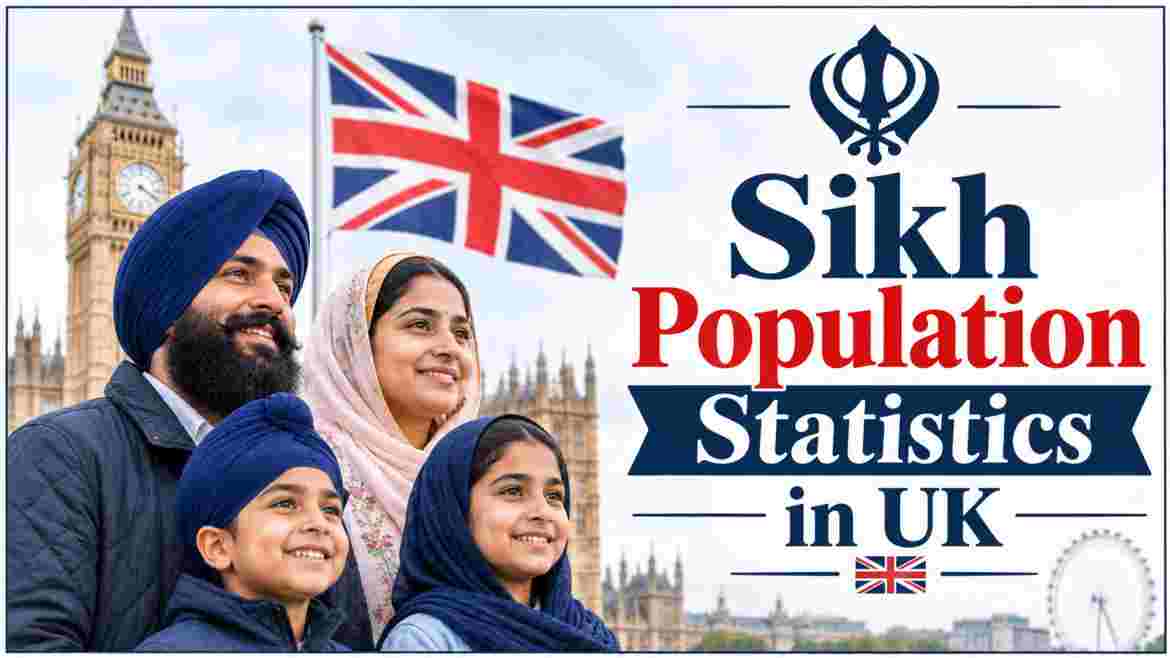
Sikh Population Statistics in UK 2026: The 2021 and 2022 censuses counted 535,517 Sikhs in the United Kingdom, or 0.79% of the population, making Sikhs the country’s fourth-largest religious group. The West Midlands holds the most Sikhs at 172,398, or 2.9% of the region, and Wolverhampton has the highest local share at 12.0%.
Sikh Population in UK 2026 – Introduction
Sikh Population Statistics in UK rest on three census counts. England and Wales recorded 524,140 Sikhs in 2021, Northern Ireland recorded 389 in 2021, and Scotland recorded 10,988 in 2022. Together that makes 535,517 Sikhs, or 0.79% of the UK population and roughly 2% of the world’s Sikhs. The community grew 23.8% from the 432,429 counted in 2011. No newer national count exists, so the 2021 and 2022 results remain the latest official figures in 2026.
The map is concentrated. The West Midlands holds 172,398 Sikhs, and Greater London holds 144,543. Together they account for 60.9% of Sikhs in England. Wolverhampton has the highest local share at 12.0%, and the Southall area of Ealing, known as Little Punjab, is 28.2% Sikh. The census counted Sikhs through its religion question, because the Office for National Statistics rejected a separate Sikh ethnic tick box in 2018. This report covers seven data areas: countries, regions, local authorities, shares, neighbourhoods, growth, and birthplace.
Interesting Facts: Sikh Population in UK 2026 Key Data
SIKH POPULATION BY UK COUNTRY (THOUSANDS, CENSUS 2021/22)
England          | ██████████████████████████ 520.1
Scotland         | ▌ 11.0
Wales            | ▏ 4.0
Northern Ireland | ▏ 0.4| Interesting Fact | 2026 Data |
|---|---|
| UK Sikh population (2021 and 2022 censuses) | 535,517, or 0.79% |
| Sikhs in England and Wales (2021) | 524,140, or 0.9% |
| Sikhs in England | 520,092 |
| Sikhs in Scotland (2022) | 10,988 |
| Sikhs in Wales | 4,048 |
| Sikhs in Northern Ireland | 389 |
| Largest region | West Midlands, 172,398 (2.9%) |
| Largest local authority | Sandwell, 39,252 |
| Highest local share | Wolverhampton, 12.0% |
| Most Sikh neighbourhood | Blakenhall, Wolverhampton, 40.7% |
| Growth from 2011 | 23.8% |
| Sikh MPs elected in 2024 | 11 |
Source: Office for National Statistics, Census 2021; National Records of Scotland, Scotland’s Census 2022; Northern Ireland Statistics and Research Agency, Census 2021.
The first six rows give the national split. The UK total of 535,517 is 0.79% of the population. England holds 520,092, which is 97.1% of all UK Sikhs. Scotland has 10,988, Wales 4,048 and Northern Ireland only 389. Scotland counted a year later than the rest of the UK because of the pandemic, so its figure is for 2022. In England and Wales, 426,230 people identified as Sikh through the religion question alone, 1,725 through the ethnic group question alone and 97,910 through both.
The remaining rows show concentration. The West Midlands has 172,398 Sikhs and Sandwell has 39,252, the most of any local authority. Wolverhampton leads on share at 12.0%, and its Blakenhall area reaches 40.7%. Growth since 2011 stands at 23.8%. The 2024 general election returned 11 Sikh MPs, a total the report revisits in the FAQ.
Sikh by Country 2026: England, Scotland, Wales and Northern Ireland
SHARE OF UK SIKHS BY COUNTRY (%)
England          | █████████████████████████████████████████████████ 97.12
Scotland         | █ 2.05
Wales            | ▏ 0.76
Northern Ireland | ▏ 0.07| Country | Sikh Population | Share of Country Population | Share of UK Sikhs |
|---|---|---|---|
| England | 520,092 | 0.92% | 97.12% |
| Scotland (2022) | 10,988 | 0.20% | 2.05% |
| Wales | 4,048 | 0.13% | 0.76% |
| Northern Ireland | 389 | 0.02% | 0.07% |
| United Kingdom | 535,517 | 0.79% | 100.00% |
Source: Office for National Statistics, Census 2021; National Records of Scotland, Scotland’s Census 2022; Northern Ireland Statistics and Research Agency, Census 2021.
England dominates with 520,092 Sikhs, or 0.92% of its residents and 97.12% of the UK’s Sikh population. Scotland follows with 10,988 (0.20% of Scotland), which equals 2.05% of UK Sikhs. Wales has 4,048, a 0.13% share of Wales, and 0.76% of the UK total. Northern Ireland trails with 389 people, 0.02% of its population and 0.07% of UK Sikhs.
The share columns tell two different stories. England’s local share of 0.92% sits above the UK average of 0.79%, which pulls the average up. The other three nations fall below it, with Northern Ireland at only 0.02%. The UK row ties the table together at 535,517. Because Scotland’s census ran in 2022, the UK total mixes two reference years, which matters little for a community that changes slowly. Since 2011, the Sikh population grew 23.8% in England, 21.3% in Scotland, 36.7% in Wales and 80.1% in Northern Ireland, where the count rose from 216 to 389.
Sikh Population by Region in England 2026 | West Midlands, London, South East and More
SIKH POPULATION BY ENGLISH REGION (THOUSANDS)
West Midlands            | █████████████████ 172.4
Greater London           | ██████████████ 144.5
South East               | ███████ 74.3
East Midlands            | █████ 54.0
East of England          | ██ 24.3
Yorkshire and the Humber | ██ 24.0
North West               | █ 11.9
South West               | █ 7.5
North East | █ 7.2| Region | Sikh Population (2021) | Share of Region Population | Share of England’s Sikhs |
|---|---|---|---|
| West Midlands | 172,398 | 2.90% | 33.1% |
| Greater London | 144,543 | 1.64% | 27.8% |
| South East | 74,348 | 0.80% | 14.3% |
| East Midlands | 53,950 | 1.11% | 10.4% |
| East of England | 24,284 | 0.38% | 4.7% |
| Yorkshire and the Humber | 24,034 | 0.44% | 4.6% |
| North West | 11,862 | 0.16% | 2.3% |
| South West | 7,465 | 0.13% | 1.4% |
| North East | 7,206 | 0.27% | 1.4% |
Source: Office for National Statistics, Census 2021, religion by region.
The West Midlands leads with 172,398 Sikhs, 2.90% of the region and 33.1% of England’s Sikhs. Greater London is second with 144,543, a 1.64% share and 27.8% of the national total. The South East adds 74,348 (0.80%) and the East Midlands 53,950, a 1.11% share. The top four regions hold 445,239 Sikhs, or 85.6% of England’s total.
The other five regions hold 74,851 Sikhs combined. The East of England has 24,284 (0.38%) and Yorkshire and the Humber 24,034 (0.44%). The North West has 11,862, the South West 7,465 and the North East 7,206, though the North East’s 0.27% share beats the South West’s 0.13%. The West Midlands and London together account for 60.9% of England’s Sikhs. Since 2011, the West Midlands grew 29.0%, London 14.6% and the South East 35.3%, so the fastest percentage growth came outside the two biggest regions.
Sikh Population by City and Local Authority UK 2026 | Top 10 Areas by Number of Sikhs
SIKH POPULATION BY LOCAL AUTHORITY, TOP 10 (THOUSANDS)
Sandwell      | ████████████████████ 39.3
Birmingham    | █████████████████ 33.1
Wolverhampton | ████████████████ 31.8
Ealing        | ██████████████ 28.5
Hillingdon    | █████████████ 26.3
Hounslow      | ████████████ 24.7
Slough        | █████████ 18.0
Redbridge     | █████████ 17.6
Coventry      | █████████ 17.3
Walsall | █████████ 17.1| Local Authority | Sikh Population (2021) | Share of Local Population |
|---|---|---|
| Sandwell | 39,252 | 11.5% |
| Birmingham | 33,126 | 2.9% |
| Wolverhampton | 31,769 | 12.0% |
| Ealing | 28,491 | 7.8% |
| Hillingdon | 26,339 | 8.6% |
| Hounslow | 24,677 | 8.6% |
| Slough | 17,985 | 11.3% |
| Redbridge | 17,622 | 5.7% |
| Coventry | 17,297 | 5.0% |
| Walsall | 17,148 | 6.0% |
Source: Office for National Statistics, Census 2021, religion by local authority in England.
Sandwell is the largest Sikh local authority in England, with 39,252 people and an 11.5% share. Most live in West Bromwich and Smethwick. Birmingham has 33,126, but they are only 2.9% of a very large city. Wolverhampton has 31,769 and a 12.0% share. London boroughs fill the next three places: Ealing with 28,491 (7.8%), Hillingdon with 26,339 (8.6%) and Hounslow with 24,677 (8.6%).
Slough has 17,985 Sikhs, an 11.3% share, the highest proportion in the South East. Redbridge adds 17,622 (5.7%), Coventry 17,297 (5.0%) and Walsall 17,148 (6.0%). These ten areas hold 253,706 Sikhs, or 48.8% of everyone in England. Eight of the ten sit in the West Midlands or on the west side of London, and Slough lies just beyond, which shows how tightly the community clusters. Leicester in the East Midlands has 16,451 Sikhs, just behind Walsall, and Derby has 9,762.
Most Sikh Areas in the UK 2026 | Highest Share of Population by Local Authority
SIKH SHARE OF LOCAL POPULATION, TOP 10 (%)
Wolverhampton    | ██████████████████████████████ 12.0
Sandwell         | ████████████████████████████▌ 11.5
Slough           | ████████████████████████████ 11.3
Hillingdon       | █████████████████████▌ 8.6
Hounslow         | █████████████████████▌ 8.6
Gravesham        | ████████████████████ 8.0
Ealing           | ███████████████████▌ 7.8
Oadby and Wigston| ██████████████████▌ 7.5
Walsall          | ███████████████ 6.0
Redbridge | ██████████████ 5.7| Local Authority | Share of Local Population | Sikh Population |
|---|---|---|
| Wolverhampton | 12.0% | 31,769 |
| Sandwell | 11.5% | 39,252 |
| Slough | 11.3% | 17,985 |
| Hillingdon | 8.6% | 26,339 |
| Hounslow | 8.6% | 24,677 |
| Gravesham | 8.0% | 8,560 |
| Ealing | 7.8% | 28,491 |
| Oadby and Wigston | 7.5% | 4,342 |
| Walsall | 6.0% | 17,148 |
| Redbridge | 5.7% | 17,622 |
Source: Office for National Statistics, Census 2021, religion by local authority in England.
Wolverhampton is the most Sikh local authority in England, at 12.0% of residents or 31,769 people. Sandwell follows at 11.5% and Slough at 11.3%. Hillingdon and Hounslow tie at 8.6%. Gravesham in Kent reaches 8.0% with 8,560 Sikhs, and Oadby and Wigston in Leicestershire reaches 7.5% with 4,342. Those two are the smaller towns that make the list on share alone.
The bottom of the list shows the spread. Ealing sits at 7.8%, Walsall at 6.0% and Redbridge at 5.7%. The four Black Country boroughs of Dudley, Sandwell, Walsall and Wolverhampton hold 93,485 Sikhs, a 7.7% share of that sub-region. Every area on the list tops 5%, far above the UK average of 0.79%, which means a Sikh resident is likely to live in a place where the community is highly visible. Elsewhere the spread is wider: Coventry is 5.0%, Leicester 4.5%, Warwick 4.2%, Derby 3.7%, Windsor and Maidenhead 2.9% and Spelthorne 2.5%.
Most Sikh Neighbourhoods in the UK 2026 | Southall, Blakenhall, Heston and Handsworth
SIKH SHARE OF NEIGHBOURHOOD POPULATION (%)
Blakenhall (Wolverhampton) | ████████████████████ 40.7
Southall (Ealing)          | ██████████████ 28.2
Heston (Hounslow)          | █████████████ 25.8
Handsworth (Birmingham) | ████████████ 24.8| Neighbourhood | Local Authority | Sikh Population (2021) | Share of Neighbourhood |
|---|---|---|---|
| Blakenhall | Wolverhampton | 5,131 | 40.7% |
| Southall | Ealing | 20,843 | 28.2% |
| Heston | Hounslow | 10,692 | 25.8% |
| Handsworth | Birmingham | 5,064 | 24.8% |
Source: Office for National Statistics, Census 2021, ward-level religion data.
Blakenhall in Wolverhampton has the highest Sikh share, 40.7%, though only 5,131 people live there. Southall has the largest count at 20,843 Sikhs, a 28.2% share, and goes by the name Little Punjab. Heston in Hounslow has 10,692 Sikhs and a 25.8% share. Handsworth in Birmingham has 5,064, or 24.8%, and Sikhs are the second-largest religious group there.
These four places show how a local plurality forms. In Blakenhall, Sikhs make up roughly two of every five residents. In Southall, Heston and Handsworth, about one in four residents is Sikh. Southall hosts one of the largest Vaisakhi street processions in Europe. Compare those neighbourhood shares with 0.79% nationally and the extent of local clustering is clear. Blakenhall’s 5,131 Sikhs are 16.2% of Wolverhampton’s total, Southall’s 20,843 are 73.2% of Ealing’s, and Heston’s 10,692 are 43.3% of Hounslow’s.
Sikh Population Growth in the UK 2026 | From 1951 to the 2021 Census
SIKH POPULATION IN THE UK (THOUSANDS)
1951    | ▏ 7.0
1961    | ▌ 16.0
1971    | ████ 72.0
1981    | ███████ 144.0
1991    | ██████████ 206.0
2001    | █████████████████ 336.1
2011    | ██████████████████████ 432.4
2021/22 | ███████████████████████████ 535.5| Year | Sikh Population | Change From Prior Period |
|---|---|---|
| 1951 | 7,000 | +366.7% |
| 1961 | 16,000 | +128.6% |
| 1971 | 72,000 | +350.0% |
| 1981 | 144,000 | +100.0% |
| 1991 | 206,000 | +43.1% |
| 2001 | 336,149 | +63.2% |
| 2011 | 432,429 | +28.6% |
| 2021/22 | 535,517 | +23.8% |
Source: Office for National Statistics, Census 2001, 2011 and 2021; National Records of Scotland; Northern Ireland Statistics and Research Agency. Figures before 2001 are estimates.
The community grew from about 7,000 in 1951 to 535,517 in 2021/22. The fastest gains came early: +350.0% in the 1960s and +100.0% in the 1970s. Growth then slowed to +43.1% in 1991 and the 2001 census count then showed +63.2% over the 1991 estimate. The 2011 census recorded 432,429, up 28.6%, and the latest count is 103,088 higher, up 23.8%.
Share of the UK population rose from 0.57% in 2001 to 0.68% in 2011 and 0.79% in 2021/22. The total grew 59.3% over those two decades, or 199,368 people. Growth is slowing in percentage terms because the base is larger, but the community still adds roughly 100,000 people per decade. The 2021/22 count is about 2.6 times the 1991 estimate of 206,000. Pre-2001 figures are estimates, so treat early growth rates as indicative rather than exact.
Sikh Population in England and Wales 2026 | Place of Birth, 2001 to 2021
NON-UK-BORN SHARE OF SIKHS IN ENGLAND AND WALES (%)
2001 | ██████████████████████ 43.95
2011 | █████████████████████▌ 43.43
2021 | █████████████████████ 42.75| Place of Birth | 2001 | 2011 | 2021 |
|---|---|---|---|
| UK-born | 184,612 (56.05%) | 239,360 (56.57%) | 300,075 (57.25%) |
| Non-UK-born | 144,744 (43.95%) | 183,798 (43.43%) | 224,065 (42.75%) |
| Total Sikhs | 329,358 (0.63%) | 423,158 (0.75%) | 524,140 (0.88%) |
Source: Office for National Statistics, Census 2001, 2011 and 2021, religion by country of birth (England and Wales).
UK-born Sikhs rose from 184,612 in 2001 to 300,075 in 2021, a 62.5% increase, and now make up 57.25% of the community. Non-UK-born Sikhs grew from 144,744 to 224,065, up 54.8%, and fell from 43.95% to 42.75% of the total. The total rose from 329,358 to 524,140, which is 0.63% to 0.88% of the population of England and Wales. Growth was 28.5% in the first decade and 23.9% in the second.
The gap between the two groups is narrowing slowly. South Asia was the birthplace of 36.7% of Sikhs in 2021, South and Eastern Africa 3.4%, and other European countries 1.6%. Among individual countries, India, Kenya, Afghanistan, Italy, Uganda, Tanzania and Malaysia were most common. The 2021 census also showed 75.3% of Sikhs owning a home, against 62.8% of the wider population, and only 5.7% living in social housing, against 17.1%.
Sikh Population in UK 2026 FAQ
How many Sikhs live in the UK in 2026?
The 2021 and 2022 censuses counted 535,517 Sikhs, or 0.79% of the UK population. No newer official count exists. That makes Sikhs the UK’s fourth-largest religious group.
How many Sikhs live in England in 2026?
England had 520,092 Sikhs at the 2021 census, which is 0.92% of its population and 97.12% of all UK Sikhs.
How many Sikhs live in Scotland in 2026?
Scotland counted 10,988 Sikhs in its 2022 census, or 0.20% of the population. Scotland’s census ran one year later than the rest of the UK.
How many Sikhs live in Wales in 2026?
Wales had 4,048 Sikhs in 2021, which is 0.13% of the Welsh population.
How many Sikhs live in Northern Ireland in 2026?
Northern Ireland recorded 389 Sikhs in 2021, or 0.02% of its residents, up from 216 in 2011.
Which UK region has the most Sikhs in 2026?
The West Midlands, with 172,398 Sikhs and a 2.9% share. Greater London is second with 144,543 and the South East third with 74,348.
Which UK city or area has the most Sikhs in 2026?
Sandwell has the largest Sikh population of any local authority in England at 39,252. Birmingham follows with 33,126 and Wolverhampton with 31,769. In the East Midlands, Leicester has 16,451.
Which UK area has the highest percentage of Sikhs in 2026?
Wolverhampton, at 12.0%. Sandwell is second at 11.5% and Slough third at 11.3%.
Where do most Sikhs live in London in 2026?
Ealing has 28,491 Sikhs, Hillingdon 26,339, Hounslow 24,677 and Redbridge 17,622. Southall, known as Little Punjab, has 20,843 Sikhs, a 28.2% share.
How fast is the Sikh population growing in the UK in 2026?
The Sikh population grew 23.8% between 2011 and 2021/22, from 432,429 to 535,517. That is a gain of 103,088 people.
How many Sikh MPs are there in the UK in 2026?
The 2024 general election returned 11 Sikh MPs, about 1.69% of the House of Commons, against 0.8% of the population. There are also seven Sikh peers in the House of Lords.
Which constituencies have the highest Sikh share in 2026?
Wolverhampton West leads at 14.38%, followed by Smethwick at 13.31% and Slough at 11.36%. Ilford South is at 8.03%.
Is there a Sikh ethnic tick box in the UK census in 2026?
No. The Office for National Statistics rejected a request for one in 2018. In 2021, 76,535 people wrote in Sikh as their ethnicity, and 22,814 more chose it within the Other Asian category.
How many Sikhs in England and Wales were born abroad in 2026?
The 2021 census recorded 224,065 non-UK-born Sikhs, which is 42.75% of the community. UK-born Sikhs numbered 300,075.
How many Sikhs own their homes in the UK in 2026?
In England and Wales, 75.3% of Sikhs owned a home in 2021, against 62.8% of the wider population. Only 5.7% lived in social housing, against 17.1%.
When did Sikhs first settle in the UK?
Maharaja Duleep Singh, the last Sikh ruler of Punjab, arrived in England in 1854. Migration from Punjab began in earnest in the early 20th century, and the first London gurdwara opened in 1911.
How many Sikhs live in Birmingham in 2026?
Birmingham had 33,126 Sikhs in 2021, a 2.9% share of the city. Handsworth is the main cluster, with 5,064 Sikhs, or 24.8% of the area.
How many Sikhs live in Slough in 2026?
Slough has 17,985 Sikhs, an 11.3% share and the highest in the South East. The Slough constituency is 11.36% Sikh.
How many Sikhs live in Leicester and Derby in 2026?
Leicester has 16,451 Sikhs (4.5%) and Derby 9,762 (3.7%). Oadby and Wigston has the highest East Midlands share at 7.5%.
How many Sikhs live in Coventry in 2026?
Coventry has 17,297 Sikhs, a 5.0% share. It is one of five West Midlands authorities with more than 17,000 Sikhs.
How many Sikhs live in Gravesham, Kent, in 2026?
Gravesham has 8,560 Sikhs, an 8.0% share and the highest in Kent. Medway has 4,363 and Southampton 4,192.
What is the Sikh population of the Black Country in 2026?
The Black Country has 93,485 Sikhs, a 7.7% share. It covers Dudley, Sandwell, Walsall and Wolverhampton.
What jobs do British Sikhs do in 2026?
The British Sikh Report found healthcare at 10%, teaching and education at 9%, IT at 8% and accountancy at 7% among the most common sectors. It is a community survey, not a census.
How much do British Sikhs give to charity in 2026?
The British Sikh Report estimates that British Sikhs donate about £125 million a year and about £380 per person. These are survey estimates.
How many Sikhs live in Sandwell in 2026?
Sandwell has 39,252 Sikhs, an 11.5% share and the largest count of any English local authority. Most live in West Bromwich and Smethwick.
How many Sikhs live in Wolverhampton in 2026?
Wolverhampton has 31,769 Sikhs, the highest local share in England at 12.0%. Blakenhall reaches 40.7%, and the Wolverhampton West constituency is 14.38% Sikh.
How many Sikhs live in Hillingdon and Hounslow in 2026?
Hillingdon has 26,339 Sikhs and Hounslow 24,677, each an 8.6% share. Heston in Hounslow has 10,692 Sikhs, or 25.8% of the area.
How many Sikhs live in Redbridge and Newham in 2026?
Redbridge has 17,622 Sikhs, a 5.7% share. Newham has 5,638. Ilford South, in Redbridge, is 8.03% Sikh.
How many Sikhs live in Southampton and Nottingham in 2026?
Southampton has 4,192 Sikhs, a 1.7% share, and Nottingham has 4,110. The Southampton Test constituency is 2.34% Sikh.
Do Sikh MPs in the UK belong to one party in 2026?
All 11 Sikh MPs elected in 2024 sit for Labour. A 2023 British Sikh Report poll found 43% of British Sikhs leaning Labour and 20% Conservative.
How many Sikhs live in Walsall in 2026?
Walsall has 17,148 Sikhs, a 6.0% share. Dudley, which is part of the Black Country, is home to the Dudley constituency at 2.11% Sikh.
How many Sikhs live in Ealing and Southall in 2026?
Ealing has 28,491 Sikhs, a 7.8% share. Southall alone has 20,843, or 28.2% of its residents, and hosts a major Vaisakhi procession.
How many Sikhs live in the world in 2026?
About 25 million to 30 million. The UK’s 535,517 Sikhs equal roughly 2% of that total.
Disclaimer: The data research report we present here is based on information found from various sources. We are not liable for any financial loss, errors, or damages of any kind that may result from the use of the information herein. We acknowledge that though we try to report accurately, we cannot verify the absolute facts of everything that has been represented.