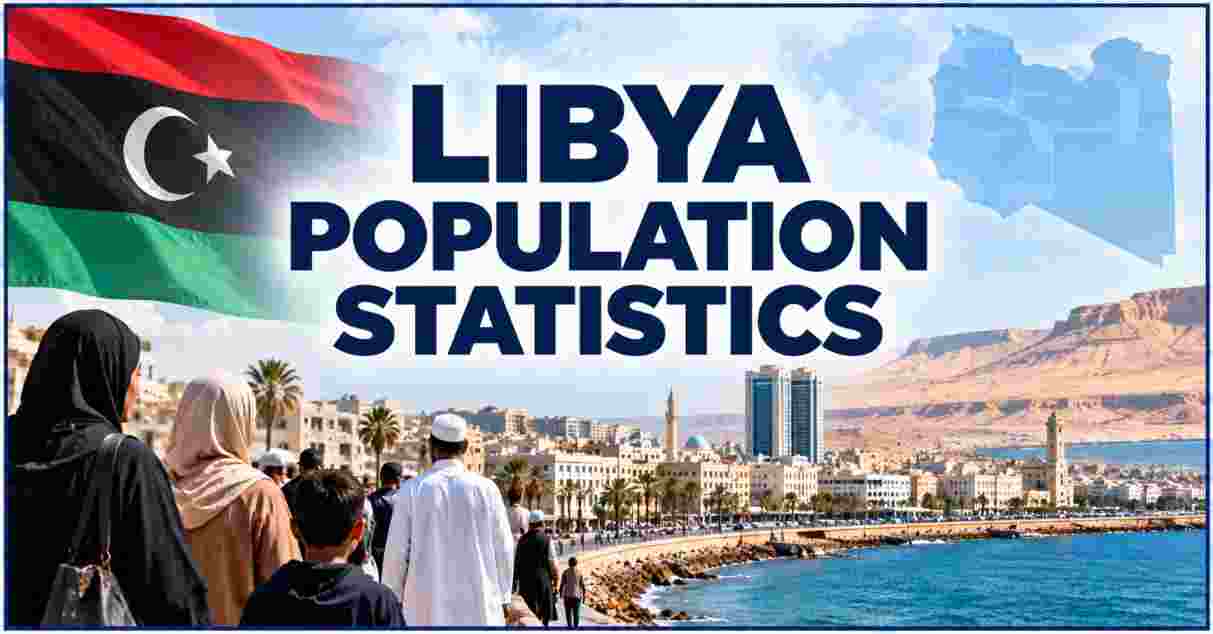
Libya Population in 2026 put the country at 7,539,851 people at mid-year, growing 1.09% a year (about 81,296 people), according to the United Nations World Population Prospects 2024 revision. Men make up 50.82% of residents, 26.2% of people are under 15, the median age is about 29, and IOM counted 943,748 migrants in Libya in March–April 2026, equal to roughly 12.5% of the UN population estimate.
Libya Population 2026 – Introduction
Libya Population rely on models more than on counts. Libya has not held a full census since 2006, and the country has operated under rival authorities in the east and west for years. The United Nations Population Division fills the gap with estimates built from older censuses, surveys and civil records. This report uses the UN’s 2024 revision, the medium-fertility variant, for 2026.
The tables below cover growth history, age, gender, cities, migrants, fertility and life expectancy, and the 2050 outlook. Where sources disagree, the report shows both figures and names each one. The IOM Displacement Tracking Matrix supplies the migrant data. Figures are current as of October 25, 2026.
Interesting Facts About Libya Population 2026
LIBYA POPULATION BY YEAR (MILLIONS)
2000   █████████████████████████░░░░░░░░░░░░░░░  5.31
2010   ███████████████████████████████░░░░░░░░░  6.50
2020   █████████████████████████████████░░░░░░░  7.05
2026   ████████████████████████████████████░░░░  7.54
2050   ████████████████████████████████████████  9.26
| Metric | 2026 Data Point |
|---|---|
| Total population (mid-year, UN) | 7,539,851 |
| Annual growth rate | 1.09% (+81,296) |
| Global rank | 105th |
| Share of world population | 0.09% |
| Median age | About 29 years |
| Total fertility rate | 2.21 births per woman |
| Life expectancy at birth (UN) | 75.2 years |
| Urban population | 77.7% (5,856,016) |
| Population density | About 4.3 per sq km |
| Migrants counted by IOM (Mar–Apr 2026) | 943,748 |
| Projected population, 2050 | 9,260,606 |
Data source: United Nations Department of Economic and Social Affairs, World Population Prospects 2024 (medium variant), as published by Worldometer and World Population Review; IOM Displacement Tracking Matrix, Migrant Report Round 62 (2026); report calculations.
Libya holds 7,539,851 people on 1,759,540 square kilometers, a density of about 4.3 per square kilometer. Most live along the Mediterranean coast, and 77.7% are urban. The population grew by 81,296 in 2026, a 1.09% rise. The UN ranks Libya 105th in the world, with 0.09% of global population.
The age and fertility rows show a young, still-growing country. The median age is about 29 and the fertility rate is 2.21, close to the 2.1 replacement level. IOM’s migrant count of 943,748 adds a large non-citizen presence that the UN estimate partly captures. The UN projects 9,260,606 residents by 2050, a 22.8% rise. These Libya Population Statistics carry wide uncertainty because no recent census exists.
Libya Population Statistics 2026: Population Growth Rate by Year
ANNUAL GROWTH RATE (%)
2000   ████████████████░░░░░░░░░░░░░░░░░░░░░░░░  1.57
2005   ████████████████████░░░░░░░░░░░░░░░░░░░░  2.01
2010   █████████████████████░░░░░░░░░░░░░░░░░░░  2.09
2015   █░░░░░░░░░░░░░░░░░░░░░░░░░░░░░░░░░░░░░░░  0.10
2020   ██████████████░░░░░░░░░░░░░░░░░░░░░░░░░░  1.36
2025   ████████████░░░░░░░░░░░░░░░░░░░░░░░░░░░░  1.15
2026   ███████████░░░░░░░░░░░░░░░░░░░░░░░░░░░░░  1.11
| Year | Population | Annual Change |
|---|---|---|
| 2000 | 5,305,021 | 1.57% |
| 2005 | 5,858,798 | 2.01% |
| 2010 | 6,497,839 | 2.09% |
| 2015 | 6,531,819 | 0.10% |
| 2020 | 7,045,399 | 1.36% |
| 2025 | 7,458,555 | 1.15% |
| 2026 | 7,539,851 | 1.11% |
| 2050 (projection) | 9,260,606 | Not applicable |
Data source: United Nations, World Population Prospects 2024 revision, as published by World Population Review. Percentage changes follow that source; the 2026 rate of 1.09% on Worldometer rounds the same series differently.
Libya added 2,234,830 people from 2000 to 2026, growth of 42.1% (report calculation). Growth peaked near 2.1% a year around 2010 and then fell to 0.10% in 2015, the lowest reading in the series, in a period of conflict and displacement. It recovered to 1.36% in 2020 and has eased to about 1.1% since. Between 2025 and 2026 the country grew by 81,296 people, or 1.09%.
The two sources round the 2026 rate differently, at 1.09% and 1.11%, because they use different rounding of the same UN series. Libya’s rate is slightly above the replacement-level pace seen in wealthier countries, driven by births, with net migration adding only about 2,600 people in 2026. Natural increase of roughly 81,760 a year (326 births less 102 deaths per day) explains nearly all of the growth in Libya Population Statistics for 2026.
Libya Population by Age Group 2026: Young Population and Working-Age Share
LIBYA POPULATION BY AGE GROUP, 2026 (% OF TOTAL)
Ages 0-14    █████████████████████████░░░░░░░░░░░░░░░  26.2
Ages 15-24   █████████████████░░░░░░░░░░░░░░░░░░░░░░░  17.7
Ages 25-54   ████████████████████████████████████████  42.2
Ages 55-64   ████████░░░░░░░░░░░░░░░░░░░░░░░░░░░░░░░░   8.4
Ages 65+     █████░░░░░░░░░░░░░░░░░░░░░░░░░░░░░░░░░░░   5.4
| Age Group | Population | Share of Total |
|---|---|---|
| 0–14 | 1,976,608 | 26.2% |
| 15–24 | 1,335,143 | 17.7% |
| 25–54 | 3,185,249 | 42.2% |
| 55–64 | 634,617 | 8.4% |
| 65 and older | 408,238 | 5.4% |
| Total | 7,539,855 | 100% |
Data source: United Nations, World Population Prospects 2024, single-year-of-age estimates for 2026, as published by World Population Review. Group totals and shares are report calculations; the total differs from 7,539,851 by 4 because of rounding.
Children under 15 number 1,976,608, or 26.2% of the population. Adults aged 15 to 64 total 5,155,009, or 68.4%, and people aged 65 and older number 408,238, or 5.4%. Those groups give a youth dependency ratio of 38.3 children per 100 working-age people and an old-age ratio of 7.9 (report calculations). The total dependency ratio is 46.3.
The pyramid is wide at the bottom but not extreme. About 43.9% of Libyans are under 25, and 51.4% are under 30, which fits a median age near 29. The 15–24 group alone includes 1,335,143 people entering the labor market and higher education. Libya’s seniors are still few, but the group will grow quickly. Age structure is the most important driver of Libya Population Statistics over the next decade.
Libya Population by Gender 2026: Men, Women and Sex Ratio
SEX RATIO BY AGE GROUP (MEN PER 100 WOMEN)
Ages 0-14    ██████████████████████████████████████░░  105.5
Ages 15-24   ██████████████████████████████████████░░  105.8
Ages 25-54   █████████████████████████████████████░░░  104.6
Ages 55-64   ███████████████████████████████████░░░░░   97.8
Ages 65+     ██████████████████████████████░░░░░░░░░   85.1
| Group | Men | Women | Men per 100 Women |
|---|---|---|---|
| Total population | 3,831,475 (50.82%) | 3,708,380 (49.18%) | 103.3 |
| Ages 0–14 | 1,014,851 | 961,757 | 105.5 |
| Ages 15–24 | 686,467 | 648,676 | 105.8 |
| Ages 25–54 | 1,628,571 | 1,556,678 | 104.6 |
| Ages 55–64 | 313,852 | 320,765 | 97.8 |
| Ages 65 and older | 187,734 | 220,504 | 85.1 |
| Median age | 28.7 | 29.4 | Not applicable |
| Life expectancy | 72.7 | 77.8 | Not applicable |
Data source: United Nations, World Population Prospects 2024, as published by World Population Review and Worldometer. Group sex ratios are report calculations.
Libya has 123,095 more men than women, a ratio of 103.3 men per 100 women (report calculation). The ratio of 105.5 in the youngest group reflects the usual surplus of boys at birth, and the 25–54 ratio of 104.6 may also reflect a larger male presence among working-age migrants. After age 55 the pattern reverses. Women outnumber men in the 65-plus group by 32,770, giving a ratio of 85.1.
Women live longer. UN estimates give women a life expectancy of 77.8 years and men 72.7, a gap of 5.1 years. Median age is 28.7 for men and 29.4 for women. The gap in longevity is the main reason older age groups skew female. These sex-ratio rows frame Libya Population Statistics for school, employment and health planning.
Largest Cities in Libya 2026: Tripoli, Benghazi and Misrata Population
URBAN AREA POPULATION, UN ESTIMATE 2025 (THOUSANDS)
Tripoli    ████████████████████████████████████████  1,240
Benghazi   ████████████████████░░░░░░░░░░░░░░░░░░░░    630
Misrata    █████████░░░░░░░░░░░░░░░░░░░░░░░░░░░░░░░    294
Zawiya     ███████░░░░░░░░░░░░░░░░░░░░░░░░░░░░░░░░░    214
Sabha      ████░░░░░░░░░░░░░░░░░░░░░░░░░░░░░░░░░░░░    123
Tobruk     ████░░░░░░░░░░░░░░░░░░░░░░░░░░░░░░░░░░░░    122
| City | UN Urban Area, 2025 | City Estimate, 2026 |
|---|---|---|
| Tripoli | 1,239,823 | 1,506,832 (19.98% of Libya) |
| Benghazi | 630,479 | 837,500 (11.11%) |
| Misrata | 294,401 | 598,400 (7.94%) |
| Zawiya | 214,488 | 210,500 (2.79%) |
| Sabha | 123,436 | 204,100 (2.71%) |
| Tobruk | 121,983 | 201,900 (2.68%) |
| Sirte | 62,192 | 198,100 (2.63%) |
Data source: United Nations World Urbanization Prospects, as published by Worldometer (2025 urban-area estimates); World Population Review (2026 city estimates). Differences reflect different city boundaries.
The two sources do not agree. The UN urban-area estimate puts Tripoli at 1,239,823, while World Population Review lists 1,506,832, which is 19.98% of the country. For Benghazi the figures are 630,479 and 837,500, and for Misrata 294,401 and 598,400. The gaps come from boundaries, since one source counts a built-up area and the other a wider municipal area. Readers should name the source whenever they quote a Libyan city population.
Both sources agree on rank: Tripoli, Benghazi and Misrata lead. The three largest UN urban areas hold 2,164,703 people, about 29.0% of the 7,458,555 residents in 2025 (report calculation). Nationally, 77.7% of residents, or 5,856,016 people, live in urban areas, leaving 1,683,835 in rural areas. A few coastal cities hold much of the population, and most of the Sahara interior is nearly empty.
Migrants in Libya 2026: IOM Counts and Nationalities
MIGRANTS IN LIBYA BY NATIONALITY, ROUND 62 (MAR-APR 2026, APPROX.)
Sudanese    ████████████████████████████████████████  320,874
Nigerien    ███████████████████████░░░░░░░░░░░░░░░░░  188,750
Egyptian    ███████████████████████░░░░░░░░░░░░░░░░░  188,750
Chadian     ███████████░░░░░░░░░░░░░░░░░░░░░░░░░░░░░   94,375
| Indicator | Value |
|---|---|
| Migrants, Round 60 (Nov–Dec 2025) | 939,638 |
| Migrants, Round 61 (Jan–Feb 2026) | 936,134 |
| Migrants, Round 62 (Mar–Apr 2026) | 943,748 (+0.8%) |
| Sudanese share of migrants | 34% |
| Nigerien share | 20% |
| Egyptian share | 20% |
| Chadian share | 10% |
| Migrants who see Libya as their destination | 40% |
| Migrants planning to continue to Europe | 7% |
| Migrants planning to return home | 16% |
Data source: IOM Libya, Displacement Tracking Matrix, Migrant Report Rounds 60–62 (2025–2026); Libya Herald reporting on Round 62. Nationality counts are report calculations (share x 943,748).
IOM identified 943,748 migrants across Libya’s 100 municipalities in March and April 2026, 0.8% above the previous round and the highest count since tracking began. That is 12.5% of the UN population estimate (report calculation). Sudanese nationals form 34%, or about 320,874 people, followed by Nigeriens and Egyptians at 20% each and Chadians at 10%. Most migrants live in cities such as Tripoli, Benghazi and Misrata.
IOM’s count is a floor, since its teams cannot reach all areas. Libyan authorities said in 2024 that about 2.5 million migrants were present, a figure far above IOM’s count. IOM’s survey found 40% of migrants see Libya as their destination, only 7% plan to move on to Europe and 16% plan to go home. This makes migrants a settled part of Libya Population Statistics, not only a transit flow.
Libya Religion and Ethnic Groups 2026: Muslim Share and Population Composition
LIBYA POPULATION BY RELIGION (% OF TOTAL, 2020 ESTIMATE)
Muslim         ████████████████████████████████████████  96.6
Christian      █░░░░░░░░░░░░░░░░░░░░░░░░░░░░░░░░░░░░░░░   2.7
Buddhist       ░░░░░░░░░░░░░░░░░░░░░░░░░░░░░░░░░░░░░░░░   0.3
All other      ░░░░░░░░░░░░░░░░░░░░░░░░░░░░░░░░░░░░░░░░   0.7
| Group | Share of Population | Approximate People (2026) |
|---|---|---|
| Muslim (almost all Sunni) | 96.6% | 7,283,496 |
| Christian | 2.7% | 203,576 |
| Buddhist | 0.3% | 22,620 |
| Other, unaffiliated, Hindu, Jewish, folk religion | 0.7% combined | 52,779 |
| Berber and Arab ethnic groups | 97% | 7,313,655 |
| Other ethnic groups | 3% | 226,196 |
Data source: World Population Review, citing national estimates (religion: 2020 estimate; ethnicity: latest estimate). People counts are report calculations applying each share to the UN mid-year 2026 population of 7,539,851. The source’s religion shares sum to 100.3% because of rounding.
About 96.6% of Libyans are Muslim, and almost all of them are Sunni. That equals roughly 7.28 million people in 2026 (report calculation). Christians make up 2.7%, about 203,576 people. The remaining groups, including Buddhists, Hindus, Jews and the unaffiliated, total about 1.0% combined. These shares come from a 2020 estimate, not a census, and the sources do not separate citizens from foreign residents.
The ethnic estimate puts 97% of residents in the Berber and Arab category and 3% in other groups. The “other” group includes Egyptians, Greeks, Indians, Italians, Maltese, Pakistanis, Tunisians and Turks. The figures round the national mix and do not give a separate count of Amazigh (Berber) residents. No recent census checks any of these shares, so Libya Population Statistics on religion and ethnicity rest on estimates.
Libya Fertility, Births and Life Expectancy 2026
LIBYA VITAL RATES, 2026 (PER DAY AND PER 1,000)
Births per day               ████████████████████████████████████████  326
Deaths per day               ████████████░░░░░░░░░░░░░░░░░░░░░░░░░░░░  102
Net migration per day        █░░░░░░░░░░░░░░░░░░░░░░░░░░░░░░░░░░░░░░░    7
Infant deaths per 1,000      █░░░░░░░░░░░░░░░░░░░░░░░░░░░░░░░░░░░░░░░  6.8
| Indicator | UN WPP 2024 (2026) | World Bank (Latest Year) |
|---|---|---|
| Total fertility rate | 2.21 births per woman | 2.35 (2023) |
| Life expectancy, both sexes | 75.2 years | 69.3 years (2023) |
| Life expectancy, women / men | 77.8 / 72.7 | 70.4 / 68.3 (2023) |
| Infant mortality | 6.8 per 1,000 live births | Not collected |
| Under-five mortality | 8.4 per 1,000 live births | Not collected |
| Births per day | 326 | Not collected |
| Deaths per day | 102 | Not collected |
Data source: United Nations, World Population Prospects 2024 (via Worldometer and World Population Review); World Bank World Development Indicators (2023 values, via Population Pyramid).
The UN projects a fertility rate of 2.21 and a life expectancy of 75.2 years for 2026. The World Bank’s latest published values are 2.35 and 69.3 years for 2023. The UN figure is a 2026 model and the World Bank value is a 2023 observation from a different series, so they do not measure the same thing, and the 5.9-year gap on life expectancy could not be reconciled from published sources. Readers should quote the UN figure for 2026 and name the year with any World Bank value.
Daily vital events show the growth engine: 326 births and 102 deaths a day, plus net migration of about 7. Infant mortality is 6.8 per 1,000 live births. To see how other countries compare, the life expectancy by country statistics report on this site ranks nations by longevity. Libya’s 75.2 years sits 1.4 years above the 73.8-year world average shown by World Population Review (report calculation).
Libya Population Projections 2026 to 2050: UN Growth Outlook
PROJECTED LIBYA POPULATION (MILLIONS)
2026   ██████████████████████████████████░░░░░░  7.54
2046   ████████████████████████████████████████  9.06
2050   ████████████████████████████████████████  9.26
| Year | Projected Population | Change From 2026 |
|---|---|---|
| 2026 | 7,539,851 | Not applicable |
| 2046 | 9,063,424 | +20.2% |
| 2050 | 9,260,606 | +22.8% |
Data source: United Nations, World Population Prospects 2024, medium variant, as published by World Population Review and GeoRank. Percentage changes are report calculations.
The UN medium variant expects Libya to reach 9,063,424 by 2046 and 9,260,606 by 2050. That is 22.8% more people than in 2026, or 1,720,755 additional residents. Growth slows as fertility edges toward replacement, but the large number of people under 25 (3,311,751) keeps births high for years. The UN range for 2050 is wide, since the starting point carries no recent census.
Planners should read these figures as scenarios. Another 1.7 million residents would add pressure on housing, water and jobs along the coastal strip. Political division, migration shifts and the release of a new census could change the path. Libya Population Statistics for 2050 will move as soon as a reliable national count exists.
Libya Population – FAQ
What Is the Population of Libya in 2026?
The UN estimates 7,539,851 people at mid-year 2026, up 1.09% from 2025. Live counters show about 7.57 million by late October 2026.
What Is the Population Growth Rate of Libya in 2026?
About 1.09% to 1.11%, depending on rounding, or roughly 81,296 people a year. Births exceed deaths by about 224 a day.
What Is the Median Age in Libya in 2026?
About 29 years: 28.7 for men and 29.4 for women. About 51.4% of Libyans are under 30.
How Many Men and Women Live in Libya in 2026?
About 3,831,475 men (50.82%) and 3,708,380 women (49.18%). That equals 103.3 men per 100 women.
What Percentage of Libya’s Population Is Urban in 2026?
77.7%, or 5,856,016 people, live in urban areas. The remaining 1,683,835 live in rural areas.
What Is the Largest City in Libya in 2026?
Tripoli. The UN urban-area estimate is 1,239,823 for 2025. World Population Review lists 1,506,832 for 2026.
How Many Migrants Live in Libya in 2026?
IOM counted 943,748 migrants in March–April 2026. Libyan authorities cited about 2.5 million in 2024, a figure far above IOM’s count.
What Is the Life Expectancy in Libya in 2026?
The UN estimates 75.2 years: 77.8 for women and 72.7 for men. The World Bank’s latest value is 69.3 years for 2023.
What Is the Fertility Rate in Libya in 2026?
2.21 births per woman in the UN estimate. The World Bank reported 2.35 for 2023.
What Is the Population Density of Libya in 2026?
About 4.3 people per square kilometer across 1,759,540 square kilometers, one of the lowest densities in the world.
What Is the Religion of Libya in 2026?
About 96.6% of Libyans are Muslim, almost all Sunni, and 2.7% are Christian, based on a 2020 estimate. About 97% of residents are Berber and Arab.
When Was Libya’s Last Census in 2026?
Libya’s last full census took place in 2006. The UN builds its yearly estimates from that count and later surveys, so every figure here is a model.
Disclaimer: The data research report we present here is based on information found from various sources. We are not liable for any financial loss, errors, or damages of any kind that may result from the use of the information herein. We acknowledge that though we try to report accurately, we cannot verify the absolute facts of everything that has been represented.