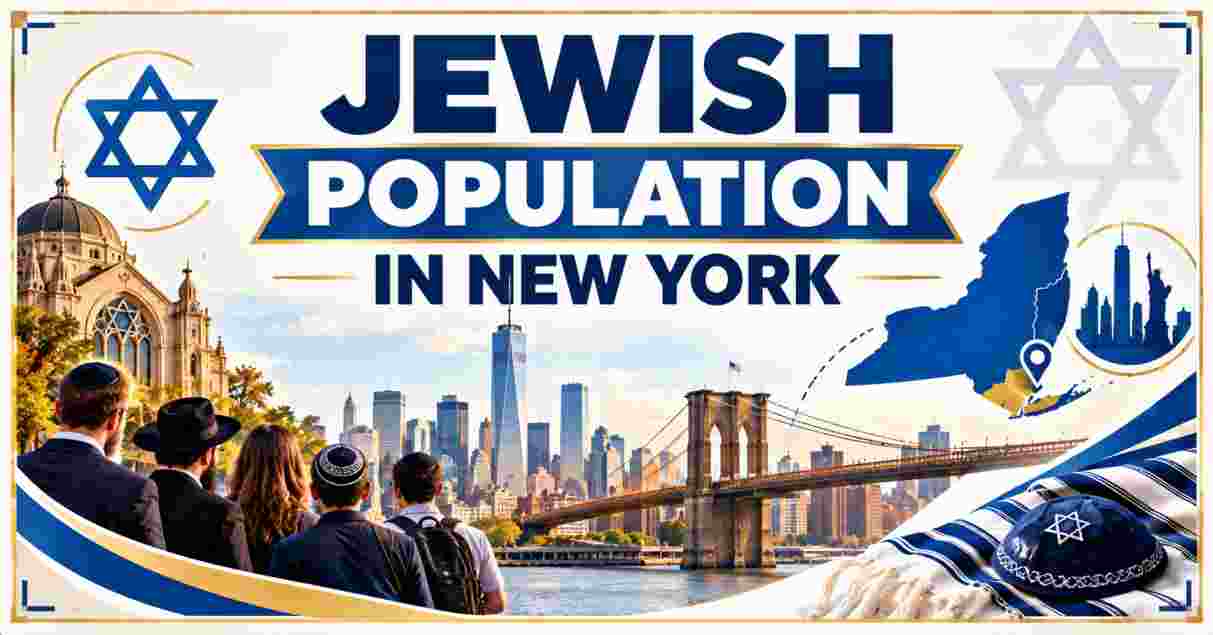
New York’s eight-county Jewish community numbers 1,372,000 adults and children as of the most recent comprehensive count, living within 736,000 households across New York City, Nassau, Suffolk, and Westchester. Brooklyn remains the single most populous Jewish county, home to roughly a third of the entire region’s Jewish population.
Jewish Population in New York 2026 – Introduction
The Jewish population in New York remains the largest of any metropolitan area in the United States, concentrated across an eight-county footprint spanning the five boroughs of New York City along with the neighboring suburban counties of Nassau, Suffolk, and Westchester. According to UJA-Federation of New York’s comprehensive Jewish Community Study, the most authoritative source of data on the community since the U.S. Census does not ask questions about religion, the region is home to 1,372,000 Jewish adults and children, part of a broader 1,776,000 people living in Jewish households once non-Jewish family members are included.
That population has remained relatively stable over the past two decades even as its internal composition has shifted considerably. Brooklyn has held its position as the most Jewish-populous county for as long as such studies have been conducted, while denominational identity, household income, and age distribution have all changed in ways that reflect broader currents reshaping American Jewish life. Understanding exactly how this population breaks down by county, household type, and demographic group offers a detailed picture of the community that anchors American Jewish life more than any other in the country.
The 2023 study, based on nearly 6,000 completed questionnaires gathered during the spring of that year, remains the most current and authoritative source available on the community heading into 2026, since comprehensive studies of this scale are conducted only periodically rather than annually. That makes the underlying county-level, household, and denominational figures presented here the most reliable baseline for understanding New York’s Jewish population as it stands today, even as individual neighborhoods and communities continue to evolve in the years since the study’s fieldwork was completed.
Interesting Facts about Jewish Population in New York
| Fact | Figure |
|---|---|
| Total Jewish Adults and Children (8-County Area) | 1,372,000 |
| Total People in Jewish Households (Including Non-Jews) | 1,776,000 |
| Jewish Households | 736,000 |
| Most Populous Jewish County | Brooklyn (462,000 Jewish people) |
| Jewish Population, New York City (5 Boroughs) | 960,000 |
| Jewish Population, Suburban Counties (Nassau, Suffolk, Westchester) | 412,000 |
| Growth in Jewish Households Since 2011 | +6% |
| Jewish Density (Share of All Households) | 14%, down from 15% in 2002 |
Source: UJA-Federation of New York, Jewish Community Study of New York 2023
These interesting facts about the Jewish population in New York show a community that has remained numerically stable even as the broader regional population has shifted around it. With 1,372,000 Jewish adults and children spread across eight counties, the New York area continues to hold, by a wide margin, the largest concentration of Jewish people of any metropolitan area in the country.
Brooklyn’s position as home to 462,000 Jewish people, nearly a third of the entire region’s total, reflects a dominance the borough has maintained since the earliest Jewish population studies were conducted in New York, driven substantially by its large and growing Haredi Orthodox community.
That stability at the regional level sits alongside meaningful internal shifts. The share of the region’s households that are Jewish, a measure researchers call Jewish density, has actually declined slightly over the past two decades even as absolute household counts have grown, reflecting the faster overall population growth of the broader eight-county area relative to the Jewish community specifically.
Jewish Population by County in New York 2026
| County | Jewish Adults and Children | % of Total | Total People in Jewish Households | % of Total |
|---|---|---|---|---|
| Brooklyn | 462,000 | 34% | 542,000 | 31% |
| Manhattan | 277,000 | 20% | 356,000 | 20% |
| Nassau | 222,000 | 16% | 274,000 | 15% |
| Queens | 150,000 | 11% | 217,000 | 12% |
| Westchester | 105,000 | 8% | 137,000 | 8% |
| Suffolk | 85,000 | 6% | 138,000 | 8% |
| Staten Island | 38,000 | 3% | 65,000 | 4% |
| Bronx | 33,000 | 2% | 47,000 | 3% |
Source: UJA-Federation of New York, Jewish Community Study of New York 2023
The county-by-county distribution of New York’s Jewish population reveals a heavy concentration in just two boroughs. Brooklyn and Manhattan together account for more than half of all Jewish households in the eight-county area, a pattern that has held consistent since at least 2002. Brooklyn alone holds 34% of the region’s Jewish population, more than any other single county, driven substantially by its large Hasidic and other Haredi Orthodox communities concentrated in neighborhoods like Borough Park, Williamsburg, and Crown Heights.
Among the suburban counties, Nassau stands out with 222,000 Jewish residents, considerably more than either Suffolk or Westchester, reflecting Long Island’s long history as a preferred destination for Jewish families moving out of the city in the decades following World War II. The Bronx and Staten Island remain the smallest Jewish population centers among the eight counties, together accounting for just 5% of the region’s total Jewish population.
Manhattan’s position as the second-largest county by Jewish population, with 277,000 residents, reflects a very different community profile than Brooklyn’s, skewing more toward nondenominational and secular identification alongside higher average household incomes. Queens, home to 150,000 Jewish residents, hosts a notably diverse Jewish community that includes significant populations of Bukharian, Syrian Sephardic, and other Jewish immigrant communities not as heavily represented in the other boroughs.
Jewish Households and Family Composition in 2026
| Metric | Figure |
|---|---|
| Total Jewish Households | 736,000 |
| Jewish Adults | 1,076,000 |
| Jewish Children | 296,000 |
| Non-Jews in Jewish Households | 405,000 |
| Households Including an Intermarried Couple | 37% of married couples involving a Jewish spouse |
Source: UJA-Federation of New York, Jewish Community Study of New York 2023
New York’s 736,000 Jewish households collectively house 1,076,000 Jewish adults and 296,000 Jewish children, alongside 405,000 non-Jewish family members, a figure that has grown substantially in recent decades as intermarriage rates have risen. That trend reflects a broader national pattern: 37% of married couples involving a Jewish spouse in the New York area now include a non-Jewish partner, a rate that has reshaped household composition even as the overall Jewish population count has stayed relatively steady.
Religion in US Statistics tracking the broader national religious landscape show that Jewish Americans make up roughly 1.7% of the total US adult population, a share that has remained largely stable since 2007 even as other religious categories have shifted more dramatically. New York’s outsized concentration of that national Jewish population, nearly 1.4 million people within just eight counties, underscores how geographically concentrated American Jewish life remains compared to the more dispersed patterns seen among other religious groups.
The rising intermarriage rate carries particular significance for how researchers project the community’s future composition. Children raised in intermarried households often develop more complex or fluid relationships with Jewish identity than those raised by two Jewish parents, a dynamic that has prompted Jewish communal organizations across the region to rethink outreach and engagement strategies aimed at retaining connection to Jewish community life across an increasingly diverse range of family structures.
Growth and Historical Trends in the NY Jewish Population 2026
| Metric | Figure |
|---|---|
| Jewish Households, 2002 | ~646,000 (14% increase to 2023) |
| Jewish Households, 2011 | ~695,000 (6% increase to 2023) |
| Jewish Households, 2023 | 736,000 |
| 8-County Jewish Population, 2011 | ~1.54 million (broader historical count) |
| NYC Jewish Population, 2011 | 1,086,000 (13% of city population) |
| NYC Jewish Population, 2023 | 960,000 |
Source: UJA-Federation of New York Jewish Community Studies (2002, 2011, 2023)
The growth trajectory of Jewish households in the New York area tells a somewhat different story than the total population count alone. While the number of Jewish households climbed 14% since 2002 and 6% since 2011, the total count of Jewish adults and children has shown broader stability, hovering around 1.4 million people across all three most recent studies. That combination, growing household counts alongside stable total population, reflects declining average household size as older Jewish New Yorkers increasingly live alone or in smaller households than prior generations.
Muslim Population in US tracking another significant New York-concentrated religious minority offers a useful comparison point, since New York State similarly leads the nation with an estimated 724,475 Muslim residents, showing how the state’s overall religious diversity extends well beyond its historically dominant Jewish and Christian populations. Within New York City specifically, the Jewish population’s decline from 1,086,000 in 2011 to 960,000 in 2023 reflects continued, if gradual, migration toward suburban counties and other US regions, even as the city retains its position as the largest single concentration of Jewish residents in the country.
Researchers attribute much of this city-to-suburb shift to familiar factors driving broader regional migration patterns: rising housing costs within the five boroughs, the desire for more space among growing families, and the pull of established suburban Jewish communities offering synagogues, schools, and other communal infrastructure already built out over previous generations of migration. Even so, the pace of that shift has remained gradual rather than dramatic, with the city retaining a clear majority of the region’s total Jewish population across every study conducted to date.
Religious Denomination and Haredi Population in 2026
| Denomination Category | Population |
|---|---|
| Nondenominational Jewish Adults | 452,000 (42% of Jewish adults) |
| Haredi Orthodox Adults | 152,000 (14% of Jewish adults) |
| Haredi Households’ Children | 171,000 (43% of all children in Jewish households) |
| Hasidic Jews | 9% of Jewish adult population |
| Yeshivish Jews | 4% of Jewish adult population |
| Chabad-Identifying Jews | 2% of Jewish adult population |
Source: UJA-Federation of New York, Jewish Community Study of New York 2023
Denominational identity among New York’s Jewish population has shifted notably toward less formal affiliation categories. Nondenominational Jewish adults, a category that includes both those claiming no denomination and those identifying as culturally Jewish, now represent 42% of all Jewish adults in the eight-county area, totaling 452,000 people. That group breaks down into 143,000 adults who identify with no denomination at all and 309,000 who describe themselves as culturally Jewish without formal religious observance.
At the opposite end of the religious spectrum, the Haredi Orthodox community has grown into a demographically significant and disproportionately young segment of the population. While Haredi adults represent 14% of the total Jewish adult population, Haredi households account for a striking 43% of all children living in Jewish households, reflecting the community’s characteristically large family sizes. Within the Haredi population, Hasidic Jews form the largest subgroup at 9% of all Jewish adults, followed by Yeshivish Jews at 4% and those identifying with the Chabad movement at 2%.
Poverty and Economic Diversity Among NY Jews in 2026
| Metric | Figure |
|---|---|
| Jewish Households Poor or Near-Poor (8-County Area) | 20% (147,000 households, ~428,000 people) |
| Manhattan Jewish Households Poor or Near-Poor | 15% |
| Brooklyn Jewish Households Poor or Near-Poor | 36% |
| Jewish Households Earning $150,000+ Annually | More than one-third |
| Share of Jewish Children in Poverty Who Are Haredi Orthodox | More than 80% |
Source: UJA-Federation of New York, Jewish Community Study of New York 2023
Economic circumstances vary dramatically across New York’s Jewish population, with poverty concentrated heavily in specific communities and geographic areas. Overall, 20% of Jewish households in the eight-county area, representing 147,000 households and roughly 428,000 people, are classified as poor or near-poor, with incomes below 250% of the federal poverty guideline. That overall figure masks enormous variation by borough: just 15% of Manhattan’s Jewish households fall into this category, compared to 36% in Brooklyn, where the large Haredi Orthodox population, which tends to have larger families and lower average household income, drives much of the disparity.
Most Populated States in the US tracking New York’s overall state population of roughly 19.9 million residents provide useful context for how significant this Jewish poverty figure actually is relative to the broader state population. More than 80% of Jewish children living in poverty across the eight-county area come from Haredi Orthodox households, even though this group represents a minority of the overall Jewish population, underscoring how unevenly economic hardship is distributed across New York’s religiously diverse Jewish community. At the same time, more than a third of all Jewish households in the region report annual incomes exceeding $150,000, illustrating the wide economic range present within a single religious community.
Demographic Diversity: Age, Intermarriage, and Immigration in 2026
| Metric | Figure |
|---|---|
| Jewish Adults Age 65 and Older | 28%, vs 21% for general 8-county population |
| Holocaust Survivors Living in 8-County Area | ~13,000 (92% in New York City) |
| Russian-Speaking Jewish Adults | ~90,000 (72,000 households) |
| Jewish Households With an LGBTQ+ Member | 14% |
Source: UJA-Federation of New York, Jewish Community Study of New York 2023
New York’s Jewish population skews notably older than the region’s general population, with 28% of Jewish adults age 65 or older, compared to just 21% among all adults across the eight-county area. That older age profile has implications for future population trends, healthcare needs, and community planning, particularly as the community’s remaining Holocaust survivor population, estimated at roughly 13,000 people with 92% living in New York City, continues to age.
Russian-speaking Jewish adults, numbering approximately 90,000 across 72,000 households, represent another distinct demographic layer within the broader community, heavily concentrated in Brooklyn, with roughly a quarter of all Russian-speaking Jewish households located there. Beyond these ethnic and generational distinctions, 14% of Jewish households in the region report including at least one member who identifies as LGBTQ+, reflecting the increasing demographic and social diversity present within a Jewish community too often characterized in simplified or monolithic terms.
Jewish Population in New York 2026 FAQ
How many Jewish people live in New York’s eight-county area?
1,372,000 Jewish adults and children live across the eight-county New York area, according to the most recent comprehensive UJA-Federation study.
Which county has the largest Jewish population in New York?
Brooklyn has the largest Jewish population of any county, home to 462,000 Jewish people, roughly a third of the entire region’s total.
How many Jewish households are there in New York?
There are 736,000 Jewish households in the eight-county New York area as of the most recent study.
How many Jewish people live in New York City compared to the suburbs?
960,000 Jewish people live within New York City’s five boroughs, while 412,000 live in the suburban counties of Nassau, Suffolk, and Westchester.
What percentage of New York’s Jewish population is Haredi Orthodox?
Haredi Orthodox adults make up 14% of the Jewish adult population, though Haredi households account for 43% of all children living in Jewish households.
How has the Jewish population in New York changed since 2011?
The number of Jewish households grew 6% since 2011, though the total Jewish population has remained relatively stable at around 1.4 million across recent studies.
What percentage of Jewish households in New York are poor or near-poor?
20% of Jewish households across the eight-county area are classified as poor or near-poor, though this varies sharply by borough, from 15% in Manhattan to 36% in Brooklyn.
How many Holocaust survivors still live in the New York area?
An estimated 13,000 Holocaust survivors live in the eight-county area, with 92% residing in New York City.
What share of New York’s Jewish adults are 65 or older?
28% of Jewish adults in the eight-county area are 65 or older, compared to 21% of adults overall in the region.
How many Russian-speaking Jews live in the New York area?
Approximately 90,000 Russian-speaking Jewish adults live across 72,000 households in the eight-county area, heavily concentrated in Brooklyn.
What percentage of Jewish adults nationally identify as nondenominational?
In New York’s eight-county area specifically, 42% of Jewish adults identify as nondenominational, split between 13% claiming no denomination and 29% identifying as culturally Jewish.
Which counties make up the eight-county New York Jewish community study area?
The study covers the Bronx, Brooklyn, Manhattan, Queens, and Staten Island (New York City’s five boroughs) along with the suburban counties of Nassau, Suffolk, and Westchester.
Disclaimer: The data research report we present here is based on information found from various sources. We are not liable for any financial loss, errors, or damages of any kind that may result from the use of the information herein. We acknowledge that though we try to report accurately, we cannot verify the absolute facts of everything that has been represented.