
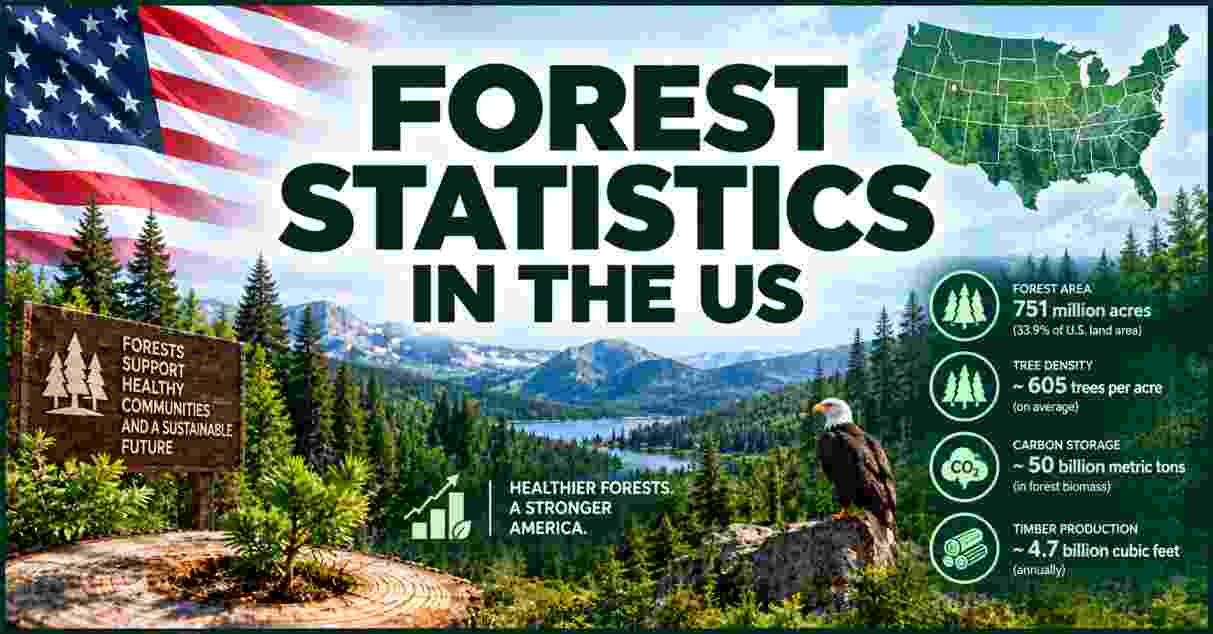
The United States has about 765 million acres of forest, roughly one third of its land, and US forests sequestered an estimated 759.2 million metric tons of CO2 equivalent in 2024. Maine is the most forested state at 89% of its land, wildfires burned 5.13 million acres in 2025, and about 8.1 million acres had burned by late September 2026.
Forest Statistics in the US 2026
Forest Statistics in the US 2026 describe a resource that holds steady in size and faces growing pressure from fire, drought, and development. About 765 million acres of forest cover roughly one third of the country, a share that has stayed near one third for a century. The US Forest Service’s Forest Inventory and Analysis (FIA) program counts those trees. Private owners hold 56% of the land, and the National Forest System manages another 193 million acres. The East holds the densest cover, with Maine at 89%, while the Great Plains hold almost none.
The pressure shows up in the fire and carbon numbers. Wildfires burned 5.13 million acres in 2025 and had burned about 8.1 million acres by late September 2026. Forests still remove far more carbon than they release, but the net sink has been shrinking. This report covers forest area, cover by state, ownership, tree loss and wildfire, carbon storage, and timber. Each table names its period. FIA publishes full national totals only every few years, so state percentages here come from the 2022 inventory cycle and the national area from the last comprehensive assessment.
Interesting Facts About US Forests 2026
| Fact | Data (Period) |
|---|---|
| Forest land | About 765 million acres, 34% of US land (FIA, 2017 assessment) |
| Timberland | 514 million acres |
| Private ownership | 56% of forest land (about 412 million acres) |
| National Forest System | 193 million acres (154 national forests, 20 grasslands) |
| Most forested state | Maine, 89.1% of land (FIA 2022 cycle) |
| Least forested state | North Dakota, 1.8% |
| Trees in the lower 48 | Nearly 1.4 trillion |
| Forest carbon stock | 58.7 billion metric tons of carbon (2019) |
| Net forest carbon sequestration | 759.2 million metric tons CO2e (2024) |
| Wildfire acres burned | 5,131,474 across 77,850 fires (2025) |
| Wildfire acres burned, 2026 to date | About 8.1 million across 51,774 fires (late September) |
| Forest products industry jobs | About 925,000 to 950,000 |
The national forest area has not been updated in a single comprehensive report since 2017, so the 765 million acres figure is the latest firm national total. Other 2026 summaries put the total near 751 million acres, and the gap reflects different definitions of forest and different inventory dates. State percentages come from FIA’s 2022 report, which draws on field plots measured from 2018 to 2021.
The facts also show how unevenly forests are spread and who controls them. Private owners hold more than half of all forest land, and about 70% of timberland is privately owned. The East carries most of the private forest, while the West carries most of the public forest. That split shapes everything from timber supply to wildfire policy, as the sections below show.
Forest Area in the US by Type 2026
US forest area by forest type, millions of acres (scale: 389 = 40 blocks)
Conifer forests               ██████████████████████████ 389
Broadleaf forests             █████████████████████ ~300
Mixed and other (calculated) █████ ~76| Metric | Value (Period) |
|---|---|
| Total forest area | About 765 million acres (2017 assessment) |
| Share of US land area | About 34% |
| Conifer forests | 389 million acres |
| Broadleaf forests | Nearly 300 million acres |
| Timberland | 514 million acres |
| Forest cover, South | 46% of land |
| Forest cover, North | 43% of land |
| Forest cover, Pacific Coast | 41% of land |
| Forest cover, Alaska | 35% of land |
| Forest cover, Rocky Mountain region | 18% of land |
Data source: USDA Forest Service, Forest Inventory and Analysis program, Forest Resources of the United States, 2017, and Montréal Process Criteria and Indicators reporting (Indicator 1.01 and 2.10).
Conifers cover 389 million acres, about 51% of all forest land, and most of them stand in the West, where 284 million acres of conifer forest grow. Broadleaf forests cover nearly 300 million acres and dominate the East, where the oak-hickory and maple-beech-birch types lead. The remainder is mixed forest and other types, about 76 million acres by subtraction. The South holds most of the country’s mixed forest, with 88% of it.
Timberland, forest that can grow commercial wood and is not legally reserved, covers 514 million acres, about 67% of all forest land. Regional forest cover runs from 18% of the land in the Rocky Mountain region to 46% in the South. The pattern explains why timber, fire, and carbon policy vary so much by region. A forest in Georgia is mostly private pine plantation, while a forest in Idaho is mostly public land where fires burn.
Forest Cover by State in the US 2026
Share of land area forested, top 10 states, FIA 2022 cycle (scale: 89.06% = 40 blocks)
Maine          ████████████████████████████████████████ 89.06%
New Hampshire  █████████████████████████████████████ 83.04%
West Virginia  ███████████████████████████████████ 78.05%
Vermont        ██████████████████████████████████ 76.47%
Alabama        ████████████████████████████████ 71.35%
South Carolina ██████████████████████████████ 67.21%
Georgia        ██████████████████████████████ 66.93%
Mississippi    █████████████████████████████ 64.53%
Virginia       █████████████████████████████ 63.48%
New York       ████████████████████████████ 62.62%
| State | Share of Land Forested | Trees per Capita |
|---|---|---|
| Maine | 89.06% | 3,292 |
| New Hampshire | 83.04% | 883 |
| West Virginia | 78.05% | 1,674 |
| Vermont | 76.47% | 1,803 |
| Alabama | 71.35% | 1,163 |
| Georgia | 66.93% | 584 |
| Oregon | 48.39% | 948 |
| Washington | 52.52% | 722 |
| Texas | 37.76% | 538 |
| Alaska | 36.95% | 43,401 |
| California | 36.88% | 20 |
| Iowa | 8.18% | 238 |
| Kansas | 4.83% | 446 |
| Nebraska | 3.12% | 203 |
| North Dakota | 1.82% | 261 |
Data source: USDA Forest Service, Forest Inventory and Analysis Fiscal Year 2022 Business Report, as compiled by World Population Review (2026 update).
New England and the Appalachian South lead on share of land. Maine is 89.06% forested, with about 17.7 million acres, and New Hampshire follows at 83.04%. West Virginia, Vermont, and Alabama each exceed 70%. Georgia has about 24.8 million acres, the most among the top-ranked states, and Alabama has about 22.9 million. The ranking measures percentage of land and not total acres, so big western states appear lower than their forest area suggests.
The Great Plains sit at the bottom. North Dakota is 1.82% forested, Nebraska 3.12%, South Dakota 4.02%, and Kansas 4.83%. Trees per person tell a different story: Alaska has 43,401 trees per resident, Montana has 5,965, and California has only 20. A state can rank high on one measure and low on the other, so both views matter when comparing how much forest each resident can reach.
Forest Ownership in the US 2026
Forest land by owner, millions of acres (scale: 412 = 40 blocks)
Private owners                ████████████████████████████████████████ 412
Federal agencies              ███████████████████████ 238
State, local, tribal (calc.)  ███████████ ~115
| Owner | Forest Land | Share or Note |
|---|---|---|
| Private owners | About 412 million acres | 56% of forest land |
| Federal government | 238.4 million acres | USFS 145.2 million, BLM 38.1 million, other 55.1 million |
| State, local, and tribal | About 115 million acres (calculated) | About 10% to 15% |
| National Forest System (all lands) | 193 million acres | 154 forests, 20 grasslands |
| Livestock grazing on national forest land | About 74 million acres | Of the 193 million total |
| Share of timberland owned privately | 70% | 30% public |
| Share of private forest classed as timberland | 81% | n/a |
| Reserved forest (not managed for timber) | 74.2 million acres | Excludes roadless areas |
Data source: USDA Forest Service, Forest Inventory and Analysis; National Association of State Foresters, Forest Ownership Statistics; USDA Forest Service Indicator 2.10 (2017); WorldAtlas 2026 summary of FIA data.
Private owners hold about 412 million acres, 56% of all forest land. Families and individuals own most of it. The federal government holds 238.4 million acres, with the Forest Service’s 145.2 million forested acres the largest block. State, local, and tribal governments hold the remaining 115 million or so, by subtraction. Private land dominates the East and the South, while public land dominates the West, so wildfire policy and timber policy affect different owners in different regions.
Ownership decides how forests get used. About 81% of private forest is timberland, and 70% of all timberland is private, so private owners supply most of the wood. Public land carries 74 million grazing acres inside the National Forest System, and the system’s 154 forests also supply recreation and water.
Tree Cover Loss & Wildfire Statistics in the US 2026
US wildfire acres burned by year, millions of acres (scale: 8.92 = 40 blocks)
2022              ██████████████████████████████████ 7.58
2023              ████████████ 2.69
2024              ████████████████████████████████████████ 8.92
2025              ███████████████████████ 5.13
2026 (Sep 29 YTD) ████████████████████████████████████ ~8.1
| Year | Wildland Fires | Acres Burned |
|---|---|---|
| 2022 | 68,988 | 7,577,183 |
| 2023 | 56,580 | 2,693,910 |
| 2024 | 64,897 | 8,924,884 |
| 2025 | 77,850 | 5,131,474 |
| 2026 (through late September) | 51,774 | About 8.1 million |
| Alaska, 2025 | n/a | 1,006,158 |
| California, 2025 | n/a | 505,994 |
| Arizona, 2025 | n/a | 326,813 |
| Largest 2025 fire (Dragon Bravo, Arizona) | n/a | 145,504 |
| Tree cover lost to wildfire, 2001 to 2023 | n/a | 12.7 million hectares |
Data source: National Interagency Coordination Center, National Interagency Fire Center, Total Wildland Fires and Acres; USAFacts analysis of NIFC data; Global Forest Watch and University of Maryland GLAD Lab (2001 to 2023 figure).
Wildfire acreage swings widely from year to year. Fires burned 8.92 million acres in 2024, fell to 5.13 million in 2025 (down 43%), and had reached about 8.1 million by late September 2026, which USAFacts describes as above average. The number of fires rose to 77,850 in 2025, the highest of the last four years, even though the acreage dropped. Alaska burned 1,006,158 acres in 2025, nearly 20% of the national total. The Dragon Bravo Fire in Arizona was the largest single fire at 145,504 acres.
Fire is the main driver of tree cover loss measured by satellites. Between 2001 and 2023, wildfires cost the US 12.7 million hectares of tree cover, according to Global Forest Watch. Globally, fire caused 42% of the 25.5 million hectares of tree cover lost in 2025. Tree cover loss is not the same as permanent deforestation, since burned and harvested stands can regrow. For the land-conversion side of the story, see deforestation statistics in the US.
Forest Carbon Storage in the US 2026
Share of forest carbon stock by pool, 2019 (scale: 54% = 40 blocks)
Soil                       ████████████████████████████████████████ 54%
Aboveground biomass        ███████████████████ 26%
Other pools (calculated)   ███████████████ 20%
| Metric | Value (Period) |
|---|---|
| Total forest carbon stock | 58.7 billion metric tons of carbon (2019) |
| Carbon in soil | 54% of the stock |
| Carbon in aboveground biomass | 26% of the stock |
| Net sequestration by forests | 759.2 million metric tons CO2e (2024) |
| Forest land remaining forest land, net sink | 787.0 million metric tons CO2e (2022) |
| Forests, harvested wood products, and woodlands, net sink | 889.3 million metric tons CO2e (2022) |
| Share of gross emissions offset (land sector) | About 13% |
| Carbon on federal forest lands | 17.2 petagrams, 33% of US forest carbon |
| Value of urban forests | $18.3 billion a year, including $5.4 billion in air pollution removal |
| Added sequestration if understocked forest were fully stocked | About 187.7 million metric tons CO2 a year, 20% more |
Data source: U.S. Environmental Protection Agency, Inventory of U.S. Greenhouse Gas Emissions and Sinks; USDA Forest Service Greenhouse Gas Emissions and Removals 1990-2022; Congressional Research Service, Forest Carbon Primer (2020); Arbor Analytics (June 2026); North American Forest Foundation.
US forests hold about 58.7 billion metric tons of carbon, most of it in soil (54%) and aboveground biomass (26%). They also remove carbon each year: EPA’s inventory shows a net sink of 787.0 million metric tons of CO2 equivalent from existing forest land in 2022, and a 2026 analysis of the latest inventory puts 2024 net sequestration at 759.2 million. The land sector as a whole offsets about 13% of gross US greenhouse gas emissions. The sink has been shrinking as forests age and disturbances increase.
Federal forests matter most for carbon in the West. They hold 17.2 petagrams of carbon, 33% of the national stock, and about two thirds of the West’s forest carbon. Trees also clean the air, a benefit that shows up in city numbers: urban forests deliver $18.3 billion in annual value, including $5.4 billion from removing air pollution. For air quality data across the country, read air pollution statistics in the US. Better stocking of existing forestland could add about 20% to annual sequestration.
Timber, Forest Products & Jobs in the US 2026
Jobs tied to forest products and softwood lumber (scale: 950,000 = 40 blocks)
Forest products industry (upper estimate)    ██████████████████ 950,000
Softwood lumber industry, direct and indirect ██████████████ 775,000
| Metric | Value (Period) |
|---|---|
| Timberland | 514 million acres |
| Timberland owned privately | 70% |
| Forest products industry employment | About 925,000 to 950,000 |
| Softwood lumber jobs, direct and indirect | More than 775,000 (since 2020) |
| Forest growth vs harvest | Growth has exceeded harvest every year since the 1940s |
| U.S. tariff on timber and lumber from Canada | 10%, plus anti-dumping and countervailing duties |
| U.S. tariff on wood products from Canada | 25% |
| Wood product manufacturing establishments in Canada | 6,414 (2025) |
| Lumber exports from Canada, February 2026 vs 2024 | About 20% lower |
Data source: North American Forest Foundation, Tree & Wood Facts (2024 to 2025); USDA Forest Service Indicator 2.10; Congressional Research Service, U.S.-Canada Trade Relations (September 2026); Bank of Canada (April 2026); Statistics Canada via Innovation, Science and Economic Development Canada.
The forest products industry employs about 925,000 to 950,000 people, and the softwood lumber sector alone has supported more than 775,000 direct and indirect jobs since 2020. Growth has exceeded harvest in every year since the 1940s, so stocks keep rising even as timber is cut. Private owners supply most of the wood from 514 million acres of timberland.
Trade policy now shapes the lumber market. The US charges a 10% tariff on timber and lumber from Canada, on top of anti-dumping and countervailing duties, and 25% on wood products. Canadian lumber exports were about 20% below 2024 levels by February 2026. Canada’s 6,414 wood product establishments sit on the other side of that trade. Readers can follow the Canadian side in Canada manufacturing statistics, which covers sales, output, and tariff exposure.
Frequently Asked Questions About US Forest 2026
How much of the US is covered by forest?
About 765 million acres, or 34% of US land, are forest, according to the Forest Service’s last comprehensive assessment. Some 2026 summaries use 751 million acres because of definition differences.
Which state has the most forest by percentage?
Maine is 89.06% forested, followed by New Hampshire at 83.04%, West Virginia at 78.05%, and Vermont at 76.47%.
Which state has the least forest?
North Dakota is 1.82% forested, followed by Nebraska (3.12%), South Dakota (4.02%), and Kansas (4.83%).
Who owns US forests?
Private owners hold about 412 million acres, 56% of forest land. The federal government holds 238.4 million acres, and state, local, and tribal governments hold the rest.
How big is the National Forest System?
193 million acres, made up of 154 national forests and 20 national grasslands, plus one national prairie.
How many trees are in the US?
Nearly 1.4 trillion trees stand on forestland in the lower 48 states, according to the national forest inventory.
How much carbon do US forests store?
About 58.7 billion metric tons of carbon, with 54% in soil and 26% in aboveground biomass (2019 data).
How much carbon do US forests remove each year?
An estimated 759.2 million metric tons of CO2 equivalent in 2024, down from higher levels in earlier years. The land sector offsets about 13% of gross US emissions.
How many acres did wildfires burn in 2025?
5,131,474 acres across 77,850 fires, down 43% from 8.92 million acres in 2024.
How many acres have burned in 2026?
About 8.1 million acres across 51,774 fires as of late September 2026, above the average for the date.
Which state had the most wildfire acres in 2025?
Alaska, with 1,006,158 acres, followed by California (505,994) and Arizona (326,813).
How many people work in the forest products industry?
About 925,000 to 950,000 people. The softwood lumber sector alone has supported more than 775,000 direct and indirect jobs.
Is US forest area shrinking?
Total forest area has stayed near 765 million acres for more than a century. Local losses to development and fire are offset by regrowth and former farmland returning to forest.
How much timberland does the US have?
514 million acres, about 67% of forest land. Private owners hold 70% of it.
Disclaimer: The data research report we present here is based on information found from various sources. We are not liable for any financial loss, errors, or damages of any kind that may result from the use of the information herein. We acknowledge that though we try to report accurately, we cannot verify the absolute facts of everything that has been represented.