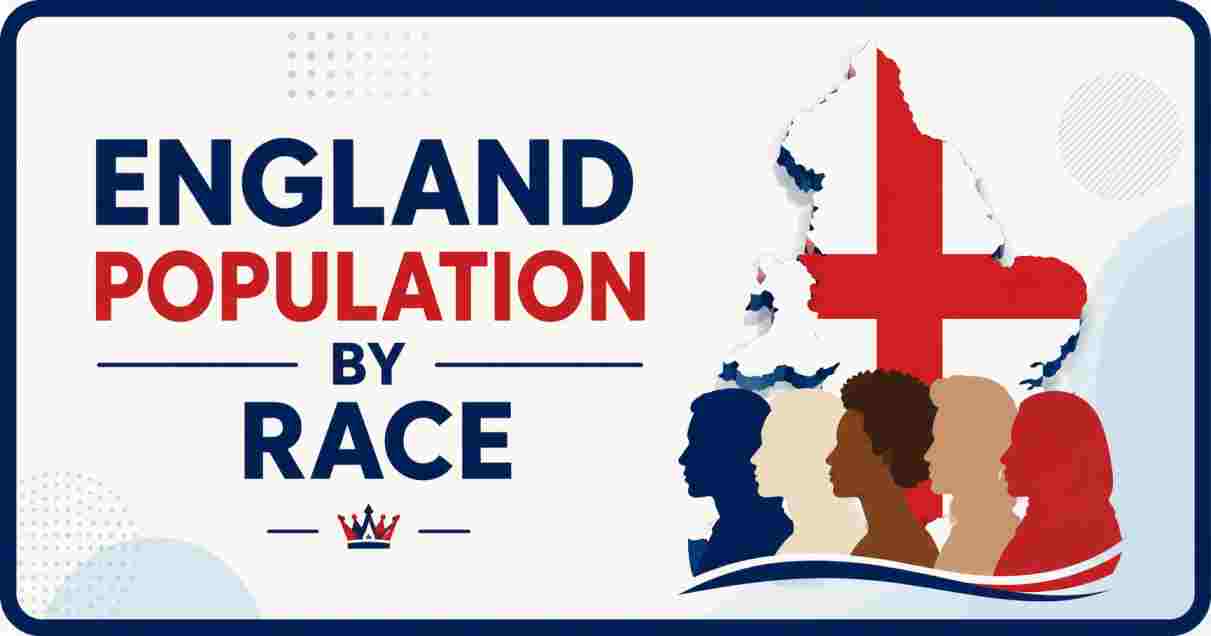
England’s Population by Ethnic Group in 2026
England has undergone one of the fastest demographic transformations of any large European nation over the past seventy years, and the 2026 picture reflects decades of accumulated change built on the 2021 Census. With a population of 56,489,800 at the last count, England’s ethnic composition has shifted from an overwhelmingly White British population in the mid-20th century to one where roughly 19% of residents now identify with an ethnic minority background, a proportion that varies enormously depending on which part of the country is being examined.
This report covers the full range of population-by-race and ethnic group statistics for England in 2026, drawing on official Office for National Statistics census data to break down the national picture, regional variation, the cities where no single ethnic group holds a majority, and the longer-term trends reshaping England’s demographic makeup. Every figure below reflects the most current officially published data, noted clearly wherever a statistic covers England and Wales jointly rather than England alone, since that is how the census itself is conducted and published.
Interesting Facts About England Population by Race 2026
| Fact | Figure |
|---|---|
| Total population of England (2021 Census) | 56,489,800 |
| Ethnic minority background, England specifically | 19% |
| White British, England specifically | 73.5% |
| White ethnic group, England & Wales combined | 81.7% |
| Asian ethnic group, England & Wales combined | 9.3% |
| Black ethnic group, England & Wales combined | 4.0% |
| White British in London | 36.8%, the only English region below 50% |
| Non-white population growth, 1951–2021 (E&W) | 175,000 → 10.9 million, a 62-fold increase |
| MPs from ethnic minority backgrounds (2024 election) | around 90, roughly 14% of the Commons |
| Live births to mothers born outside the UK (2025, E&W) | 35.5% |
Source: Office for National Statistics, Census 2021
England’s ethnic composition in 2026 rests on a simple but significant headline: 19% of the population identifies with an ethnic minority background, up from just 5.9% when the ethnicity question was first asked in the 1991 Census. At the national England-and-Wales level, where the most granular official breakdowns are published, 81.7% of the combined population identifies as White, with Asian residents making up 9.3%, Black residents 4.0%, Mixed ethnicity 2.9%, and Other ethnic groups 2.1%, figures drawn from the 2021 Census conducted by the Office for National Statistics.
That national average, however, conceals dramatic regional variation. London stands alone as the only English region where White British residents make up less than half the population, at just 36.8%, while the non-white population of England and Wales combined has grown 62-fold since 1951, from around 175,000 people, less than 0.4% of the population, to 10.9 million, or 18.3%, by 2021. That transformation has been accompanied by growing political representation too, with roughly 90 Members of Parliament, about 14% of the House of Commons, coming from ethnic minority backgrounds following the 2024 General Election, the highest proportion in UK parliamentary history.
1. Total Population and Ethnic Minority Share in England 2026
England's Ethnic Minority Population Share, Selected Years
1991 |███                    5.9% (England & Wales)
2011 |████████████           16%
2021 |██████████████         19%
| Metric | Figure |
|---|---|
| England population, 2021 Census | 56,489,800 |
| England population, 2011 Census | 53,012,456 |
| Population growth, 2011–2021 | +3.48 million |
| Ethnic minority background, England (2021) | 19% |
| Ethnic minority background, Wales (2021) | 6.2% |
| Ethnic minority background, Scotland (2021/22) | 7% |
| Ethnic minority background, Northern Ireland (2021) | 4.4% |
Source: Office for National Statistics, Census 2021
England’s population reached 56,489,800 at the time of the 2021 Census, up from 53,012,456 a decade earlier, growth driven by a combination of natural increase and sustained net migration. Within that expanding population, 19% of England’s residents identified with an ethnic minority background in 2021, a figure that stands well above the equivalent shares recorded in Wales (6.2%), Scotland (7%), and Northern Ireland (4.4%), underlining how much more ethnically diverse England has become relative to the UK’s other constituent nations.
That 19% figure represents a striking shift from where England stood just three decades earlier. When the 1991 Census first introduced a formal ethnicity question, the combined non-white population of England and Wales stood at only 5.9%, roughly 3.0 million people. The subsequent growth to 19% in England specifically by 2021 reflects the cumulative effect of multiple waves of migration since the 1990s, including EU enlargement in the 2000s, sustained Commonwealth migration, and more recent arrivals from South Asia, East Asia, and Africa, layered on top of communities established in earlier decades.
2. Detailed Ethnic Group Breakdown in England and Wales 2026
Ethnic Group Share, England & Wales Combined (2021 Census)
White  |████████████████████████████████████████  81.7%
Asian  |████                                       9.3%
Black  |██                                         4.0%
Mixed  |█                                          2.9%
Other  |█                                          2.1%
| Ethnic Group | Share (England & Wales, 2021) | Population |
|---|---|---|
| White | 81.7% | 48.7 million |
| Asian, Asian British or Asian Welsh | 9.3% | 5.5 million |
| Black | 4.0% | — |
| Mixed | 2.9% | — |
| Other ethnic group | 2.1% | — |
| Total population, England & Wales | — | 59.6 million |
Source: Office for National Statistics, Census 2021
The most detailed official ethnicity breakdown published by the ONS covers England and Wales jointly, since the 2021 Census was conducted as a single combined exercise across both nations. That combined data shows 81.7% of the 59.6 million residents identifying as White, equivalent to 48.7 million people, down from 86.0% in 2011. The Asian, Asian British or Asian Welsh category was next largest at 9.3%, or 5.5 million people, and also recorded the largest percentage point increase of any high-level group since 2011, up from 7.5%.
Because Wales accounts for only around 5.4% of the combined population and is considerably less diverse than England, these combined figures sit very close to England’s own standalone percentages, though not identically. Black residents made up 4.0% of the combined population, Mixed ethnicity 2.9%, and Other ethnic groups 2.1%. Within the broader White category, the ONS also tracks 19 detailed sub-groups, including White British, White Irish, White Roma (added in 2021), and White Other, each following markedly different growth trajectories over the past two decades.
3. The Declining White British Share in England 2026
White British Share of England & Wales Population
2001 |████████████████████████████████████████  87.5%
2011 |████████████████████████████████████      80.5%
2021 |█████████████████████████████████         74.4%
| Census Year | White British Share (England & Wales) |
|---|---|
| 2001 | 87.5% |
| 2011 | 80.5% |
| 2021 | 74.4% |
| Decline, 2001–2021 | 13.1 percentage points |
| Approximate population, 2021 | 44.4 million |
Source: Office for National Statistics, Census 2021
The single largest ethnic group in England and Wales, White British, has recorded a consistent and substantial decline across the last three census periods. It stood at 87.5% of the population in 2001, fell to 80.5% by 2011, and dropped further to 74.4%, roughly 44.4 million people, by 2021, a total decline of 13.1 percentage points over two decades. Despite that decline in share, White British remains by a wide margin the single largest ethnic group recorded in the census, well ahead of any other individual category.
The ONS attributes this shift to a combination of factors rather than any single cause: sustained net migration into England from both EU and non-EU countries, generally higher birth rates among some more recently arrived migrant communities relative to the settled White British population, and the natural process by which children of mixed or non-White British parentage are recorded under different census categories than their White British parent. Demographers studying the trend note it mirrors patterns seen across most large Western European countries over the same period, rather than representing something unique to England specifically.
4. Growth of the White Other Ethnic Group in England 2026
White Other Ethnic Group Share, England & Wales
2011 |███████████████  4.4%
2021 |█████████████████████  6.2%
| Metric | Figure |
|---|---|
| White Other share, 2011 | 4.4% |
| White Other share, 2021 | 6.2%, the largest percentage point rise of any group |
| Largest foreign-born group, England & Wales | India-born, 920,400 people |
| Second-largest foreign-born group | Poland-born, 743,100 people |
| “Any other ethnic background” count, 2001 | 219,800 |
| “Any other ethnic background” count, 2021 | 923,800 |
Source: Office for National Statistics, Census 2021
Among all the detailed ethnic categories tracked by the ONS, the White Other group, which captures White residents who do not identify as English, Welsh, Scottish, Northern Irish, British, or Irish, recorded the single largest percentage point increase of any group between the 2011 and 2021 censuses, climbing from 4.4% to 6.2% of the England and Wales population. Much of that growth traces back to EU enlargement in the 2000s, when Poland and seven other countries joined the EU and the UK opened its labour market immediately; Poland-born residents now form the second-largest foreign-born population in England and Wales at 743,100 people, trailing only India-born residents at 920,400.
A separate but related category, “any other ethnic background,” which captures people who did not identify with any of the standard tick-box options, has grown even more dramatically in relative terms, rising from 219,800 people in 2001 to 333,100 in 2011 and then to 923,800 by 2021, nearly a 180% increase in just the most recent decade alone. Demographers attribute part of that jump to growing awareness and use of write-in response options introduced in the 2021 Census, alongside genuine growth in mixed and less conventionally categorised ethnic identities among England’s population.
5. London’s Ethnic Diversity in England 2026
White British Share by Selected Area
England (national average) |███████████████████████████████████  73.5%
London                        |██████████████████                   36.8%
| London Diversity Metric | Figure |
|---|---|
| White British share of London’s population | 36.8%, only region below 50% |
| Asian share of London’s population | 20.7% |
| Black share of London’s population | 13.5% |
| Mixed ethnicity share of London’s population | 5.7% |
| Other ethnic groups share of London’s population | 6.2% |
| Non-White British share of London overall | 63.2% |
Source: Office for National Statistics, Census 2021
London stands apart from every other region of England on ethnic diversity, and by a considerable margin. It is the only English region where White British residents make up less than half the population, at just 36.8%, meaning 63.2% of Londoners identify with a different ethnic background. Within that non-White British majority, 20.7% of Londoners identify as Asian, 13.5% as Black, 5.7% as Mixed ethnicity, and 6.2% with Other ethnic backgrounds, making the capital one of the most ethnically diverse major cities anywhere in Europe.
This level of diversity has developed over several decades and reflects London’s long-standing role as the UK’s primary destination for both international migration and internal migration from other parts of the country. The city’s diversity has continued increasing steadily over the past three decades according to ONS trend data, driven by London’s global financial and cultural significance, its established immigrant communities that continue to attract new arrivals through family and social networks, and its position as the primary entry point for many new arrivals to the UK before any onward movement to other regions.
6. No-Majority Cities in England 2026
Cities Where No Single Ethnic Group Holds a Majority
London     |████  White British 36.8%
Birmingham |██████  White population just below 50%
Leicester  |███████  White British a minority
Manchester |████████  No majority ethnic group
| City | Status |
|---|---|
| London | White British 36.8%, no majority group |
| Birmingham | White population just below 50% |
| Leicester | One of the first English cities where White British became a minority |
| Manchester | Formally classified as a “no majority” city |
Source: Office for National Statistics, Census 2021
Beyond London, several other major English cities have crossed the threshold where no single ethnic group makes up more than half the population, a status demographers formally describe as “no majority.” Birmingham, England’s second-largest city, saw its White population fall to just below 50% in the 2021 Census, while Leicester became one of the first cities in the country where the White British population specifically dropped into minority status, a milestone reached earlier than in most comparably sized English cities. Manchester has also been formally classified as a no-majority city based on 2021 Census data.
This pattern of major urban centres becoming ethnically plural, with population increasingly split across several sizeable groups rather than dominated by any single one, reflects the long-term concentration of immigration and its descendant communities in England’s largest employment and educational hubs. Researchers note this shift has generally occurred gradually and incrementally over several census cycles rather than suddenly, following broadly similar diversification patterns already seen in London roughly a generation earlier, with each subsequent city reaching similar diversity milestones a decade or two behind the capital.
7. Regional Ethnic Diversity Across England 2026
Ethnic Minority Background Share by Region
London              |█████████████████████████████████████  63.2% non-White British
West Midlands       |███████████████████████                  29.4%
England average     |██████████████                            19%
North East          |█████                                      lowest diversity region
| Region | Ethnic Minority Background Share |
|---|---|
| London | 63.2% non-White British |
| West Midlands | 29.4%, second most diverse region |
| England (national average) | 19% |
| North East England | Among the least ethnically diverse regions |
Source: Office for National Statistics, Census 2021
Regional variation across England extends well beyond the London-versus-everywhere-else divide. The West Midlands ranks as the second most ethnically diverse English region, with 29.4% of residents from minority ethnic backgrounds, driven substantially by sizeable Asian (13.3%) and Black (4.5%) populations concentrated in Birmingham, Coventry, and Wolverhampton. At the opposite end of the spectrum, North East England remains among the least ethnically diverse regions in the country, with a White British population share considerably above the 73.5% England-wide average.
This uneven regional distribution reflects historical settlement patterns dating back to the post-war era, when Commonwealth migrants were drawn disproportionately toward industrial cities offering manufacturing employment, London’s financial and service sectors, and university towns, while regions with less industrial and commercial pull, particularly in the North East and rural parts of the country, saw comparatively little inward migration by comparison. Those historical patterns have proven durable, with established communities continuing to draw new arrivals toward the same regions through family reunification and social networks even as the underlying drivers of the original migration waves have shifted considerably over the decades since.
8. Historical Growth of England’s Non-White Population 2026
Non-White Population, England & Wales (Selected Years)
1951 |█  175,000 (0.4%)
1991 |████  3.0 million (5.9%)
2021 |████████████████████████████████████████  10.9 million (18.3%)
| Year | Non-White Population (England & Wales) | Share |
|---|---|---|
| 1951 | ~175,000 | under 0.4% |
| 1991 | ~3.0 million | 5.9% |
| 2011 | — | ~14% |
| 2021 | 10.9 million | 18.3% |
Source: Office for National Statistics, Census 1991–2021
England’s transformation from a near-uniformly White population into today’s diverse society has unfolded over roughly seventy years. In 1951, the non-white population of England and Wales stood at an estimated 175,000 people, under 0.4% of the total, a figure that had grown to around 3.0 million, or 5.9%, by the time the census first asked a direct ethnicity question in 1991. Growth continued steadily through subsequent decades, reaching 10.9 million people, 18.3% of the population, by the 2021 Census, a 62-fold increase across the full seventy-year span.
Several distinct historical episodes shaped this trajectory at different points, including the Commonwealth Immigrants Act of 1962, which introduced the first statutory restrictions on Commonwealth immigration, and the expulsion of roughly 80,000 Ugandan Asians by Idi Amin in 1972, of whom approximately 27,000 arrived and settled in the UK over the following months. More recent growth has been driven substantially by EU free movement following the 2004 EU enlargement and by sustained migration from South Asia, though researchers note that after the 2016 Brexit referendum, some categories of European migration to the UK began to decline, even as overall diversity continued increasing through other migration channels.
9. Political Representation and Births by Ethnic Background in England 2026
Ethnic Minority MPs in the House of Commons
2024 General Election |██████████████  ~14% of MPs (record high)
| Metric | Figure |
|---|---|
| MPs from ethnic minority backgrounds, 2024 election | around 90, roughly 14% of the Commons |
| Live births to mothers born outside UK, 2025 (E&W) | 35.5% |
| Live births with at least one parent born outside UK, 2025 (E&W) | 41.1% |
| Ethnic minority councillors, national representation (2013) | 13% |
Source: House of Commons Library, Office for National Statistics
Political representation of ethnic minority communities in England has climbed to its highest level in parliamentary history. Following the 2024 General Election, approximately 90 Members of Parliament, around 14% of the House of Commons, come from ethnic minority backgrounds, a figure that reflects both the growing size of these communities nationally and their increasing concentration in urban constituencies where political engagement and representation have historically developed fastest. That figure has grown steadily from far lower levels of representation recorded in earlier decades, when ethnic minority representation in both Parliament and local councils lagged well behind the underlying population share.
Birth statistics offer a further window into how England’s ethnic composition is likely to continue evolving. In 2025, 35.5% of live births in England and Wales were to mothers born outside the UK, and for 41.1% of births, at least one parent was born outside the UK, figures the ONS publishes as part of its ongoing birth registration statistics. These birth patterns, combined with continued net migration, mean the demographic shifts documented across the past three census periods are highly likely to continue into the next census, due in 2031, even as the specific countries driving migration to England keep evolving.
Disclaimer: The data research report we present here is based on information found from various sources. We are not liable for any financial loss, errors, or damages of any kind that may result from the use of the information herein. We acknowledge that though we try to report accurately, we cannot verify the absolute facts of everything that has been represented.