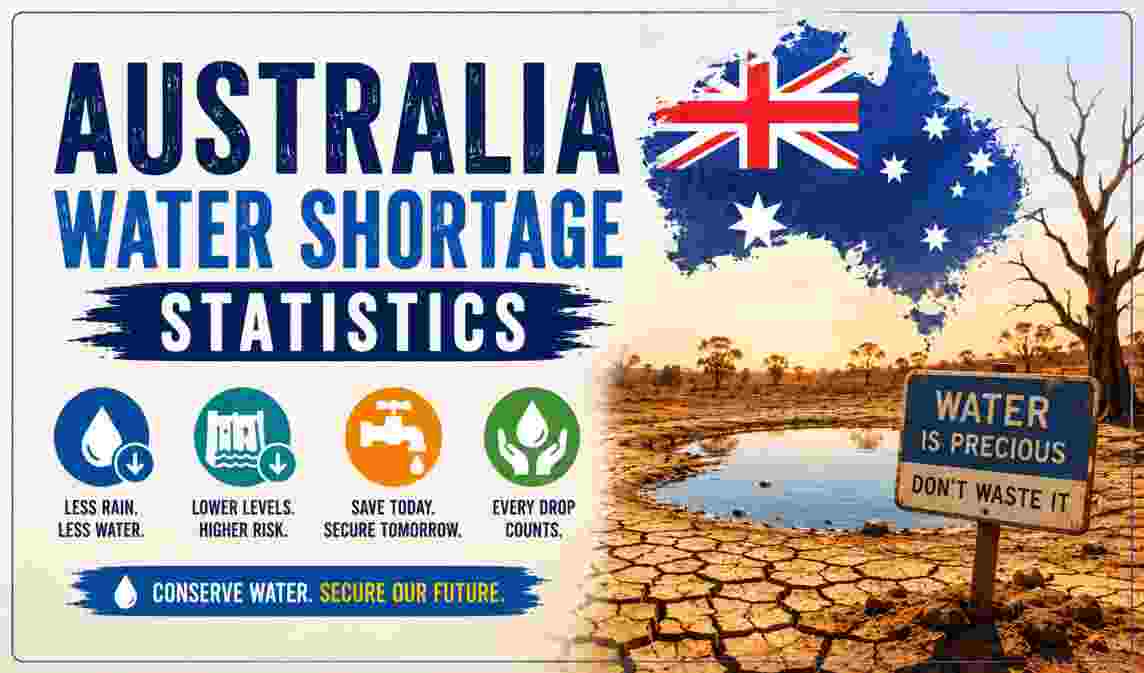
What is Australia’s Water Shortage Problem? Why It Matters Right Now
Australia is the driest inhabited continent on Earth, and in 2026 that distinction is no longer a geographic footnote — it is an active national emergency playing out in dam levels, dry riverbeds, and billion-dollar infrastructure budgets. The continent’s water crisis is driven by a lethal combination of long-term structural rainfall decline, surging population demand, and the accelerating fingerprint of climate change on weather patterns across the south and east. Since the mid-1970s, rainfall across south-western Australia has declined by approximately 15–20%, but the runoff effect on water storages has been catastrophically disproportionate: streamflow into Perth’s dams has fallen by over 80% over the same period. What took 100mm of rain to generate 10 billion litres of streamflow before 2000 now requires close to 500mm for the same yield. That single statistic tells you everything about the structural nature of Australia’s water predicament. In southern Australia, the current drought — which began in 2023 and is continuing into 2026 — has strained water supplies across Melbourne, Adelaide, and Perth, while north-eastern New South Wales recorded its second driest April on record in 2026, with rainfall just 13% of the 1961–1990 average.
The reason this matters beyond Australia’s borders — and the reason it carries urgency for every household, farmer, and city planner on the continent — is scale and trajectory. National water consumption increased 12.9% to 17,223 gigalitres in 2023–24, according to the Australian Bureau of Statistics, driven by both a drying agricultural year and population-driven household demand. The Murray-Darling Basin, which supplies one-third of Australia’s entire food production, is subject to a 2026 Basin Plan Review that acknowledges a long-term trend toward a hotter, drier future with tighter water allocations for irrigators. Meanwhile, the 2026 Infrastructure Priority List published by Infrastructure Australia flags water supply as a key national priority, identifying major desalination, groundwater, and recycled water projects across Perth, Darwin, and Queensland as urgent investments. The numbers in the sections below are not forecasts or modelled scenarios — they are the measured, published reality of Australia’s water system as of the first half of 2026.
Australia Water Shortage 2026 — Key Interesting Facts at a Glance
AUSTRALIA WATER CRISIS — FAST FACTS SNAPSHOT 2026
══════════════════════════════════════════════════════════════════
  Driest inhabited continent    ████████████████████████  CONFIRMED
  Perth streamflow decline      ████████████████████████  -80% since 1975
  NSW April 2026 rainfall       ██░░░░░░░░░░░░░░░░░░░░░░  13% of avg
  Southern AUS drought begun    ████████████████░░░░░░░░  2023 → 2026
  National water use (2023-24)  ████████████████████████  17,223 GL
  South AU cool-season dry yrs  ████████████████████░░░░  26 of 32 yrs
══════════════════════════════════════════════════════════════════
| Fact | Detail |
|---|---|
| Australia’s classification | The driest inhabited continent on Earth |
| Current drought (south) | Began 2023; continuing into 2026 — affecting Melbourne, Adelaide, Perth |
| NSW April 2026 rainfall | Second driest April on record (since 1900); just 13% of the 1961–1990 average |
| Southern Australia cool-season dry trend | Below-average April–October rainfall in 26 of the 32 years from 1994 to 2025 |
| Perth streamflow loss | Over 80% decline in streamflow since the mid-1970s |
| Perth dam streamflow (pre-1975 avg) | 420 GL per year; now expected at only ~25 GL per year |
| WA South West rainfall decline | ~15–20% average decline since the 1970s |
| WA groundwater loss | Over 1,000 GL of aquifer storage lost from Gnangara Mound since 1980 |
| National water consumption (2023–24) | 17,223 gigalitres — up 12.9% year-on-year (ABS) |
| Agriculture share of water use | Agriculture, forestry & fishing: 11,760 GL in 2023–24 — up 14.6% |
| Household water use (2023–24) | 1,868 GL nationally; 174 kL per household (down from 190 kL in 2015–16) |
| Melbourne storages (June 2026) | 63% full — down 10% on the same time last year |
| Victoria statewide storages (June 2026) | 47% full — down 9% year-on-year |
| MDB reserve requirement | Required reserve stands at 206 gigalitres for the next water year |
| WA water investment (2026–27) | Record AUD $2.7 billion water infrastructure budget for 2026–27 |
Source: Bureau of Meteorology (BoM), Australian Bureau of Statistics (ABS), Water Corporation WA, Victorian Water
These headline facts expose a water system under accelerating stress on multiple fronts simultaneously. The combination of NSW recording its second driest April since 1900 while Victoria’s statewide storages drop 9% year-on-year and Perth’s dams rely on streamflow that has collapsed by over 80% since the 1970s paints a consistent picture: Australia’s water crisis is not a single weather event but a structural, climate-driven deterioration affecting every major population centre and agricultural region. The long-term signal from the Bureau of Meteorology is unambiguous — 26 of 32 cool seasons between 1994 and 2025 recorded below-average rainfall across southern Australia, and the shift is linked directly to climate change as documented in the Bureau’s own State of the Climate 2024 report.
The contrast between household efficiency gains and total system stress is one of the most telling features of the data. Household water use per person has fallen from 190 kL to 174 kL since 2015–16 — a genuine conservation success driven by awareness campaigns, pricing signals, and water-efficient appliances. Yet national water consumption still jumped 12.9% in 2023–24, driven by a drier agricultural year that forced farmers to draw heavily on storages and irrigation systems. That 12.9% national surge in a single year, set against a decade of household efficiency gains, illustrates why engineering solutions — desalination, recycled water, groundwater replenishment — are now the centrepiece of every state government’s water security strategy.
Australia Drought Statistics 2026 — Southern & Eastern Regions
DROUGHT INTENSITY — REGIONS AFFECTED (2026)
══════════════════════════════════════════════════════════════════
  North-eastern NSW         ████████████████████████  SEVERE (soil moisture: lowest 10%)
  SE Queensland             █████████████████░░░░░░░  SERIOUS
  Parts of Tasmania         ████████░░░░░░░░░░░░░░░░  DEFICIENCY
  Southern Victoria         ████░░░░░░░░░░░░░░░░░░░░  PATCHES
  Southern Australia        ████████████████████░░░░  24-MONTH DEFICIT
  Western Australia (SW)    █████████████████████░░░  LONG-TERM STRUCTURAL
══════════════════════════════════════════════════════════════════
  Drought started (south):  2023 | Ongoing as of June 2026
══════════════════════════════════════════════════════════════════
| Region / Indicator | Status (2026) | Data |
|---|---|---|
| North-eastern NSW into bordering QLD | Severe rainfall deficiency | Rainfall in the lowest 5–10% of all years since 1900 |
| NSW April 2026 rainfall | Second driest April on record | 13% of the 1961–1990 average |
| NE NSW root zone soil moisture | Very much below average | Lowest 10% of all Aprils since 1911 |
| Southern Australia current drought | Ongoing since 2023 | Continues into 2026; affecting Melbourne, Adelaide, Perth |
| Southern Australia cool-season dry record | Long-term trend | Below-average rainfall in 26 of 32 years from 1994–2025 |
| 24-month rainfall deficiency (southern AUS) | Persisting | Eased slightly in SA but intensified in Victoria |
| Streamflow across southern/SE Australia | Lower than average | Widespread at many monitoring sites |
| Some eastern/southern state storages | At or below 50% capacity | Bureau of Meteorology drought report, May 2026 |
| December 2025 – February 2026 | Extreme heat + record low rainfall | Southern Australia; drought continues |
| El Niño probability (mid-2026) | Up to 90% (some models) | BoM: neutral conditions shifting; El Niño possible |
| Murray-Darling Basin 2026 outlook | Below-average inflows | Jan–Mar 2026 inflow quantiles below historical averages |
| CSIRO projection (south MDB) | Runoff very likely to decline | Droughts very likely more frequent and longer — CSIRO SY 2025 |
Source: Bureau of Meteorology Drought Statement (May–June 2026), CSIRO Murray-Darling Sustainable Yields 2025, The Daily Perspective March 2026
The Bureau of Meteorology’s live drought monitoring as of early June 2026 is providing some of the most alarming readings of the current drought cycle. North-eastern New South Wales, extending into bordering parts of Queensland, is experiencing rainfall in the lowest 5–10% of all recorded years since 1900 — a benchmark that places conditions in the category of serious to severe drought. April 2026 soil moisture readings for this region ranked in the lowest 10% of all Aprils since 1911, meaning the ground itself has now entered critical deficit territory that will take sustained, consistent rainfall — not isolated storms — to reverse. Meanwhile the 24-month rainfall deficiency across southern Australia, which eased briefly in South Australia, has intensified slightly in Victoria and expanded in southern New South Wales, maintaining a broad continental drought footprint that has been building since 2023.
The El Niño risk hovering over the second half of 2026 adds another layer of concern that water managers are already planning for. The Bureau of Meteorology has confirmed that oceanic conditions are shifting from the La Niña state toward neutral, with El Niño possible by mid-2026 and some international climate models assigning probability as high as 90%. This is not a marginal risk. El Niño has historically produced Australia’s most punishing drought episodes — including the Millennium Drought (2001–2009) and the Tinderbox Drought (2017–2019) — and its potential arrival while current drought conditions are already established across the south and east would compound pressures that water storages, farm operations, and city supply systems are already absorbing.
Australia City Water Storage Levels 2026 — Melbourne, Perth, Victoria Statewide
CITY WATER STORAGE LEVELS — JUNE 2026
(% of Capacity)
══════════════════════════════════════════════════════════════════
  Melbourne (June 3, 2026)   ████████████░░░░░░░░░░░░  63% (-10% YoY)
  Victoria Regional          ████████░░░░░░░░░░░░░░░░  44% (-9% YoY)
  Victoria Statewide         ████████░░░░░░░░░░░░░░░░  47% (-9% YoY)
  SE QLD (North Pine adj.)   ██████████░░░░░░░░░░░░░░  ~54% adjusted
══════════════════════════════════════════════════════════════════
  Perth: Dams + groundwater + desalination (streamflow <10–15%)
══════════════════════════════════════════════════════════════════
| City / Region | Storage Level (2026) | Change vs Prior Year | Notes |
|---|---|---|---|
| Melbourne — 10 major reservoirs | 63% full | -10% on previous year | As at June 3, 2026 (Victorian Water) |
| Victoria — Regional storages | 44% full | -9% on previous year | June 3, 2026 (Victorian Water) |
| Victoria — Statewide | 47% full | -9% on previous year | June 3, 2026 (Victorian Water) |
| Melbourne desal contribution | 50 GL | July–Dec 2025 | Victorian Desalination Plant 2025–26 water order complete |
| Melbourne total storage capacity | 1,812 GL | Applied since July 2010 | 10 major reservoir system |
| Perth — Streamflow contribution | Only 10–15% of supply | vs ~100% pre-1975 | Remainder: groundwater + desalination |
| Perth — Expected annual streamflow | ~25 GL/year | Down from 420 GL pre-1975 | A 94% collapse vs the pre-1975 average |
| Perth — Alkimos Desalination Plant | AUD $2.8 billion investment | Capacity: 150 ML/day (~100 billion litres/year) | Under construction; climate-independent supply |
| SE Queensland — North Pine Dam | Reduced Full Supply Level (~54%) | Enacted January 28, 2025 | Level reduced due to dam improvement works |
| SA — Eyre Peninsula | Desalination plant targeting mid-2026 supply | SA Water: Uley South Basin licence reductions from mid-2026 | Billy Lights Point desal under development |
| Darwin region | Adelaide River Off-Stream Water Storage | Immediate priority — 2026 Infrastructure Priority List | Planning investment required for long-term security |
Source: Victorian Water (water.vic.gov.au, June 3, 2026), Water Corporation WA, SA Water, Infrastructure Australia 2026 Priority List, Seqwater
Melbourne’s water storages sitting at 63% and falling — 10 percentage points lower than the same time last year — is the headline number for Australia’s second-largest city as it enters the 2026 winter fill season. The timing matters enormously: winter months are when Melbourne’s catchments are supposed to receive the cool-season rainfall that historically replenished its reservoirs. But the Bureau of Meteorology’s July–September 2026 outlook shows only a 20–40% chance of exceeding median rainfall across most of Victoria, with the Hume region sitting below 20%. Against this backdrop, the Victorian Desalination Plant’s 50 GL contribution during the July–December 2025 period is the clearest evidence that Melbourne can no longer rely on rainfall catchments alone to maintain secure supply levels. Regional storages at just 44% — well below the statewide figure — reflect how acutely the drought is hitting communities outside the capital.
Perth’s situation is structurally different and in many ways more advanced as a case study in post-rainfall water security. The city has essentially already completed the transition that Melbourne and Adelaide are now beginning: rainfall and streamflow account for only 10–15% of Perth’s drinking water supply, with the remainder sourced from groundwater and two operating desalination plants, with a third — the $2.8 billion Alkimos Seawater Desalination Plant delivering 150 million litres per day — under construction. The fact that before 1975 Perth received 420 GL per year from streamflow and now expects only ~25 GL is not a crisis being managed — it is a crisis that has already fully materialised and forced a complete reinvention of how one of Australia’s major cities sources its water.
Australia Water Consumption Statistics 2026 — National Usage by Sector
WATER CONSUMPTION BY SECTOR — AUSTRALIA 2023–24
(Gigalitres, ABS)
══════════════════════════════════════════════════════════════════
  Agriculture/Forestry/Fishing ████████████████████████  11,760 GL (68%)
  Households                   ████░░░░░░░░░░░░░░░░░░░░   1,868 GL (11%)
  Other Industry               ████░░░░░░░░░░░░░░░░░░░░   3,595 GL (21%)
──────────────────────────────────────────────────────────────────
  TOTAL CONSUMPTION            ████████████████████████  17,223 GL
  (Up 12.9% on 2022-23's 15,258 GL)
══════════════════════════════════════════════════════════════════
| Sector / Metric | Volume | Change (YoY) | Notes |
|---|---|---|---|
| Total national water consumption (2023–24) | 17,223 GL | +12.9% | Up from 15,258 GL in 2022–23 (ABS) |
| Agriculture, forestry & fishing | 11,760 GL | +14.6% | Largest sector; utility-supplied water up 21% |
| Household water use — total | 1,868 GL | +6.2% | Up from 1,759 GL in 2022–23 |
| Household water use — distributed | 1,861 GL | — | 14.9% of national distributed water |
| Per-household water use (2023–24) | 174 kL/household | +4% | Up from 168 kL in wet 2022–23 year |
| Per-household water use (2015–16) | 190 kL/household | baseline | 8.5% efficiency gain over the decade |
| Industry water intensity (2023–24) | 7.04 ML per $m GVA | Up from 6.34 | Industries using more water per economic unit |
| NSW average annual water use | ~5,650 GL/year | 10-year avg (2014–24) | Varies sharply during drought years |
| Total self-extracted water | 58,447 GL | -14.2% | Drop driven by reduced hydroelectric demand |
| Hydroelectricity water use | 40,254 GL | -22.5% | Drier conditions in Tasmania reduced output |
| Lowest household use on record | 168 kL/household | 2022–23 | Wet La Niña year; gardens naturally irrigated |
| Agriculture water use — irrigated | Dominant national share | ~68–73% of total consumptive use | Murray-Darling Basin primary zone |
Source: Australian Bureau of Statistics — Water Account, Australia, 2023–24 (released December 11, 2025)
The ABS Water Account for 2023–24, released in December 2025, is the most comprehensive national snapshot of how Australia used water across its economy in the year when conditions began turning dry again after the La Niña wet years of 2021–22 and 2022–23. The 12.9% surge in national water consumption to 17,223 GL reflects both the structural demands of a dry agricultural year — farmers drawing down on historically high storages — and the behavioural reality that households increase outdoor water use when heat rises and gardens dry out. Agriculture’s 14.6% increase to 11,760 GL is the dominant driver, accounting for roughly two-thirds of all water consumed nationally, a proportion that has remained broadly consistent across decades despite efficiency improvements in irrigation technology.
The household efficiency story is genuinely encouraging and worth noting in full. Per-household water use has fallen 8.5% from 190 kL in 2015–16 to 174 kL in 2023–24, even as Australia’s population has grown significantly. The lowest on record was 168 kL per household in 2022–23 — the wet La Niña year when natural rainfall kept gardens green and reduced demand for supplemental irrigation. The uptick back to 174 kL in 2023–24 reflects hotter, drier conditions rather than behavioural backsliding. Critically, the Northern Territory continues to record the highest per-household consumption in the country, at around 0.33 ML per household in recent years, reflecting the climate extremes, lower-density living, and different water access patterns of the Territory compared with southern capitals where efficiency programs have been most concentrated.
Perth Water Security Statistics 2026 — Climate Impact, Infrastructure Response
PERTH STREAMFLOW COLLAPSE — 1975 vs TODAY
══════════════════════════════════════════════════════════════════
  Pre-1975 avg streamflow   ████████████████████████  420 GL/year
  2010–2018 average         ████░░░░░░░░░░░░░░░░░░░░  72.5 GL/year
  Now expected (~2026)      █░░░░░░░░░░░░░░░░░░░░░░░  ~25 GL/year
  2015 (record low)         ░░░░░░░░░░░░░░░░░░░░░░░░  15.8 GL/year
──────────────────────────────────────────────────────────────────
  Rainfall decline: ~15–20% → Streamflow decline: ~80%
  Rainfall now makes up only 10–15% of Perth's drinking water
══════════════════════════════════════════════════════════════════
| Perth / WA Indicator | Statistic | Notes / Year |
|---|---|---|
| Rainfall decline (South West WA) | ~15–20% | Since mid-1970s (Water Corporation WA) |
| Streamflow reduction | Over 80% decline | Since mid-1970s; from 420 GL to ~25 GL/year |
| Pre-1975 average streamflow | 420 GL/year | Enough to supply today’s 2M Perth residents |
| 2010–2018 average streamflow | 72.5 GL/year | Still a fraction of the historic average |
| Current expected annual streamflow | ~25 GL/year | Water Corporation WA, 2026 |
| Record lowest streamflow (2015) | 15.8 GL | Only enough water for ~14 hot summer days |
| Rainfall’s share of Perth’s supply | Only 10–15% | Rest: groundwater + desalination |
| Gnangara Mound groundwater loss | Over 1,000 GL | Since 1980; groundwater levels down up to 10 metres |
| WA South West rainfall reduction needed per 10 GL yield | ~500mm (vs 100mm pre-2000) | Catchments drier; soil absorbs more rain before runoff |
| Alkimos Desalination Plant investment | AUD $2.8 billion | 150 ML/day; net-zero emissions; under construction |
| WA water infrastructure budget (2026–27) | AUD $2.7 billion (record) | Part of AUD $6.4 billion 4-year capital works programme |
| Dampier Seawater Desalination Plant (Pilbara) | AUD $606 million | Largest single WA investment in 2026–27 budget |
| Regional Water Source Fund | AUD $52.9 million | For rural community water source planning (2026–27) |
| IWSS scheme coverage | 2.5 million+ residents | Perth, Peel region, Goldfields, parts of South West |
| Groundwater reduction target (Alkimos desal) | -30 billion litres/year | Preserving wetlands, parks, forests |
Source: Water Corporation WA (watercorporation.com.au), Western Australian Government, Smart Water Magazine April 2026
Perth stands as the most documented case study anywhere in the world of a major city forced to fundamentally reinvent its water supply system in direct response to climate-driven rainfall collapse. The numbers are stark: a 15–20% decline in rainfall has produced an 80% fall in streamflow — a non-linear amplification that occurred because drier soils absorb more of the water that does fall before any reaches rivers and dams. Before 2000, 100mm of rain reliably generated 10 billion litres of streamflow. That same 100mm now produces effectively nothing in runoff terms until soils are pre-saturated, which in a structurally drying climate happens with decreasing frequency. Perth’s 2015 record low of 15.8 GL — enough water to supply the entire city for only 14 hot summer days — crystallised in one number what the long-term data had been signalling for decades.
The Western Australian Government’s record AUD $2.7 billion water budget for 2026–27 — sitting within a AUD $6.4 billion four-year capital programme — reflects both the scale of the problem and the ambition of the response. The flagship Alkimos Seawater Desalination Plant, at AUD $2.8 billion, will add 150 million litres of climate-independent drinking water daily, and critically will allow Water Corporation to reduce groundwater extraction by 30 billion litres per year — beginning to reverse the 1,000 GL aquifer storage loss that has accumulated since 1980. The AUD $606 million Dampier Seawater Desalination Plant for the Pilbara marks the first time desalination has been deployed at this scale in regional Western Australia, reflecting that the water security imperative is no longer limited to metropolitan Perth alone.
Australia Water Infrastructure Investment Statistics 2026 — National Response
NATIONAL WATER INFRASTRUCTURE — KEY INVESTMENTS 2026
══════════════════════════════════════════════════════════════════
  WA 4-year capital programme   ████████████████████████  AUD $6.4 billion
  WA 2026-27 annual budget      ████████████████████████  AUD $2.7 billion (record)
  Alkimos Desal Plant (Perth)   ████████████████████████  AUD $2.8 billion
  Dampier Desal Plant (Pilbara) █████████████░░░░░░░░░░░  AUD $606 million
  Paradise Dam (QLD)            ████░░░░░░░░░░░░░░░░░░░░  $600M committed
══════════════════════════════════════════════════════════════════
  Infrastructure Australia 2026 Priority List: 68 nationally
  significant proposals; water supply flagged as key priority
══════════════════════════════════════════════════════════════════
| Project / Investment | Value | Status / Timeline |
|---|---|---|
| WA 4-year water capital works programme | AUD $6.4 billion | Water Corporation + Aqwest + Busselton Water |
| WA water infrastructure budget (2026–27) | AUD $2.7 billion (record) | Announced April 2026 — WA Government |
| Alkimos Seawater Desalination Plant, Perth | AUD $2.8 billion | Under construction; 150 ML/day; net-zero emissions |
| Dampier Seawater Desalination Plant, Pilbara | AUD $606 million | 2026–27 budget; largest Pilbara water investment |
| Regional Water Source Fund (WA) | AUD $52.9 million | Rural community water planning, 2026–27 |
| Integrated Water Supply Scheme (IWSS) upgrades | AUD $64.1 million | Strengthening existing and future IWSS sources |
| Paradise Dam, Queensland | $600 million+ committed | Immediate priority — 2026 Infrastructure Priority List |
| Darwin region — Adelaide River Off-Stream Storage | Immediate priority | 2026 Priority List; planning investment phase |
| Perth & South-West coast water security | Priority — 2–4 year pipeline | Desalination, recycled water, water recovery mix |
| SA — Billy Lights Point Desalination Plant | Under development | Targeting mid-2026 supply — Eyre Peninsula |
| National desalination capacity | Major cities all have desal | Further investment needed — Infrastructure Australia 2026 |
| Infrastructure Priority List total | 68 proposals | Water supply is a key national priority category |
Source: Infrastructure Australia 2026 Infrastructure Priority List (March 2026), Smart Water Magazine April 2026, Inside Water, SA Water, AWA
Infrastructure Australia’s 2026 Infrastructure Priority List — 68 nationally significant proposals released in March 2026 — frames the water investment agenda with unusual clarity for a federal policy document. Water supply is identified as a key national priority, with multiple projects spanning Queensland, Western Australia, South Australia, and the Northern Territory flagged as either immediate priorities for investment or near-term pipeline projects. The designation of Paradise Dam in Queensland as an immediate priority is significant: despite $600 million already committed by the Australian Government, Infrastructure Australia’s list indicates that further federal investment is required to bring the dam to full safety compliance while also meeting growing agricultural water demand in a state whose population and irrigation needs are both expanding rapidly.
The strategic logic across all these investments is the same: climate-independent water sources — desalination, recycled water, groundwater replenishment, and off-stream storage — are replacing traditional reliance on rainfall catchments across every state and territory. The Inside Water sector report for 2026 captures the shift precisely: planning conversations across Australian water utilities have moved from individual asset pipelines to entire portfolio sequencing, with utilities comparing notes on how to plan resilient infrastructure when one region is inundated while another faces drought. The water sector’s transformation, in the words of Australian Water Association CEO Adam Lovell, “will probably last for a decade” — and the investment numbers confirm that governments at every level have now accepted that reality.
Australia Climate Change & Long-Term Water Outlook 2026 — CSIRO & BoM Data
LONG-TERM WATER OUTLOOK — KEY PROJECTIONS
══════════════════════════════════════════════════════════════════
  Southern AUS rainfall (future) ████░░░░░░░░░░░░░░░░░░░░  Likely more variable
  Murray-Darling runoff          ████░░░░░░░░░░░░░░░░░░░░  Very likely to decline
  MDB drought frequency          ████████████████████████  Very likely to increase
  MDB groundwater recharge       ████░░░░░░░░░░░░░░░░░░░░  Likely to decrease
  Global water scarcity cost     ████████████████████████  $323B+ annually
  AUS population by 2030         ████████████████████████  ~30 million
══════════════════════════════════════════════════════════════════
  Upper atmosphere jet stream shift = structural cause of southern
  Australia drying — UTS research, February 2026
══════════════════════════════════════════════════════════════════
| Projection / Climate Indicator | Finding | Source / Year |
|---|---|---|
| Murray-Darling Basin runoff trend | Very likely to decline, particularly in the south | CSIRO Sustainable Yields 2025 |
| MDB drought frequency | Very likely to become more frequent and severe, and longer duration | CSIRO SY 2025 |
| MDB groundwater recharge | Projected to decrease, especially in the southern Basin | CSIRO SY 2025 |
| MDB heavy rainfall events | Very likely to become more intense | CSIRO SY 2025 |
| Southern Australia rainfall (2026 season) | Below-average April–October for 26 of 32 years (1994–2025) | Bureau of Meteorology |
| Upper atmosphere shift | Jet stream contraction toward higher southern latitudes driving southern drought | UTS Research, February 2026 |
| Global economic cost of water scarcity | Over $323 billion annually | World Business Council for Sustainable Development |
| Australia population projection | ~30 million by 2030 | Australian Bureau of Statistics |
| WA heat-related deaths (Perth) | May rise ~60% by 2050 | Climate projections, 2024 |
| MDB — share of national food production | One-third of Australia’s food | Murray-Darling Basin Authority |
| MDB — gross value of irrigated agriculture | Reduced by 9–29% under declining streamflow scenarios | ANU Global Water Forum, 2025 |
| Northern MDB streamflow decline | Increased water diversions having as big an impact as climate change | Journal of Hydrology: Regional Studies, 2025 |
Source: CSIRO Murray-Darling Sustainable Yields 2025, Bureau of Meteorology, UTS February 2026, ANU Global Water Forum 2025
The science underpinning Australia’s water trajectory in 2026 is now more granular and more concerning than at any previous point. CSIRO’s Murray-Darling Basin Sustainable Yields 2025, commissioned to inform the 2026 Basin Plan Review, delivers verdicts that leave little room for optimism in the short term: runoff and water availability are very likely to decline across the southern Basin, droughts are very likely to become more frequent, severe, and longer, and groundwater recharge is projected to decrease — the trifecta of worsening supply conditions converging on the region that produces one-third of Australia’s food. Modelling suggests the gross value of irrigated agriculture in the northern MDB catchments could fall by 9–29% depending on streamflow scenario, a range that encompasses potentially catastrophic losses for communities that have no economic alternative to water-dependent farming.
Equally important is the mechanistic explanation published by University of Technology Sydney researchers in February 2026, identifying the upper atmospheric jet stream’s contraction toward higher southern latitudes as the driver of the persistent drying across southern Australia and the simultaneous increase in flooding in the north and east. This is not random climate variability — it is a systematic reorganisation of the atmospheric circulation system that produced Australia’s rainfall patterns across the 20th century. The implication is that the below-average cool-season rainfall across southern Australia that has now occurred in 26 of the 32 years since 1994 is not a temporary anomaly but a permanent structural feature of the continent’s new climate regime. Australia’s population reaching approximately 30 million by 2030, against this drying backdrop, means water demand pressure will intensify precisely as natural supply continues to contract — making the current wave of infrastructure investment not just prudent but existentially necessary.
Disclaimer: The data research report we present here is based on information found from various sources. We are not liable for any financial loss, errors, or damages of any kind that may result from the use of the information herein. We acknowledge that though we try to report accurately, we cannot verify the absolute facts of everything that has been represented.