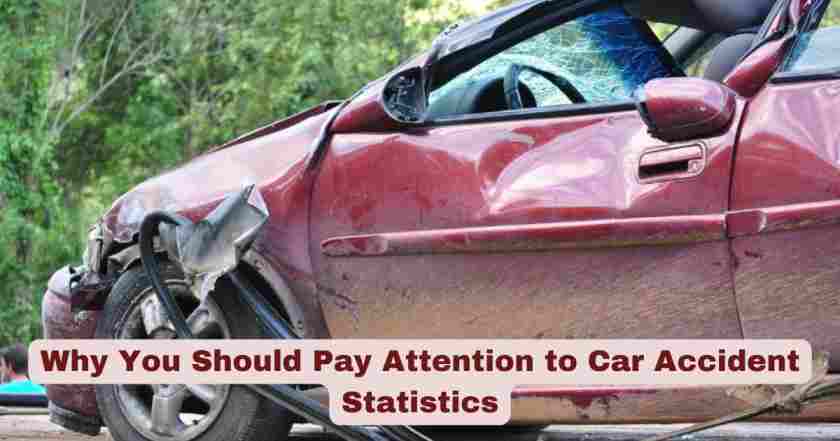
Nobody wakes up excited to read about car accidents. It’s a heavy topic. But then, these crashes are happening every single day, everywhere, and they’re not just news stories or random stats in a report. They’re real people, with real lives and real consequences that hit way harder than most of us realize.
We don’t look at this stuff to scare ourselves or others. We look at it to understand what’s going on out there. To see what the patterns are, what’s causing the damage, and how we can stay one step ahead of it. And the easiest way to do that is to pay attention to car accident statistics.
The Most Common (Yet Avoidable) Causes of Accidents
Let’s not pretend like accidents are always out of our control. According to the stats, around 90% of all car crashes are caused by human error. Mechanical failures and bad weather only account for about 10%.
So what’s going wrong?
Distractions top the list. That could mean texting, changing the music, eating, zoning out, or anything that pulls your attention off the road. In 2022 alone, distracted driving was tied to over 3,000 deaths.
Then there’s speeding and drunk driving, both of which kill thousands every year. In 2023, speeding alone was linked to over 11,000 fatalities. Drunk driving was roughly the same. These are predictable causes of crashes, the kind of stuff the stats keep shouting about.
The point here isn’t to judge anyone. It’s to call attention to the fact that the riskiest stuff we do on the road is also the stuff we can stop doing. And knowing what the stats say gives us that clarity.
Who’s Most at Risk
Another thing car accident statistics help us see clearly is who is getting hurt the most, and the reasons are not always what you’d expect.
Teen drivers, for instance, have some of the highest crash rates. That’s not just because they’re inexperienced. It’s also because they tend to take more risks, like using their phones while driving or feeling invincible behind the wheel. In 2023, over 3,048 minors under age 20 died in car crashes. That number shouldn’t exist.
At the other end of the age spectrum, older adults also face higher risks, but for different reasons, including slower reaction times, poorer vision, and maybe medical issues. As people age, those changes add up, and the risk of serious injury in a crash increases dramatically.
There’s also a gender gap in the numbers: men are about three times more likely to be involved in fatal crashes than women. And a lot of that ties back to risky behavior like speeding or aggressive driving.
Even socioeconomic status plays a role. People in lower-income communities are more likely to be in crashes and less likely to have access to safe vehicles, quality infrastructure, or proper emergency care afterward.
These patterns are signposts pointing to where we need better education, better support, and better systems. If we know who’s at risk, we can actually do something about it.
What the Patterns Teach Us About Prevention
Once we know what causes most accidents, who is at risk, and what actions reduce that risk, we can start thinking about prevention not just as a personal choice but as a system-wide responsibility.
That’s where the safe system approach comes in. Instead of blaming people for every crash, this method looks at how the roads, vehicles, and rules can be designed to make mistakes less deadly. It assumes people will mess up sometimes but builds protections around that reality. Things like safer speed limits, better road signage, crash-friendly car designs, and stricter enforcement all matter.
But the system can only do so much. The choices drivers make day to day matter as well. If you want to avoid becoming part of the wrong side of car accident statistics, those are the choices that matter most.


