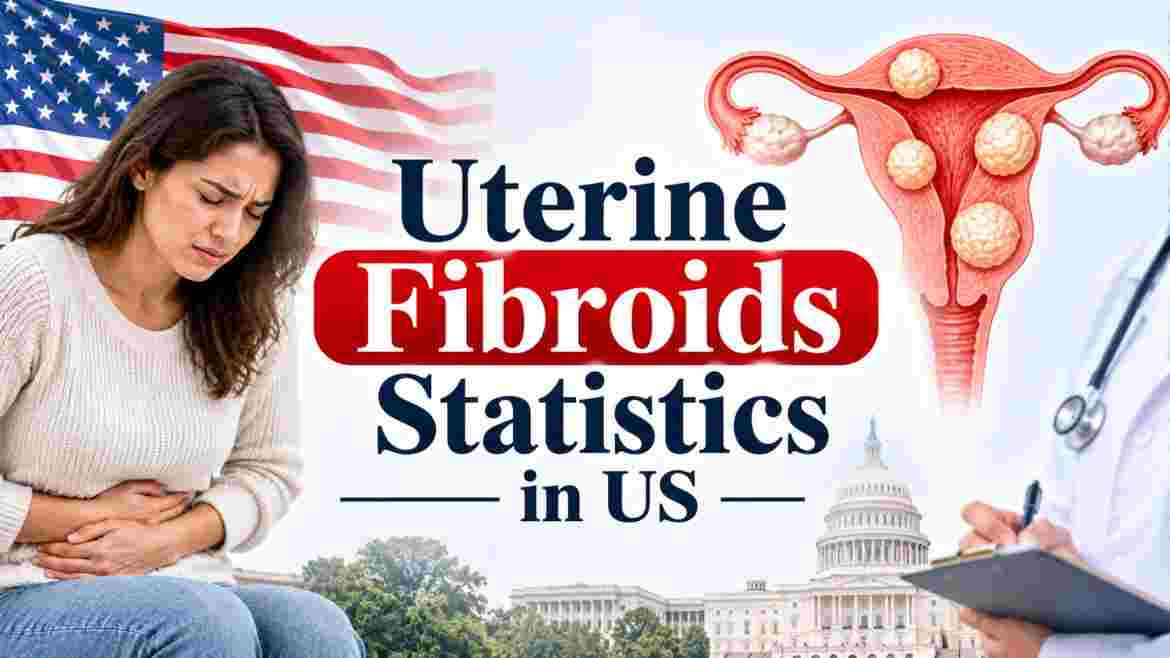
Uterine Fibroids Statistics in US 2026 show that 7.8% of women ages 20 to 49 reported a fibroid diagnosis in 2022-2023, a share that rises to 15.8% among women ages 40 to 49 and 12.5% among Black women, while researchers estimate that 70% to 80% of women develop fibroids by age 50. The condition costs the country up to $42.2 billion a year.
Uterine Fibroids in US 2026 – Introduction
Uterine Fibroids Statistics in US data tell two stories at once. Fibroids are noncancerous growths in or on the wall of the uterus, and most women who have them never learn it. Peer-reviewed estimates say 70% to 80% of women develop fibroids by age 50. Yet a July 2026 CDC report found that only 7.8% of women ages 20 to 49 had ever received a diagnosis.
The CDC report uses the 2022-2023 National Survey of Family Growth and covers 4,856 women. It breaks diagnosis rates down by age, race, education, insurance and fertility problems. This report pulls those figures together with hospital data, cost studies and research funding numbers. Every figure reflects data available on November 19, 2026.
Interesting Facts About Uterine Fibroids in US 2026
| Fact | 2026 Data |
|---|---|
| Women ages 20-49 ever diagnosed with fibroids | 7.8% |
| Black women ages 20-49 diagnosed | 12.5% |
| Women ages 40-49 diagnosed | 15.8% |
| Estimated share of women with fibroids by age 50 | 70%-80% |
| Women with fibroids reporting current fertility problems | 25.4% (19.0% without fibroids) |
| Share of hysterectomies tied to fibroids | 30%-50% |
| Estimated annual US economic burden | Up to $42.2 billion |
| NIH fibroid research funding, 2019 | About $17 million |
Source: Centers for Disease Control and Prevention (CDC), National Center for Health Statistics, Health E-Stat 121, July 2026; National Institutes of Health (NIH); Seminars in Reproductive Medicine, 2017; Reproductive Sciences, 2024.
The table mixes two kinds of numbers. The 7.8%, 12.5% and 15.8% figures come from a national survey that asked women whether a clinician ever told them they had fibroids. The 70%-80% figure is a lifetime estimate based on imaging and pathology studies.
The remaining rows show the stakes. Women with fibroids report fertility problems at 25.4%, against 19.0% for women without them. Fibroids drive up to 50% of hysterectomies. The yearly cost reaches $42.2 billion, yet NIH research funding for fibroids was only about $17 million in 2019.
How Common Are Uterine Fibroids in the US 2026
| Measure | Figure |
|---|---|
| Women ages 20-49 ever diagnosed (2022-2023) | 7.8% |
| Estimated women with fibroids by age 50 | 70%-80% |
| US women affected during reproductive years | About 26 million |
| Women with symptoms | About 15 million |
| Growth in women with fibroids, 2010 to 2022 | 10.6% |
Source: Centers for Disease Control and Prevention (CDC), NCHS Health E-Stat 121, July 2026; congressional findings in H.R. 4395, 119th Congress; Reproductive Sciences, 2024.
The CDC survey puts diagnosed fibroids at 7.8%, close to the 8.7% for polycystic ovary syndrome and above the 6.2% for endometriosis. The lifetime estimate sits roughly ten times higher at 70%-80%. Congressional findings cite about 26 million affected women and 15 million with symptoms. The National Institute of Child Health and Human Development uses a more cautious line: about 1 in 2 women develop fibroids before menopause.
Population growth adds to the load. The number of US women with fibroids rose 10.6% between 2010 and 2022. Any claim that 7.8% of women have fibroids is wrong. That figure counts diagnoses among women 20 to 49 only, and it leaves out women who have fibroids but no diagnosis.
Uterine Fibroids by Age Group in the US 2026
| Age Group | Diagnosed with Fibroids | 95% Confidence Interval |
|---|---|---|
| 20-29 | 1.4% | 0.8%-2.3% |
| 30-39 | 6.7% | 5.3%-8.3% |
| 40-49 | 15.8% | 13.4%-18.4% |
| No live births | 5.1% | 3.9%-6.4% |
| One or more live births | 9.8% | 8.3%-11.5% |
Source: Centers for Disease Control and Prevention (CDC), National Center for Health Statistics, National Survey of Family Growth, 2022-2023, Health E-Stat 121, July 2026.
Diagnosis climbs steeply with age. Women ages 40 to 49 report fibroids at 15.8%, which is 11 times the 1.4% rate among women in their twenties and 2.4 times the 6.7% rate in their thirties. The CDC marks both gaps as statistically significant. Fibroids grow slowly, so detection and diagnosis pile up across the reproductive years.
Women with at least one live birth report fibroids at 9.8%, against 5.1% for women with none. That gap likely reflects age and medical contact, since mothers tend to be older and see clinicians more often. The CDC warns that these are bivariate results, which means other factors may explain them.
Uterine Fibroids by Race and Ethnicity in the US 2026
| Group | Diagnosed with Fibroids |
|---|---|
| Black, non-Hispanic | 12.5% |
| Hispanic | 7.4% |
| White, non-Hispanic | 7.1% |
| Asian, non-Hispanic | 6.6% |
| Any college attendance / High school or less | 8.7% / 5.5% |
| Private / Public / No insurance | 8.8% / 6.7% / 5.2% |
Source: Centers for Disease Control and Prevention (CDC), National Center for Health Statistics, National Survey of Family Growth, 2022-2023, Health E-Stat 121, July 2026.
Black women report the highest diagnosis rate at 12.5%, about 1.8 times the 7.1% rate for White women. Research also finds that Black women develop fibroids earlier and more often, and lifetime estimates for Black women run above 80%. The survey figure captures only the share who received a diagnosis.
Education and insurance move the numbers too. Women with any college report 8.7% against 5.5% for those with a high school education or less. Women with private insurance report 8.8%, while uninsured women report 5.2%. Those gaps probably reflect access to imaging and care, not lower real occurrence. Fewer visits mean fewer diagnoses, and Uterine Fibroids Statistics in US survey data cannot count what clinicians never find.
Uterine Fibroids Symptoms and Health Effects in the US 2026
| Measure | Figure |
|---|---|
| Women with fibroids who have symptoms | 20%-50% |
| Patients with heavy menstrual bleeding | About 1 in 3 |
| Women with fibroids who seek treatment each year | About 1% |
| Average diagnosis delay | 3.6 years |
| Common symptoms | Heavy bleeding, pelvic pain, pressure, frequent urination |
Source: National Institute of Child Health and Human Development (NICHD); Seminars in Reproductive Medicine, 2017; congressional findings in H.R. 4395, 119th Congress; Healthcare Cost and Utilization Project (HCUP), Agency for Healthcare Research and Quality.
Only 20%-50% of women with fibroids develop symptoms. Heavy menstrual bleeding is the most common, hitting about 1 in 3 patients, and it can lead to anemia. Pelvic pain, pressure on the bladder and frequent urination follow. Fibroids also raise the risk of pregnancy complications, and congressional findings call them a leading cause of gynecologic hospitalization.
Care-seeking lags far behind. Only about 1% of women with fibroids seek treatment each year, and the average diagnosis takes 3.6 years. Earlier diagnosis matters most for Black women, who face earlier onset and larger growths.
Fibroids and Fertility Statistics in the US 2026
| Group | Current Fertility Problems | Ever Used Fertility Services |
|---|---|---|
| Fibroids diagnosed | 25.4% | 31.4% |
| No fibroids diagnosis | 19.0% | 12.3% |
| PCOS diagnosed | 45.2% | 34.5% |
| Endometriosis diagnosed | 33.0% | 30.7% |
Source: Centers for Disease Control and Prevention (CDC), National Center for Health Statistics, Health E-Stat 121, July 2026 (National Survey of Family Growth, 2022-2023).
The CDC defines current fertility problems as infertility or impaired fecundity, the physical ability to have children. Women with a fibroid diagnosis report these problems at 25.4%, 6.4 points above the 19.0% for women without one. The gap is significant. Fibroids can block the uterus or fallopian tubes, and large ones raise miscarriage risk.
Fertility care use shows a sharper split. 31.4% of women with fibroids have used fertility services, 2.6 times the 12.3% rate for women without them. The survey cannot say fibroids caused each problem, and women trying to conceive are more likely to get imaging and a diagnosis.
Uterine Fibroids Diagnosis and Treatment Statistics in the US 2026
| Measure | Figure |
|---|---|
| Tried medication or drug-based relief (2016 survey) | 71% |
| Had surgery or another procedure (2016 survey) | 30% |
| Average diagnosis delay | 3.6 years |
| Women with fibroids seeking treatment each year | About 1% |
| Annual ultrasound screening, ages 25-54 | Modeled as cost-saving (2026 preprint) |
Source: Fibroids Awareness Month 2026 survey summary; congressional findings in H.R. 4395, 119th Congress; medRxiv preprint on ultrasound screening cost-effectiveness, 2026.
Drugs lead the treatment path. In a 2016 online survey of US women with fibroids, 71% had tried medication or other drug-based relief and 30% had undergone surgery or another procedure. Options now range from hormonal medicines to uterine fibroid embolization, focused ultrasound and surgery.
Diagnosis remains the weak link. The 3.6-year average delay stretches the time women live with pain and bleeding. A 2026 economic model suggests annual ultrasound screening for women 25 to 54 would cost less than it saves, especially for Black women. That study is a preprint and awaits peer review, so no screening guideline exists yet.
Hysterectomy and Myomectomy Statistics for Fibroids in the US 2026
| Measure | Figure |
|---|---|
| Yearly hysterectomies due to fibroids (NICHD estimate) | About 200,000 |
| Yearly myomectomies due to fibroids (NICHD estimate) | About 30,000 |
| Fibroids’ share of all hysterectomies | 30%-50% |
| Hysterectomy share of inpatient fibroid surgeries, 2013 | 76.5% |
| Drop in fibroid surgery rate, 2005-2013 | 20% (210.8 to 168.0 per 100,000) |
| Black vs White women: hysterectomy / myomectomy risk | 2.4 times / 6.8 times |
Source: National Institute of Child Health and Human Development (NICHD); Agency for Healthcare Research and Quality (AHRQ), Healthcare Cost and Utilization Project Statistical Brief 200; American Journal of Obstetrics and Gynecology.
Hysterectomy remains the most common fibroid surgery. NICHD estimated about 200,000 fibroid hysterectomies and 30,000 myomectomies a year, a ratio near 7 to 1. Hospital data from 13 states show hysterectomy made up 76.5% of inpatient fibroid operations in 2013. Fibroids account for 30%-50% of all US hysterectomies.
The surgical mix is shifting. Between 2005 and 2013, the combined rate of four fibroid procedures fell 20%, driven by a 52% drop in inpatient hysterectomy, while outpatient hysterectomy rose more than 400%. Black women face 2.4 times the hysterectomy rate and 6.8 times the myomectomy rate of White women. These surgery figures are older, and newer national totals are not yet public.
Economic Cost of Uterine Fibroids in the US 2026
| Cost Measure | Estimate |
|---|---|
| Total annual burden, 2022 (2023 dollars) | $41.4 billion to $42.2 billion |
| Total annual burden, 2010 (2010 dollars) | $5.9 billion to $34.4 billion |
| Direct medical costs, 2010 | $4.1 billion to $9.4 billion |
| Lost work costs, 2010 | $1.55 billion to $17.2 billion |
| Obstetric costs, 2010 | $238 million to $7.76 billion |
Source: Reproductive Sciences, “The Annual Economic Burden of Uterine Fibroids in the United States (2010 Versus 2022),” 2024; American Journal of Obstetrics and Gynecology, 2012; NICHD.
A 2024 analysis put the annual burden at $41.4 billion and then $42.2 billion once it added focused ultrasound and infertility costs. Those figures use 2023 dollars, while the 2010 range of $5.9 billion to $34.4 billion uses 2010 dollars. Inflation explains part of the rise. A 10.6% increase in affected women explains more.
Lost work is the largest piece, and cesarean delivery makes up about 80% of indirect obstetric costs. The authors note that fibroid research remains underfunded. At $34.4 billion, fibroids already cost more than breast, colon or ovarian cancer.
Uterine Fibroid Research Funding and Awareness in the US 2026
| Funding Measure | Figure |
|---|---|
| NIH fibroid research funding, 2019 | About $17 million |
| Rank among NIH funded conditions, 2019 | Bottom 50 of 292 |
| NICHD disparity research centers | $15 million over 5 years (2 centers) |
| Proposed yearly authorization, H.R. 4395 | $30 million (FY2026-FY2030) |
| Cost per research dollar | About $2,480 of burden per $1 |
Source: National Institute of Child Health and Human Development (NICHD); congressional text of H.R. 4395, 119th Congress; Society for Women’s Health Research; burden-to-funding ratio calculated from published figures.
The most cited NIH figure is about $17 million in 2019, which placed fibroids in the bottom 50 of 292 funded conditions. Endometriosis received $13 million that year. Compare that with a burden of $42.2 billion: roughly $2,480 of annual cost for every $1 of 2019 NIH research money. The comparison mixes years, so read it as scale, not an exact ratio.
New money is small but real. NICHD funded two fibroid disparity research centers at about $1.5 million a year each for 5 years. H.R. 4395 would authorize $30 million a year from FY2026 through FY2030. July 2026 was Fibroids Awareness Month, and advocates are pressing for more federal research after an October 2026 executive order on women’s health.
Frequently Asked Questions About Uterine Fibroids in US 2026
How Common Are Uterine Fibroids in the US in 2026?
Researchers estimate 70%-80% of women develop fibroids by age 50. The CDC survey found 7.8% of women ages 20 to 49 had a diagnosis in 2022-2023. The first figure estimates who has fibroids. The second counts who was told.
What Percentage of Women Have Uterine Fibroids in 2026?
The diagnosed share is 7.8% for women ages 20 to 49. The lifetime estimate is 70%-80% by age 50. NICHD gives a lower line of about 1 in 2 women before menopause.
What Age Do Uterine Fibroids Become Most Common in 2026?
Diagnosis peaks in the forties. The CDC reports 15.8% of women ages 40 to 49 had a diagnosis, against 6.7% in their thirties and 1.4% in their twenties.
Which Race Has the Highest Rate of Uterine Fibroids in 2026?
Black non-Hispanic women, at 12.5% diagnosed, compared with 7.1% for White women, 7.4% for Hispanic women and 6.6% for Asian women.
Do Uterine Fibroids Cause Infertility in 2026?
Fibroids are linked to fertility trouble, not proven as the cause in every case. 25.4% of women with a diagnosis report current fertility problems, versus 19.0% of women without one.
What Are the Most Common Symptoms of Uterine Fibroids in 2026?
Heavy menstrual bleeding is the most common symptom, affecting about 1 in 3 patients. Others include pelvic pain, pressure, frequent urination and anemia. Only 20%-50% of women with fibroids have symptoms.
How Many Hysterectomies Are Caused by Fibroids in 2026?
Fibroids account for 30%-50% of US hysterectomies. NICHD estimated about 200,000 fibroid hysterectomies and 30,000 myomectomies a year. Those totals predate 2026.
How Much Do Uterine Fibroids Cost the US Each Year in 2026?
Up to $42.2 billion a year, according to a 2024 analysis in 2023 dollars.
How Long Does a Fibroid Diagnosis Take in 2026?
Congressional findings cite an average delay of 3.6 years. Many women hear that heavy periods are normal, so symptoms go untreated while fibroids keep growing.
Are Uterine Fibroids Cancerous in 2026?
No. The CDC and NICHD describe fibroids as noncancerous growths in or on the wall of the uterus.
How Much Does NIH Spend on Fibroid Research in 2026?
The most cited figure is about $17 million in 2019, from federal data in congressional findings. NICHD also funded two research centers at about $1.5 million a year each. Newer annual totals are not yet public.
Why Do CDC Fibroid Numbers Differ From the 70%-80% Estimate in 2026?
They measure different things. The CDC’s 7.8% counts women 20 to 49 who ever received a diagnosis. The 70%-80% estimate projects how many women develop fibroids by age 50, including those never diagnosed.
Disclaimer: The data research report we present here is based on information found from various sources. We are not liable for any financial loss, errors, or damages of any kind that may result from the use of the information herein. We acknowledge that though we try to report accurately, we cannot verify the absolute facts of everything that has been represented.