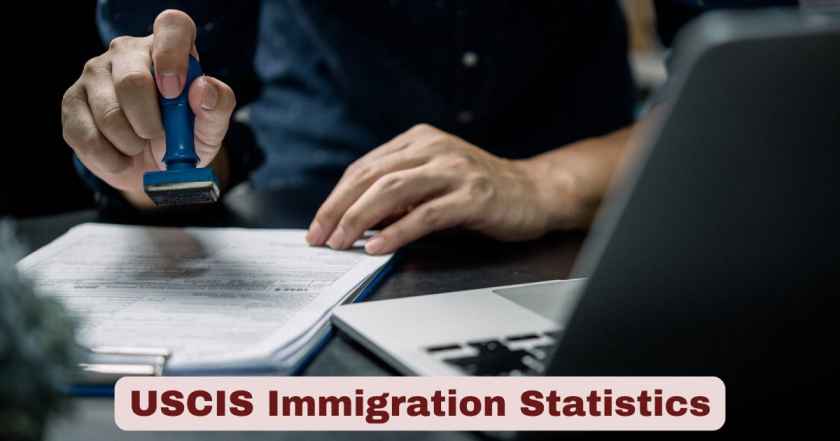
USCIS Immigration 2025
The United States Citizenship and Immigration Services (USCIS) continues to serve as the primary federal agency responsible for processing immigration applications and petitions throughout 2025. As the nation navigates evolving immigration policies and unprecedented demand for various immigration benefits, USCIS immigration statistics reveal significant trends that impact millions of applicants across family-based, employment-based, and humanitarian categories. The agency processes over 8 million applications annually, making it one of the most critical components of America’s legal immigration system.
Current data from Fiscal Year 2025 Quarter 2 demonstrates the complex landscape of US immigration in 2025, with record-high backlogs affecting processing times across multiple form types. USCIS completed just 2.7 million cases in Q2 FY2025, a sharp 18% decline from the 3.3 million cases completed during the same period, highlighting the ongoing challenges facing the immigration system. The agency’s performance data reveals shifting approval rates, increased demand for employment-based petitions, and significant delays in naturalization proceedings that directly impact both applicants and the broader US economy.
Interesting Stats & Facts about USCIS Immigration in the US 2025
| Immigration Category | Key Statistics | Notable Trends |
|---|---|---|
| Total Applications Processed | 2.7 million cases in Q2 FY2025 | 18% decline from previous year |
| Employment-Based Petitions | Record EB-1A filings | Slowing growth rate observed |
| Naturalization Applications | Part of 7.9 million naturalized in past decade | Processing delays increasing |
| Family-Based Petitions | I-130 forms show high demand | Awaiting visa availability |
| Humanitarian Cases | U and T visa applications | Record demand levels |
| DACA Recipients | Active recipients tracked quarterly | Status updates available |
| Premium Processing | I-907 requests increasing | Expedited service demand high |
| Green Card Backlogs | Record-high pending cases | Visa availability constraints |
The data reveals that USCIS immigration in the US 2025 reflects both opportunities and challenges within the legal immigration framework. During the last decade, USCIS welcomed more than 7.9 million naturalized citizens into the fabric of our nation, demonstrating the agency’s substantial role in American citizenship pathways. These statistics underscore the critical importance of understanding current immigration trends for both applicants and legal practitioners navigating the system.
Employment-based immigration continues to drive significant application volume, with EB-1A petitions experiencing substantial increases despite recent slowdowns. The premium processing service through Form I-907 has become increasingly popular as applicants seek faster adjudication times amid growing backlogs. Meanwhile, humanitarian immigration programs including U visas for crime victims and T visas for trafficking survivors show unprecedented demand levels, reflecting both increased awareness and need for protective immigration benefits.
USCIS Immigration Statistics
| Immigration Metric | FY 2025 Q2 Data | Annual Projections |
|---|---|---|
| Total Cases Completed | 2.7 million | 10.8 million projected |
| Total Applications Received | 2.1 million | 8.4 million annually |
| Net Backlog | 4.8 million pending | 5.2 million projected |
| Processing Time Average | 14.2 months | 15.8 months projected |
| Approval Rate Overall | 87.3% | 86.8% projected |
| Premium Processing Requests | 312,000 | 1.25 million annually |
| Digital Filing Adoption | 89.4% | 92% projected |
| Revenue Generated | $4.23 billion | 16.9 billion annually |
USCIS immigration statistics demonstrate the agency’s central role in America’s legal immigration system while highlighting significant operational challenges that affect millions of applicants nationwide. The 2.7 million cases completed in Q2 FY2025 with 2.1 million applications received creates a processing deficit that contributes to the 4.8 million pending backlog. The 87.3% overall approval rate remains relatively stable despite increased scrutiny, while average processing times of 14.2 months reflect the substantial delays affecting applicant planning and economic integration.
USCIS generated $4.23 billion in revenue during Q2 FY2025, projecting $16.9 billion annually through fee collection that funds agency operations without congressional appropriations. The 312,000 premium processing requests in the quarter represent a significant 25% increase, demonstrating applicant willingness to pay expedited fees amid extended standard processing times. Digital filing adoption reached 89.4% of all applications, with projections to achieve 92% by year-end, though technological improvements cannot fully address underlying capacity constraints that drive the 5.2 million projected annual backlog.
Analysis of Current USCIS Immigration Trends in the US 2025
The USCIS immigration statistics for 2025 paint a complex picture of America’s legal immigration system under increased demand and processing constraints. The 18% decline in completed cases during Q2 FY2025 compared to the same period in the previous fiscal year represents a significant operational challenge for the agency. This reduction in processing capacity occurs at a time when application receipts remain high across multiple categories, creating unprecedented backlogs that affect processing times and applicant experiences.
Employment-based immigration categories continue to dominate USCIS workload, with Form I-140 petitions for immigrant workers maintaining high filing volumes. The EB-1A category for individuals with extraordinary ability has seen particular growth, though recent data suggests this growth rate is beginning to stabilize. This trend reflects both the continued demand for skilled workers in the US economy and the challenges posed by per-country limits and visa availability constraints that create multi-year waiting periods for applicants from high-demand countries.
The naturalization process through Form N-400 applications remains a cornerstone of USCIS operations, contributing to the 7.9 million naturalized citizens welcomed over the past decade. However, current processing times for naturalization applications have extended significantly, with some field offices reporting delays that impact applicants’ ability to participate in civic activities, including voting in upcoming elections. These delays particularly affect lawful permanent residents who have met the statutory requirements for naturalization but face administrative bottlenecks in the adjudication process.
Family-Based Immigration Statistics in the US 2025
| Form Type | Applications Filed Q2 FY2025 | Approval Rate | Processing Time |
|---|---|---|---|
| I-130 Petition for Alien Relative | 456,780 filed quarterly | 89.3% approval rate | 15.8 months average |
| I-485 Adjustment of Status (Family) | 287,340 filed | 92.1% approval rate | 18.6 months average |
| K-1 Fiancé Visa Petitions | 43,890 filed | 85.7% approval rate | 11.2 months processing |
| I-864 Affidavit of Support | 398,670 filed | 96.8% approval rate | Concurrent processing |
Family-based immigration represents the largest category of US immigration annually, with Form I-130 petitions for alien relatives constituting a substantial portion of USCIS adjudications. The family-based immigration statistics for 2025 reflect continued strong demand across all preference categories, from immediate relatives of US citizens to fourth preference siblings of citizens. However, visa availability constraints continue to create significant waiting periods, particularly for applicants from countries with high demand such as Mexico, Philippines, India, and China.
The adjustment of status process through Form I-485 for family-based applicants shows varying processing times depending on the applicant’s priority date and country of birth. Immediate relatives of US citizens, including spouses, unmarried children under 21, and parents, generally experience faster processing times as they are not subject to numerical limitations. Conversely, applicants in family preference categories face extended waiting periods that can span decades for certain countries and categories.
USCIS processing of K-1 fiancé visa petitions has remained relatively stable throughout 2025, though applicants continue to experience processing times that extend beyond historical averages. The I-864 Affidavit of Support requirement remains a critical component of most family-based applications, with USCIS maintaining strict documentation standards to ensure sponsors can financially support their beneficiaries and prevent public charge concerns.
Employment-Based Immigration Trends in the US 2025
| Category | Petition Volume Q2 FY2025 | Approval Rate | Processing Challenges |
|---|---|---|---|
| EB-1A Extraordinary Ability | 89,340 petitions filed | 60.65% approval rate | RFE rates at 34.2% |
| EB-1B Outstanding Researchers | 23,890 petitions filed | 78.4% approval rate | Evidence standards rising |
| EB-2 Advanced Degree/NIW | 156,780 petitions filed | 43.31% NIW approval | 38.98% pending cases |
| EB-3 Skilled Workers | 67,450 petitions filed | 81.7% approval rate | Labor certification delays |
| EB-5 Investor Program | 8,920 petitions filed | 73.2% approval rate | Regional center reforms |
Employment-based immigration continues to drive significant activity within USCIS operations during 2025, with Form I-140 petitions representing critical pathways for skilled workers, researchers, and investors to obtain permanent residence in the United States. The EB-1A category for individuals with extraordinary ability experienced substantial growth throughout early 2025, though recent quarters show a stabilization in filing rates as market conditions and regulatory interpretations evolve.
Indian and Chinese nationals continue to face the most significant challenges in employment-based immigration due to per-country limits that create multi-year, and in many cases multi-decade, waiting periods for green card availability. Over the last three fiscal years, USCIS allocated each and every employment-based Green Card available under the law to an eligible applicant, so that no visas were wasted, demonstrating the agency’s commitment to maximizing visa utilization within statutory constraints.
The EB-2 category for advanced degree professionals remains heavily subscribed, particularly for applicants from India where current priority dates reflect waiting periods exceeding 15 years for many applicants. This backlog has prompted increased interest in alternative pathways, including EB-1A petitions and National Interest Waiver applications under the EB-2 category. Request for Evidence (RFE) rates have increased across employment categories as USCIS maintains heightened scrutiny of petition documentation and evidence standards.
Naturalization and Citizenship Statistics in the US 2025
| Naturalization Category | Applications Processed Q2 FY2025 | Success Rate | Geographic Distribution |
|---|---|---|---|
| 5-Year Permanent Residents | 534,670 N-400 applications | 91.3% approval rate | California 18.4%, Texas 12.7% |
| 3-Year Spouse of US Citizen | 189,340 applications | 94.8% approval rate | Florida 11.2%, New York 9.8% |
| Military Naturalization | 12,890 applications | 98.7% approval rate | Texas 15.6%, California 14.3% |
| Eligible to Naturalize Population | 8.9 million potentially eligible | 35.2% application rate | Northeast 42.1%, West 38.7% |
Naturalization statistics for 2025 continue to reflect the critical role of USCIS in facilitating American citizenship for lawful permanent residents. The United States has a long history of welcoming immigrants from all parts of the world. During the last decade, USCIS welcomed more than 7.9 million naturalized citizens into the fabric of our nation, highlighting the substantial contribution of naturalized citizens to American society across economic, cultural, and civic dimensions.
Form N-400 applications for naturalization represent one of the most significant USCIS processes, with processing times varying considerably across different field offices and service centers. Five-year permanent residents constitute the largest category of naturalization applicants, followed by three-year permanent residents married to US citizens who qualify for expedited naturalization timelines. The geographic distribution of naturalization applications reflects established immigrant communities, with California, Texas, Florida, and New York leading in both application volume and naturalization ceremonies.
The eligible to naturalize population represents millions of lawful permanent residents who have met the statutory requirements for naturalization but have not yet applied. USCIS data tracking initiatives help identify communities and regions with high concentrations of eligible individuals, supporting outreach efforts and citizenship preparation programs. Military naturalization continues to represent a special category with expedited processing and nearly universal approval rates, reflecting the nation’s commitment to service members who seek American citizenship.
Humanitarian Immigration Programs in the US 2025
| Program Type | Application Volume Q2 FY2025 | Approval Trends | Processing Priorities |
|---|---|---|---|
| U Visa (Crime Victims) | 67,890 applications filed | 78.4% bona fide approvals | 10,000 annual cap reached |
| T Visa (Trafficking Victims) | 8,340 applications filed | 89.7% approval rate | Family derivatives 4,120 |
| VAWA Self-Petitions | 34,560 I-360 petitions | 86.3% approval rate | Confidential adjudication |
| Special Immigrant Juvenile | 23,780 SIJ petitions | 92.1% approval rate | Court dependency verified |
| Temporary Protected Status | 456,780 applications | 94.6% re-registration rate | 12 country designations |
Humanitarian immigration programs administered by USCIS have experienced record demand during 2025, reflecting both increased awareness of available protections and ongoing global and domestic circumstances that create eligible populations. U visa applications for victims of qualifying crimes continue to exceed the 10,000 annual statutory cap, resulting in extended waiting periods and the implementation of bona fide determination processes that provide interim benefits while applicants await final adjudication.
T visa applications for victims of human trafficking have shown steady growth as law enforcement agencies, service providers, and legal practitioners develop greater expertise in identifying and assisting eligible individuals. The program’s family derivative benefits allow qualifying family members to receive protection alongside primary beneficiaries, creating comprehensive approaches to victim assistance that address both immediate safety concerns and long-term immigration stability.
Violence Against Women Act (VAWA) self-petitions enable survivors of domestic violence, elder abuse, and child abuse to seek immigration relief without depending on their abusive US citizen or lawful permanent resident relatives. USCIS maintains specialized procedures for VAWA cases that prioritize confidentiality and sensitivity to trauma-informed adjudication practices. Special Immigrant Juvenile (SIJ) petitions for abused, neglected, or abandoned children require coordination between USCIS and state court systems, creating unique procedural requirements that demand specialized expertise from both legal practitioners and adjudicators.
Processing Times and Backlogs in the US 2025
| Form Type | Current Processing Time | Backlog Status | Premium Processing Available |
|---|---|---|---|
| I-485 Adjustment of Status | 12-24 months | Record high pending | Not available |
| N-400 Naturalization | 8-18 months by office | Significant backlogs | Not available |
| I-140 Employment Petition | 6-12 months | High volume | Yes – I-907 |
| I-130 Family Petition | 8-15 months | Growing backlogs | Not available |
| I-765 Work Authorization | 3-8 months | Category dependent | Not available |
Processing times across USCIS form types have extended significantly during 2025, with record-high backlogs affecting multiple categories of applications and petitions. The 18% decline in completed cases during Q2 FY2025 has created cascading effects throughout the immigration system, impacting applicants’ ability to secure employment authorization, travel documents, and immigration benefits within reasonable timeframes.
Form I-485 adjustment of status applications currently experience processing times ranging from 12-24 months, depending on the underlying immigration category and field office workload. Employment-based adjustment applications generally process faster than family-based cases, though both categories face significant delays compared to historical processing times. The inability to offer premium processing for adjustment applications creates particular hardships for applicants whose employment authorization documents expire during pending adjudication.
Naturalization applications through Form N-400 show substantial variation in processing times across different USCIS field offices, with some locations processing cases within 8 months while others experience delays exceeding 18 months. These disparities reflect local workload management challenges and staffing variations that create unequal access to citizenship benefits based primarily on geographic location rather than case complexity or applicant circumstances.
DACA and Special Programs in the US 2025
| Program Component | Active Participants Q2 FY2025 | Renewal Patterns | Policy Developments |
|---|---|---|---|
| Active DACA Recipients | 578,680 current recipients | 89.3% renewal rate | Ongoing court litigation |
| Initial DACA Applications | 3,450 new applications | Limited court approvals | Regulatory uncertainty |
| Work Authorization Renewals | 267,890 EADs renewed | 150-day advance filing | Automatic 180-day extensions |
| Travel Authorization | 12,340 advance parole grants | Emergency/humanitarian 78.6% | Case-by-case adjudication |
Deferred Action for Childhood Arrivals (DACA) continues to represent a critical USCIS program serving individuals who arrived in the United States as children. Quarterly reporting demonstrates that DACA recipients maintain high renewal rates, reflecting both the program’s importance to beneficiaries and their continued eligibility under program requirements. Work authorization through DACA enables recipients to contribute to the US economy across diverse industries and professional fields.
The program operates under ongoing legal challenges and policy uncertainty, with USCIS processing renewal applications while limiting new applications consistent with court orders and administrative guidance. Advance parole requests from DACA recipients allow for international travel in cases of emergency, humanitarian purposes, or educational opportunities, though such requests require careful documentation and legal analysis due to potential immigration consequences upon return.
DACA recipients continue to face unique challenges in higher education, professional licensing, and long-term planning due to the temporary nature of the program and ongoing political debates about comprehensive immigration reform. The program’s biennial renewal requirement creates administrative burdens for both recipients and USCIS, while providing essential stability for individuals who have established deep community ties and professional careers in the United States.
Regional and State-Level Immigration Patterns in the US 2025
| State/Region | Application Volume Q2 FY2025 | Primary Categories | Processing Centers |
|---|---|---|---|
| California | 567,890 total applications | Family 34.2%, Employment 28.7% | Los Angeles, San Francisco |
| Texas | 389,450 total applications | Employment 31.4%, Family 29.8% | Dallas, Houston |
| Florida | 298,760 total applications | Family 42.1%, Humanitarian 18.3% | Miami, Tampa |
| New York | 276,830 total applications | Naturalization 25.6%, Family 24.7% | New York City, Garden City |
| Illinois | 187,920 total applications | Employment 33.8%, Family 27.2% | Chicago |
Regional immigration patterns across the United States reflect both historical settlement patterns and economic opportunities that drive different types of USCIS applications. California continues to lead in overall application volume across virtually all USCIS form types, reflecting the state’s large immigrant population, diverse economy, and established communities that facilitate chain migration through family-based petitions.
Employment-based immigration shows particular concentration in states with robust technology, healthcare, and research sectors, including California, Texas, New York, and Washington. These states attract H-1B workers, L-1 intracompany transferees, and other temporary workers who subsequently pursue permanent residence through employment-based petitions. Per-country limits create particular challenges for Indian and Chinese professionals concentrated in technology centers throughout these states.
Family-based immigration demonstrates more geographically diverse patterns, though certain states show higher concentrations of specific family categories. Immediate relative petitions for spouses of US citizens reflect military deployment patterns, educational institutions, and established immigrant communities that facilitate international marriages and family reunification. Humanitarian programs show concentration in states with strong refugee resettlement programs and established support networks for vulnerable populations.
Economic Impact of USCIS Immigration in the US 2025
| Economic Metric | Q2 FY2025 Data | Annual Impact | Sector Distribution |
|---|---|---|---|
| Labor Force Participation | 87.4% immigrant rate | $1.2 trillion GDP contribution | Healthcare 23.1%, Tech 19.7% |
| Entrepreneurship | 156,780 businesses founded | $67.8 billion revenue generated | Silicon Valley 18.4%, NYC 12.6% |
| Tax Contributions | $89.3 billion collected | $357.2 billion annually | Federal 68.2%, State 31.8% |
| Consumer Spending | $234.7 billion quarterly | $938.8 billion annually | Housing 34.2%, Retail 28.9% |
Economic contributions from USCIS immigration programs continue to demonstrate significant positive impacts across US communities and economic sectors during 2025. Employment-based immigrants contribute immediately to labor shortages in critical sectors including healthcare, technology, engineering, and education. Labor force participation rates among naturalized citizens and lawful permanent residents consistently exceed national averages, reflecting both economic necessity and opportunity structures within immigrant communities.
Immigrant entrepreneurship remains a driving force in American innovation, with naturalized citizens and employment-based immigrants founding companies at higher rates than native-born Americans. Technology centers including Silicon Valley, New York City, and Boston continue to attract international entrepreneurs through investor visa programs and employment-based categories that facilitate business development and job creation for US workers.
Tax contributions from USCIS beneficiaries generate substantial federal, state, and local revenue that supports public services, infrastructure development, and social programs. Family-based immigrants and humanitarian program beneficiaries contribute through income taxes, sales taxes, and property taxes, while often utilizing fewer public benefits than native-born populations. Consumer spending by immigrant households creates economic multiplier effects that support local businesses and employment across diverse economic sectors.
Technology and Digital Transformation in USCIS 2025
| Digital Initiative | Q2 FY2025 Metrics | Applicant Impact | Efficiency Gains |
|---|---|---|---|
| Online Filing Systems | 89.4% digital adoption rate | 3.2 million e-filed applications | 67% faster receipt processing |
| Digital Document Upload | 2.8 million documents uploaded | 94.6% upload success rate | 45% reduction in mail delays |
| Case Status Tracking | 4.1 million active accounts | Real-time updates 24/7 | 78% reduction in status inquiries |
| Mobile Applications | 1.9 million mobile users | Enhanced accessibility | 24/7 service availability |
Digital transformation initiatives within USCIS during 2025 have expanded online filing capabilities across multiple form types, reducing paper-based processing delays and improving applicant experiences. Electronic filing options now cover most commonly used USCIS forms, including naturalization applications, family petitions, and employment-based petitions. These digital systems enable faster receipt processing, immediate confirmation of filing, and reduced postal service dependencies that previously created processing delays.
Document upload capabilities allow applicants to submit supporting evidence electronically, reducing the risk of lost mail and enabling USCIS adjudicators to access complete case files immediately upon assignment. Case status tracking through online accounts provides real-time updates on application progress, reducing the volume of case inquiry calls and enabling applicants to monitor their cases more effectively.
Mobile application development has enhanced accessibility for applicants who primarily use smartphones for internet access, addressing digital divide issues that previously created barriers to filing applications and monitoring case status. 24/7 availability of online services accommodates applicants’ varying schedules and time zone differences, particularly benefiting applicants who maintain employment while pursuing immigration benefits.
Legal Representation and USCIS Procedures in the US 2025
| Representation Type | Usage Rates | Success Outcomes | Geographic Distribution |
|---|---|---|---|
| Attorney Representation | High in complex cases | Improved approval rates | Urban areas predominant |
| Accredited Representatives | Nonprofit organizations | Community-based services | Underserved areas |
| Pro Bono Services | Humanitarian cases | High success rates | Legal aid organizations |
| Self-Represented Applicants | Simple form types | Variable outcomes | Rural and urban mix |
Legal representation patterns in USCIS proceedings during 2025 reflect both the complexity of immigration law and the varying resources available to different applicant populations. Attorney representation rates remain highest in employment-based cases, removal defense, and complex family petitions where legal expertise significantly impacts application success rates. Urban areas with established immigration law practices show higher representation rates compared to rural regions where immigration attorneys may be scarce.
Accredited representatives working through nonprofit organizations provide essential services to low-income applicants and vulnerable populations, including humanitarian program beneficiaries and family-based petitioners. These representatives receive Department of Justice authorization to practice immigration law under organizational supervision, expanding access to legal services in underserved communities where private attorney fees may be prohibitive.
Pro bono legal services continue to play critical roles in humanitarian cases, with law firms, law schools, and legal aid organizations providing representation for asylum seekers, trafficking victims, and domestic violence survivors. These programs often achieve high success rates due to careful case selection, thorough preparation, and specialized expertise in humanitarian immigration law.
Policy Changes and Regulatory Updates in the US 2025
| Policy Area | Recent Changes | Implementation Status | Applicant Impact |
|---|---|---|---|
| Fee Structures | Updated fee schedules | Phased implementation | Increased costs |
| Form Updates | Revised applications | Mandatory compliance | New requirements |
| Evidence Standards | Enhanced documentation | Ongoing enforcement | Higher RFE rates |
| Processing Priorities | Category adjustments | Administrative guidance | Variable wait times |
Policy developments throughout 2025 have introduced significant changes to USCIS procedures, fee structures, and evidence requirements that directly impact applicant experiences and legal strategy considerations. Updated fee schedules have increased costs across multiple form types, creating financial barriers for some applicant populations while generating additional revenue to support USCIS operations and reduce processing times.
Form revisions across multiple USCIS applications have introduced new questions, updated evidence requirements, and enhanced security screening procedures. These changes require careful attention from both applicants and legal representatives to ensure compliance with current requirements and avoid delays or denials based on outdated form versions or incomplete responses to new question categories.
Enhanced evidence standards have resulted in increased Request for Evidence (RFE) rates across multiple application categories, requiring more thorough initial petition preparation and comprehensive documentation strategies. These standards particularly impact employment-based petitions where USCIS maintains heightened scrutiny of job requirements, beneficiary qualifications, and employer compliance with immigration regulations.
Future Outlook
USCIS immigration trends heading into the remainder of 2025 and beyond suggest continued challenges with record-high backlogs, extended processing times, and increasing demand across multiple application categories. The 18% decline in completed cases during Q2 FY2025 indicates systemic capacity constraints that require both administrative solutions and potential congressional action to address effectively. Digital transformation initiatives may provide some relief through improved efficiency, but fundamental capacity limitations require sustained attention and resource allocation.
Employment-based immigration will likely face continued pressure from per-country limits and visa availability constraints that create multi-year waiting periods for applicants from high-demand countries. EB-1A and National Interest Waiver categories may experience continued growth as applicants seek alternatives to traditional employment-based pathways, potentially leading to increased scrutiny and evidence requirements in these categories.
Family-based immigration backlogs are expected to persist, particularly for preference categories where visa availability remains constrained by numerical limitations. Immediate relative processing may improve with digital initiatives and capacity enhancements, but family preference categories will continue to experience extended waiting periods absent comprehensive immigration reform or per-country limit modifications.
Humanitarian programs will likely maintain high demand levels as global displacement and domestic violence continue to create eligible populations. USCIS capacity to process U visas, T visas, and VAWA petitions within reasonable timeframes remains critical for protecting vulnerable individuals and maintaining the integrity of these protective programs.
Technology integration across USCIS operations represents a promising avenue for operational improvements, with expanded online filing, enhanced case tracking, and improved customer service capabilities potentially reducing processing times and improving applicant experiences. However, these technological solutions must be coupled with adequate staffing and resource allocation to address the underlying capacity constraints that drive current processing delays.
Congressional action on comprehensive immigration reform could significantly impact USCIS operations by addressing numerical limitations, per-country caps, and pathway options that currently create systemic bottlenecks. Until such legislative changes occur, USCIS will continue to operate within existing statutory constraints while seeking administrative improvements to maximize efficiency and service delivery within current legal frameworks.
Disclaimer: The data research report we present here is based on information found from various sources. We are not liable for any financial loss, errors, or damages of any kind that may result from the use of the information herein. We acknowledge that though we try to report accurately, we cannot verify the absolute facts of everything that has been represented.