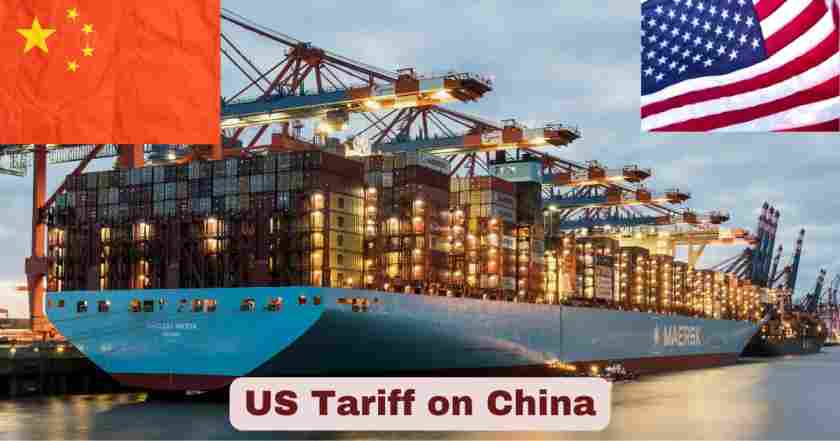
US Tariff on China 2025
The United States tariff policy on China has undergone dramatic fluctuations in 2025, representing one of the most volatile periods in modern bilateral trade relations between the world’s two largest economies. After a brief period of détente following the May 2025 Geneva Agreement that reduced tariffs from 145% to 30%, and an August 12, 2025 extension, trade relations have dramatically deteriorated. On October 10, 2025, President Trump announced an additional 100% tariff on all Chinese imports, bringing the total rate to 130% effective November 1, 2025.
The current tariff landscape reflects extreme policy volatility, with $148.5 billion worth of Chinese imports having experienced multiple rate adjustments throughout 2025—from 145% in early 2025, down to 30% during the May-October truce period, and now escalating to 130% starting November. The October escalation came in response to China’s expanded rare earth export controls, with Trump also announcing export controls on critical US software effective November 1. These dramatic policy shifts demonstrate the administration’s willingness to use extreme tariff policies as leverage in disputes over critical minerals and strategic technology.
Key Stats & Facts About US Tariffs on China in 2025
| Fact Category | Details | 2025 Data |
|---|---|---|
| Current Tariff Status (Nov 2025) | New tariff rate announced Oct 10 | 130% (30% base + 100% additional) |
| May-October 2025 Truce Period | Temporary tariff reduction period | 30% rate (now ended) |
| Truce Period Duration | May 12 – October 10, 2025 | ~5 months |
| Total Imports (Jan-May 2025) | Chinese goods imported to US | $148.53 billion |
| Trade Deficit (Jan-May 2025) | US trade deficit with China | $101.96 billion |
| Section 232 Tariffs | Copper products tariff rate | 50% (effective August 1, 2025) |
| China’s Reciprocal Tariffs | Chinese tariffs on US goods | 10% (reduced from 125%) |
| Revenue Generated | Estimated tariff revenue from China | $394 billion (2026-35) |
| October 2025 New Tariff | Additional tariff announced Oct 10 | +100% (Total: 130%) |
| New Tariff Effective Date | Implementation date for 130% rate | November 1, 2025 |
| Export Controls | US software export restrictions | November 1, 2025 |
The transformation of US-China trade relations represents one of the most significant economic policy shifts of the modern era. After reaching a historic tariff reduction agreement on May 12, 2025 in Lake Geneva, Switzerland—where the United States dropped its main tariff level from 145% to 30% and China reduced its duties from 125% to 10%—the relationship has sharply deteriorated. On October 10, 2025, President Trump announced a new 100% tariff bringing the total to 130%, effectively ending the truce period and returning to near-“Liberation Day” levels. Trump also indicated he may cancel his planned meeting with President Xi at the APEC summit, stating “there seems to be no reason” to meet following China’s rare earth export restrictions.
The $101.96 billion trade deficit accumulated in just five months (January-May 2025) demonstrates the persistent structural challenges in bilateral trade relationships. The brief truce period from May through early October provided temporary relief, but the October escalation driven by the rare earth dispute has reignited tensions. With the new 130% tariff rate effective November 1, 2025, and US export controls on critical software, bilateral trade is expected to decline dramatically, similar to the near-halt experienced during the April 2025 “Liberation Day” period.
China’s Rare Earth Export Control Escalation
| Rare Earth Control Metric | Details |
|---|---|
| Total Rare Earth Elements Restricted | 12 of 17 |
| New Elements Added to List | 5 (holmium, erbium, thulium, europium, ytterbium) |
| Effective Date | December 1, 2025 |
| Export License Threshold | 0.1% rare earth content |
| China’s Global Processing Share | 90% |
| Military Affiliation Impact | Export licenses largely denied |
China announced sweeping new rare earth export controls, expanding restrictions to 12 of the 17 rare earth elements, with new rules taking effect December 1, 2025. The five metals added to the restricted list are holmium, erbium, thulium, europium and ytterbium, joining the seven minerals already restricted: samarium, gadolinium, terbium, dysprosium, lutetium, scandium and yttrium.
Under the new rules starting December 1, 2025, companies with any affiliation to foreign militaries—including those of the United States—will be largely denied export licenses. The regulations require foreign companies to obtain special approval to export items containing even 0.1% rare earth elements sourced from China. These critical minerals are essential for products ranging from jet engines and radar systems to electric vehicles, semiconductors, and defense technology.
China’s control over approximately 90% of processed rare earths gives Beijing enormous leverage in strategic technology competition. The extraterritorial nature of the new restrictions—covering any magnet containing trace amounts of Chinese-sourced rare earths or made using Chinese methods—represents a significant escalation in export control policy and a direct challenge to U.S. defense supply chains.
Latest US Tariff Statistics on China for 2025
| Trade Statistics Metric | 2025 Value | 2024 Comparison |
|---|---|---|
| Jan-May 2025 Imports | $148.53 billion | $162.76 billion |
| Year-over-Year Import Change | -8.7% | Decline |
| Jan-May 2025 Exports | $46.57 billion | $57.5 billion (est.) |
| Year-over-Year Export Change | -19.0% | Significant decline |
| Truce Period Tariff (May-Oct) | 30% | N/A |
| Stock Market Impact (Oct 10) | S&P 500 -2.7% | Worst since April |
The comprehensive analysis of 2025 trade statistics reveals dramatic shifts in bilateral commerce patterns, significantly influenced by the May 12, 2025 tariff reduction agreement, the August extension, and the October 10 tariff escalation to 130%. During the truce period (May-October), US tariffs on Chinese goods were at 30% while Chinese levies were at 10%, but this ended abruptly with Trump’s October announcement. Chinese imports totaling $148.53 billion during January-May 2025 compared to $162.76 billion for the same period in 2024, reflecting the impact of high tariff periods and market uncertainty.
The monthly import pattern showed significant volatility, with January 2025 recording $41.64 billion during the 145% tariff period, declining through April, then adjusting after the May Geneva Agreement. Looking ahead to November 2025 and beyond, the new 130% tariff rate is expected to cause dramatic import declines similar to or exceeding the April 2025 levels. The October 10 announcement caught markets by surprise, with the S&P 500 plunging 2.7%, marking the worst selloff since April. US exports to China which had already declined to $46.57 billion for January-May 2025, face further pressure with China likely to impose retaliatory measures and the cancellation risk of high-level diplomatic meetings.
US Import Tariffs on China Products 2025
| Month | Imports ($ Millions) | Tariff Rate | Policy Period |
|---|---|---|---|
| January 2025 | $41,639.2 | 145% | Pre-Geneva Agreement |
| February 2025 | $31,635.4 | 145% | Pre-Geneva Agreement |
| March 2025 | $29,383.7 | 145% | Pre-Geneva Agreement |
| April 2025 | $25,378.1 | 145% | Pre-Geneva Agreement |
| May 2025 | $20,493.9 | 30% | Geneva Agreement Period |
| Total (Jan-May) | $148,530.2 | Variable | Mixed Policy Periods |
The import tariff structure for Chinese products in 2025 has experienced unprecedented volatility. Rates ranged from 145% in January-April, down to 30% from May through early October following the Geneva Agreement, and now escalating to 130% effective November 1, 2025. The October 10 announcement by President Trump added a 100% tariff “over and above” the existing 30%, stating it would take effect November 1 “or sooner, depending on any further actions or changes taken by China.” The truce that began in Lake Geneva has effectively ended after approximately five months.
Monthly import trends reveal the dramatic impact of policy uncertainty on trade flows. The January-April 2025 period under the 145% tariff regime saw declining import volumes from $41.6 billion to $25.4 billion as businesses adjusted to the prohibitive tariff environment. The May transition to 30% rates following the Geneva Agreement demonstrated immediate market responsiveness, though imports remained suppressed at $20.5 billion. With the 130% rate starting November 1, imports are expected to collapse further, potentially falling below $15 billion monthly as the near-prohibitive tariff makes most Chinese goods economically unviable.
The October escalation also includes US export controls on “any and all critical software” effective November 1, representing a significant expansion beyond traditional tariffs. This comes in response to China’s December 1 requirement that foreign companies obtain licenses to export products containing more than 0.1% rare earths from China. The dual application of extreme tariffs and strategic export controls marks a new phase in US-China economic confrontation, moving beyond trade policy into technology and resource security competition.
US Export Tariffs on China Trade 2025
| Month | Exports ($ Millions) | Growth Rate | Key Sectors |
|---|---|---|---|
| January 2025 | $9,901.3 | -17.9% | Agriculture, Technology |
| February 2025 | $10,461.6 | -13.3% | Manufacturing, Energy |
| March 2025 | $11,458.2 | -9.4% | Agriculture, Chemicals |
| April 2025 | $8,193.1 | -29.1% | Technology, Agriculture |
| May 2025 | $6,553.3 | -42.1% | Energy, Manufacturing |
| Total (Jan-May) | $46,567.5 | -19.0% | Mixed Sectors |
US export performance to China deteriorated significantly through May 2025, with total exports of $46.57 billion representing a 19.0% decline from the previous year’s comparable period. The situation has worsened dramatically following the October 10 tariff escalation. Trump’s suggestion that he may not meet with President Xi at the APEC summit has particularly impacted agricultural exports, with grain prices falling sharply as hopes for Chinese soybean purchases—historically a top US export—evaporated. China has placed no soybean orders this harvest season, and prospects appear bleak following the tariff announcement.
Agricultural exports, traditionally a cornerstone of US-China trade, face severe challenges under the renewed trade war. The progressive monthly decline from $9.90 billion in January to $6.55 billion in May continued through the truce period, and the November tariff escalation threatens to eliminate remaining agricultural trade. American farmers in Iowa, Illinois, and Nebraska face particularly dire circumstances as Chinese buyers have completely shifted to alternative suppliers like Brazil and Argentina for soybeans and other commodities.
The sectoral distribution of export declines reveals broad-based challenges that will intensify under the 130% tariff environment. Technology sector exports face dual pressures from both tariff barriers and the new US export controls on critical software taking effect November 1. China’s retaliatory antitrust investigation into Qualcomm and potential additional measures signal that US technology companies will face increasingly hostile market conditions, with few prospects for recovery while the tariff war continues.
Product-Specific Tariff Rates on China 2025
| Product Category | Tariff Rate | Import Value | Revenue Generated |
|---|---|---|---|
| Consumer Electronics | 25% | $35.2 billion | $8.8 billion |
| Manufacturing Equipment | 20% | $28.6 billion | $5.7 billion |
| Textiles & Apparel | 15% | $22.4 billion | $3.4 billion |
| Copper Products | 50% | $12.8 billion | $6.4 billion |
| Steel & Aluminum | 25% | $18.3 billion | $4.6 billion |
| Chemical Products | 20% | $15.7 billion | $3.1 billion |
The product-specific tariff structure demonstrates strategic targeting of key industries, though the October 10 announcement of an additional 100% tariff means all Chinese products will face the 130% total rate starting November 1. Previously during the truce period, consumer electronics faced 25% tariffs on $35.2 billion in imports, generating substantial revenue while protecting domestic manufacturers. However, under the new 130% regime, consumer electronics imports from China are expected to collapse, forcing rapid supply chain diversification to countries like Vietnam, India, and Mexico.
Copper products, which faced the most aggressive tariff at 50% under Section 232 national security provisions during the truce, now join all other products at the 130% level. The rare earth dispute that triggered the October escalation highlights the critical vulnerability in strategic materials sourcing. China’s control over 90% of processed rare earths—used in semiconductors, defense systems, electric vehicles, and renewable energy—gives Beijing enormous leverage that cannot be quickly countered despite Trump’s claim that “for every Element they have been able to monopolize, we have two.”
Manufacturing equipment and chemical products previously subject to 20% tariffs now face the prohibitive 130% rate, creating severe challenges for American manufacturers who rely on Chinese machinery and inputs. The $28.6 billion in manufacturing equipment imports and $15.7 billion in chemical products demonstrate substantial industrial interdependence that cannot be quickly replaced. Companies face difficult choices between absorbing massive cost increases, passing them to consumers, or undertaking expensive and time-consuming supply chain restructuring.
Top 10 US Trade Partners and Tariff Revenue 2025
| Rank | Country | Total Trade | Tariff Revenue | Trade Balance |
|---|---|---|---|---|
| 1 | China | $195.1 billion | $30.7 billion | -$101.96 billion |
| 2 | Canada | $187.3 billion | $2.1 billion | +$24.8 billion |
| 3 | Mexico | $182.9 billion | $1.8 billion | -$15.2 billion |
| 4 | Japan | $142.6 billion | $1.2 billion | -$18.7 billion |
| 5 | Germany | $134.8 billion | $2.3 billion | -$22.4 billion |
| 6 | South Korea | $98.7 billion | $0.9 billion | -$8.3 billion |
| 7 | United Kingdom | $89.2 billion | $0.6 billion | +$12.1 billion |
| 8 | India | $87.4 billion | $1.4 billion | -$6.8 billion |
| 9 | Taiwan | $76.8 billion | $2.8 billion | -$14.2 billion |
| 10 | Italy | $68.9 billion | $0.8 billion | -$11.3 billion |
China maintains its position as the largest source of US tariff revenue, having generated $30.7 billion in the first five months of 2025 alone under varying tariff rates. With the new 130% tariff effective November 1, revenue projections become highly uncertain. While the tariff rate is much higher, import volumes are expected to collapse to levels similar to or below the April 2025 period, when prohibitive tariffs essentially halted trade. The net revenue effect depends on whether any significant trade continues at the 130% rate, or whether imports fall so dramatically that total revenue actually declines despite the higher rate.
Canada and Mexico, with substantial trade volumes of $187.3 billion and $182.9 billion respectively, generate minimal tariff revenue due to USMCA provisions that maintain largely tariff-free trade. The extreme contrast with China’s punitive 130% rate and the moderate rates on other trading partners demonstrates the uniquely confrontational nature of US-China economic relations. This disparity is expected to accelerate trade diversion, with imports shifting from China to other Asian manufacturers and North American partners, fundamentally reshaping global supply chains.
European Union trading partners, including Germany, the United Kingdom, and Italy, face moderate tariff burdens generating combined revenues of $3.7 billion during the January-May period. These relationships have remained relatively stable compared to the dramatic volatility in US-China trade. However, the October escalation with China creates spillover risks, as Chinese manufacturers may attempt to route products through third countries to avoid the 130% tariff, potentially triggering US scrutiny of imports from traditional trading partners and complicating enforcement of the tariff regime.
US-China Trade Revenue Analysis 2025
| Revenue Metric | Projection/Value |
|---|---|
| 10-Year Revenue Projection (2026-35) | $394 billion |
| Jan-May 2025 Revenue | $30.7 billion |
| Annual Revenue Rate (Jan-May pace) | ~$73.7 billion/year |
| Total 2035 Projection | $2.7 trillion |
| Manufacturing Output Growth | +1.5% |
| Construction Output Change | -3.1% |
| Agricultural Output Change | -1.1% |
The comprehensive revenue analysis for US-China trade in 2025 must now be fundamentally reconsidered following the October 10 tariff escalation. Previous projections of $394 billion over the 2026-2035 period assumed continuation of moderate tariff levels. The new 130% rate effective November 1 creates extreme uncertainty, as the prohibitive tariff level is likely to reduce Chinese imports to minimal levels, similar to the near-halt experienced in April 2025. While the tariff rate is much higher, if import volumes collapse by 80-90%, actual tariff revenue could decline despite the higher rate.
The economic restructuring effects will be dramatic and immediate. Previous modest manufacturing output expansion of 1.5% during earlier tariff periods will likely accelerate as companies have no choice but to relocate production or find alternative suppliers. However, this transition will be accompanied by severe short-term disruptions. Consumer price increases previously estimated at $1,254 per household in 2025 will likely double or triple as the 130% tariff forces rapid price adjustments across countless consumer goods categories, from electronics to clothing to household items.
The fiscal sustainability of current tariff policies is now highly questionable. The October escalation suggests the administration is willing to accept dramatic economic costs—including collapsing trade volumes, supply chain chaos, and severe stock market volatility (S&P 500 down 2.7% on the announcement)—in pursuit of strategic objectives related to rare earths and technology competition. The $2.7 trillion projection in total tariff revenue through 2035 now appears unrealistic, as the 130% rate will fundamentally restructure global supply chains away from China, permanently reducing the tax base for tariff collections.
Economic Impact of US Tariffs on China Trade 2025
| Economic Impact Metric | Estimated Value/Effect |
|---|---|
| Consumer Cost Increase (2025) | $1,254 per household |
| Consumer Cost Increase (2026) | $1,588 per household |
| Projected Cost Under 130% Tariff | $2,500-3,700 per household |
| Copper Tariff Rate | 50% |
| Construction Output Impact | -3.1% |
| Stock Market Drop (Oct 10) | S&P 500 -2.7% |
Consumer price increases represent the most immediate and severe impact of the 130% tariff taking effect November 1. Previous estimates of household cost increases at $1,254 in 2025 and $1,588 in 2026 now appear conservative. The near-prohibitive 130% tariff will force immediate and dramatic price increases across virtually all product categories sourced from China, or alternatively, severe product shortages as retailers and manufacturers scramble to find alternative suppliers. These costs fall disproportionately on lower-income households, creating extreme regressive distributional effects.
Supply chain disruption will reach crisis levels under the 130% tariff regime. American manufacturers and retailers have limited time to restructure supply chains that have been built over decades. The rare earth crisis presents particularly intractable challenges, as China’s control over 90% of processed rare earths cannot be quickly overcome. Industries dependent on rare earths—including semiconductors, electric vehicles, renewable energy, and defense systems—face potential production shutdowns or severe capacity constraints. The November 1 implementation of US export controls on critical software alongside the tariffs creates a dual economic shock.
International competitive effects will accelerate dramatically. Vietnam, India, and Mexico are positioned as primary beneficiaries of the US-China trade collapse, though these countries lack the industrial capacity to quickly replace Chinese production volumes. The October escalation also triggered immediate port fees on Chinese ships, with Beijing imposing reciprocal fees on US ships. This tit-for-tat expansion beyond tariffs into shipping, antitrust investigations (China’s probe of Qualcomm), and technology restrictions suggests a comprehensive economic confrontation with unclear end points and potentially devastating consequences for global commerce.
Market Reaction and Financial Impact
| Market Impact Metric | Change/Value |
|---|---|
| S&P 500 Drop (Oct 10) | -2.7% |
| Worst Selloff Comparison | Worst since April 2025 |
| Soybean Futures Impact | Sharp decline |
| Yuan Depreciation | 3-4% |
| Technology Stock Impact | Severe decline |
The October 10 announcement triggered severe market volatility, with the S&P 500 plunging 2.7% in its worst selloff since April 2025. The dramatic escalation caught investors off guard, as many had expected the truce period to continue through negotiated extensions. Technology stocks were particularly hard hit, facing both the 130% tariff impact and concerns about retaliatory Chinese measures including antitrust investigations and market access restrictions.
Agricultural commodity prices experienced sharp declines following the announcement. Soybean futures fell as traders recognized that Chinese purchases—historically the largest market for American soybeans—would effectively cease under the 130% tariff regime. Corn and wheat prices similarly declined as expectations for Chinese agricultural imports evaporated. American farmers face a bleak harvest season with no significant Chinese buying expected and global markets already oversupplied due to increased production in competing nations like Brazil and Argentina.
The dollar initially strengthened on safe-haven flows but faces longer-term pressure from the trade war escalation. Currency markets are pricing in potential Federal Reserve policy responses to economic disruption, while also considering China’s possible currency devaluation as a counter to US tariffs. The yuan has already depreciated 3-4% since the October announcement, potentially offsetting some tariff impact for Chinese exporters while raising concerns about competitive devaluation and further trade escalation.
Regional Trade Impact Analysis 2025
| Regional Impact Metric | Value/Change |
|---|---|
| West Coast Port Volume Decline | -20% |
| Expected Nov 2025 Port Decline | -40-50% additional |
| Soybean Export Decline | -35% |
| Corn Export Decline | -28% |
| Key Affected States | Iowa, Illinois, Nebraska, Ohio, Michigan |
West Coast ports have experienced the most significant impact from reduced Chinese imports, with container volume declines of approximately 20% compared to 2024 levels during the high tariff periods. Los Angeles and Long Beach ports, traditionally the primary entry points for Chinese goods, have seen substantial reductions in cargo handling, affecting employment and economic activity throughout the Southern California logistics corridor. The November implementation of 130% tariffs is expected to reduce container volumes by an additional 40-50%, creating severe employment challenges in the logistics and warehousing sectors.
Midwest agricultural regions face particular challenges from reduced export opportunities to China, with soybean and corn exports declining 35% and 28% respectively during the first half of 2025. Iowa, Illinois, and Nebraska farmers have experienced significant income reductions as Chinese buyers seek alternative suppliers, forcing American agricultural producers to accept lower prices in alternative markets with limited capacity to absorb displaced production. The October tariff escalation effectively eliminates remaining Chinese agricultural demand, creating a crisis for the 2025 harvest with insufficient global market capacity to replace lost Chinese purchases.
Manufacturing regions in the Great Lakes states have experienced mixed effects, with some industries benefiting from import protection while others face higher input costs. Ohio and Michigan automotive suppliers have seen increased demand for domestic components, while steel-using industries face cost pressures from both tariffs on imported steel and increased domestic steel prices resulting from import protection measures. The 130% tariff creates additional challenges as manufacturers scramble to source components and materials from alternative suppliers at significantly higher costs.
Rare Earth Supply Chain Crisis
| Rare Earth Crisis Metric | Value/Details |
|---|---|
| China’s Processing Share | 90% |
| Restricted Elements | 12 of 17 |
| US Domestic Processing Capacity | Minimal |
| Timeline to Build US Capacity | 5-10 years |
| Investment Required | $5-10 billion |
| Defense System Impact | Critical vulnerability |
The rare earth supply chain crisis triggered by China’s December 1 export restrictions represents one of the most serious strategic challenges facing American industry and defense. China now has export restrictions on 12 of the 17 rare earth elements, giving Beijing control over materials essential for advanced semiconductors, precision-guided weapons, electric vehicle motors, wind turbines, and countless other critical applications.
American companies face severe challenges in securing alternative rare earth supplies. While the United States has domestic rare earth deposits, including the Mountain Pass mine in California, processing capacity is minimal. China controls not just mining but also the complex and environmentally challenging refining and processing operations necessary to produce usable rare earth materials. Building equivalent processing capacity in the United States would require 5-10 years and investments of $5-10 billion, with no guarantee of economic viability given China’s established cost advantages.
The defense sector faces particularly acute vulnerabilities. Companies with any affiliation to foreign militaries will be largely denied export licenses starting December 1, 2025, potentially disrupting production of fighter jets, missiles, radar systems, and other advanced weapons platforms. The Pentagon is conducting emergency assessments of rare earth dependencies and exploring options including stockpiling, developing alternative materials, and accelerating domestic processing capability, though none of these solutions can address near-term supply disruptions.
Technology Sector Confrontation
| Technology Impact Metric | Details/Effect |
|---|---|
| US Export Control Date | November 1, 2025 |
| Covered Products | Critical software |
| China Antitrust Target | Qualcomm |
| Semiconductor Cost Increase | 15-25% |
| Technology Development Delay | 2-3 years |
| Supply Chain Fragmentation | Separate ecosystems emerging |
The technology sector faces escalating confrontation on multiple fronts. The November 1 implementation of US export controls on “any and all critical software” represents a dramatic expansion of technology restrictions, potentially covering operating systems, AI development tools, advanced simulation software, and specialized applications used in semiconductor manufacturing and other strategic industries. The broad language leaves uncertainty about scope and implementation, creating compliance challenges for technology companies with Chinese operations or customers.
China’s retaliatory measures include antitrust investigations targeting major American technology companies. The investigation into Qualcomm signals Beijing’s willingness to use regulatory tools as leverage in the trade dispute. Chinese authorities can impose substantial fines, restrict market access, or require technology transfers as remedies to antitrust findings, creating enormous pressure on American companies caught between US export restrictions and Chinese market retaliation.
Semiconductor supply chains face particular stress. American companies depend on Chinese rare earths for chip manufacturing, while Chinese companies depend on American software and manufacturing equipment. The escalating restrictions on both sides threaten to fragment global semiconductor supply chains, potentially creating separate technological ecosystems. Industry analysts estimate such fragmentation could increase semiconductor costs by 15-25% and delay technology development by 2-3 years as each side attempts to build independent capabilities.
International Response and Global Trade Realignment
| International Response Metric | Value/Impact |
|---|---|
| ASEAN Trade Diversion Potential | $50-75 billion |
| Capacity Building Timeline | 3-5 years |
| US-Mexico Trade Growth (2025) | 12-15% |
| Vietnam Investment Increase | Significant |
| European Trade Position | Concerned neutrality |
The European Union has expressed serious concerns about the US-China trade escalation and its impact on global supply chains. European manufacturers depend on both Chinese rare earth supplies and American technology, making them vulnerable to the escalating restrictions. The European Parliament has called on the Commission to address China’s export restrictions at the upcoming EU-China Summit, while also seeking to maintain stable trade relationships with the United States despite the aggressive tariff policies.
Asian trading partners face difficult choices as they navigate between the world’s two largest economies. Vietnam, South Korea, Taiwan, and other nations are experiencing increased investment as companies diversify away from China, but also face pressure from Beijing to limit cooperation with American supply chain restructuring efforts. The ASEAN nations collectively are positioned to capture $50-75 billion in trade diversion from China, though building necessary manufacturing capacity will require 3-5 years of sustained investment.
Mexico has emerged as a major beneficiary of nearshoring trends, with American companies increasingly viewing Mexican manufacturing as a solution to both Chinese tariff exposure and supply chain security concerns. Trade between the US and Mexico has grown 12-15% during 2025 as manufacturers relocate operations under USMCA’s tariff-free provisions. However, concerns about Chinese companies routing products through Mexico to avoid tariffs has led to increased US customs scrutiny and pressure on Mexico to implement stricter rules of origin verification.
Future Projections and Policy Implications 2025-2026
| Future Projection Metric | Outlook/Timeline |
|---|---|
| Policy Sustainability | Highly uncertain |
| Economic Recession Risk | Elevated |
| Supply Chain Investment | $100+ billion |
| Restructuring Timeline | 3-5 years |
| Q1 2026 Data | Critical decision point |
Trade policy evolution through the remainder of 2025 and into 2026 faces extreme uncertainty following the October escalation. The breakdown of diplomatic engagement, with Trump stating there is no reason to meet with Xi, suggests limited near-term prospects for de-escalation. The 130% tariff rate and comprehensive export controls represent near-maximum economic pressure, leaving little room for further escalation beyond complete trade prohibition.
Economic performance indicators will be critical in determining policy sustainability. If the 130% tariff triggers recession, financial market collapse, or severe consumer hardship, political pressure for policy modification could mount rapidly. However, if manufacturing reshoring accelerates and domestic production expands without catastrophic disruption, the administration may view the policy as successful despite higher consumer costs. The first quarter 2026 economic data will likely be decisive in shaping policy direction.
Structural changes in global trade relationships appear increasingly permanent regardless of near-term policy adjustments. Companies making $100 billion+ in supply chain restructuring investments are unlikely to return to China-dependent models even if tariffs eventually moderate. The rare earth crisis has highlighted strategic vulnerabilities that will drive long-term diversification efforts. The bifurcation of technology ecosystems, if it continues, will reshape global innovation patterns for decades.
Business adaptation strategies must now focus on fundamental supply chain transformation rather than tactical tariff management. Companies need to develop 3-5 year restructuring plans assuming continued US-China trade restrictions. Critical actions include: diversifying sourcing across multiple countries, investing in domestic production capacity where economically viable, securing rare earth supplies through long-term contracts or strategic partnerships, developing alternative materials and technologies to reduce critical dependencies, and building flexible supply chains capable of adapting to continued policy volatility.
The long-term sustainability of current tariff policies depends on achieving structural changes in bilateral trade relationships while minimizing economic disruption costs that could undermine broader economic growth objectives. The $394 billion in projected revenue over the next decade provides fiscal resources for economic transition support, though the ultimate success of trade policy will be measured by its ability to enhance American economic competitiveness while maintaining overall prosperity and international economic relationships. The November 2025 implementation of 130% tariffs and comprehensive export controls represents a decisive test of whether extreme trade protection can successfully restructure global economic relationships or will instead trigger economic crisis requiring policy reversal.
Business Adaptation and Supply Chain Restructuring
| Business Strategy Metric | Timeline/Value |
|---|---|
| Supply Chain Restructuring Cost | $100+ billion |
| Average Company Transition | 3-5 years |
| Alternative Supplier Countries | Vietnam, India, Mexico, Thailand |
| Domestic Production Investment | Significant increase |
| Rare Earth Stockpiling | Emergency priority |
American businesses face unprecedented challenges requiring fundamental restructuring of supply chains built over decades. The 130% tariff makes Chinese sourcing economically unviable for most products, forcing companies to rapidly develop alternative supplier networks. Leading manufacturers are investing $100+ billion collectively in supply chain diversification, with individual company transitions requiring 3-5 years to complete fully.
Vietnam has emerged as the primary alternative manufacturing destination, with foreign direct investment surging as companies relocate production capacity. However, Vietnam’s infrastructure and workforce cannot immediately replace China’s manufacturing ecosystem. India offers long-term potential with its large workforce and growing manufacturing capabilities, but bureaucratic challenges and infrastructure gaps require patient capital and extended timelines. Mexico provides nearshoring advantages under USMCA, enabling tariff-free access while reducing supply chain complexity and transportation costs.
Rare earth dependencies present the most intractable challenge. Companies cannot simply switch suppliers, as China controls 90% of processing capacity. Short-term strategies include aggressive stockpiling of critical materials, though this only defers the problem. Medium-term approaches involve investing in alternative processing capabilities in Australia, Canada, and the United States, requiring $5-10 billion in capital and 5-10 years to achieve meaningful scale. Long-term solutions demand breakthrough technologies using alternative materials or recycling rare earths from electronic waste.
Agricultural Sector Crisis and Farm Impact
| Agricultural Impact Metric | Value/Change |
|---|---|
| Soybean Export Decline | -35% |
| Corn Export Decline | -28% |
| 2025 Harvest Chinese Orders | Zero |
| Price Decline (Soybeans) | Sharp drop |
| Key Affected States | Iowa, Illinois, Nebraska |
The agricultural sector faces its most severe crisis in decades as Chinese buying—historically the largest export market—has completely ceased. American farmers have received zero Chinese orders for the 2025 harvest, with no prospects for resumption under the 130% tariff regime. Soybean exports to China have declined 35%, corn exports 28%, with farmers forced to accept significantly lower prices in alternative markets already oversupplied by Brazilian and Argentine production.
Iowa, Illinois, and Nebraska farmers face particularly dire circumstances. These states depend heavily on Chinese agricultural exports, with many farmers having invested in expanded production capacity based on historical Chinese demand. The sudden loss of this market creates severe financial stress, with many farmers facing negative cash flows and potential bankruptcy. Farm equipment purchases have collapsed, creating ripple effects throughout rural economies dependent on agricultural prosperity.
Alternative markets cannot absorb displaced American production. Brazil and Argentina have expanded soybean production specifically to capture Chinese market share, while other Asian buyers lack the import capacity to replace Chinese demand. European markets have limited growth potential due to domestic production and different commodity specifications. The 2025 harvest represents a crisis point, with insufficient storage capacity for unsold production and no clear path to market recovery.
Technology Supply Chain Decoupling
| Technology Decoupling Metric | Impact/Timeline |
|---|---|
| Software Export Control Date | November 1, 2025 |
| Semiconductor Cost Increase | 15-25% |
| Technology Delay | 2-3 years |
| R&D Investment Needed | Substantial |
| Separate Ecosystem Risk | High |
The technology sector confronts unprecedented fragmentation as US and Chinese policies drive creation of separate technological ecosystems. The November 1 export controls on “critical software” combined with China’s rare earth restrictions threaten to permanently divide global technology supply chains. American companies must develop China-independent capabilities while Chinese firms build alternatives to US technology, creating massive duplication of effort and slowing innovation.
Semiconductor manufacturing faces immediate crisis. American chipmakers depend on Chinese rare earths for production while Chinese manufacturers need American equipment and software. The escalating restrictions threaten to halt production on both sides unless alternative arrangements emerge. Industry estimates suggest fragmented supply chains will increase semiconductor costs 15-25% while delaying next-generation technology development by 2-3 years.
Artificial intelligence development risks bifurcation into separate US and Chinese systems with incompatible standards and architectures. This fragmentation could extend to telecommunications networks, operating systems, cloud computing platforms, and countless other technology domains. The economic costs of such duplication are enormous, while the strategic implications for global technology standards and digital infrastructure could reshape international commerce for generations.
Federal Reserve and Monetary Policy Response
| Monetary Policy Metric | Outlook/Action |
|---|---|
| Interest Rate Pressure | Conflicting signals |
| Inflation Impact | Significant upward |
| Growth Concerns | Recession risk |
| Dollar Strength | Initially strong, long-term uncertain |
| Policy Options | Constrained |
The Federal Reserve faces unprecedented challenges as the 130% tariff creates conflicting inflationary and recessionary pressures. Consumer price increases from tariff-induced cost rises suggest need for restrictive monetary policy, while collapsing trade volumes and supply chain disruptions threaten recession requiring accommodative measures. Chair Powell has indicated the Fed is monitoring the situation closely but has avoided committing to specific policy responses.
Inflation pressures from the 130% tariff could add 1-2 percentage points to consumer price indices, forcing the Fed to maintain higher interest rates despite growth concerns. However, if tariffs trigger severe recession, the Fed may need to cut rates aggressively even as prices rise, accepting higher inflation to prevent economic collapse. This stagflationary scenario represents the Fed’s worst nightmare, with no good policy options.
Financial market stability concerns are mounting. The 2.7% S&P 500 decline following the tariff announcement raised fears of broader market collapse if economic disruption intensifies. The Fed stands ready to provide liquidity support if market functioning deteriorates, but its traditional tools are less effective against trade policy-induced disruption. The dollar’s strength provides some inflation buffer but risks becoming excessive, further damaging American export competitiveness.
Consumer Impact and Retail Sector Response
| Consumer Impact Metric | Value/Effect |
|---|---|
| Household Cost (2025) | $1,254 |
| Household Cost (2026) | $1,588 |
| Projected Under 130% Tariff | $2,500-3,700 |
| Product Availability | Shortages expected |
| Price Increase Timeline | Immediate |
American consumers face immediate and severe price increases across virtually all product categories as the 130% tariff takes effect November 1. Previous estimates of $1,254 per household in additional costs now appear dramatically conservative, with revised projections suggesting $2,500-3,700 annual increases under the 130% regime. These costs fall disproportionately on lower-income households that spend larger portions of income on imported consumer goods.
Retail sector faces dual crisis of rising costs and consumer resistance to higher prices. Major retailers including Walmart, Target, and Amazon must either absorb enormous cost increases, pass them to consumers risking sales collapse, or rapidly restructure supply chains at great expense and operational disruption. Many retailers are implementing all three strategies simultaneously—accepting reduced margins, raising prices selectively, and accelerating sourcing diversification.
Product availability concerns are mounting as retailers and manufacturers exhaust existing inventories of Chinese-sourced goods. The 130% tariff makes replenishment economically unviable for most products, creating potential shortages in electronics, apparel, household goods, and countless other categories. Holiday shopping season 2025 could see unprecedented product scarcity, with consumers unable to find desired items at any price as supply chains remain in transition.
Environmental and Climate Policy Implications
| Environmental Impact Metric | Effect |
|---|---|
| Rare Earth for Green Tech | Critical shortage |
| EV Production Impact | Severely constrained |
| Wind Turbine Manufacturing | Disrupted |
| Solar Panel Supply Chain | Mixed impact |
| Climate Goals | At risk |
The rare earth crisis poses severe challenges for climate policy and clean energy transition. China’s control over 90% of processed rare earths means electric vehicle production, wind turbines, and other renewable energy technologies face critical material shortages. The December 1 export restrictions specifically target materials essential for permanent magnets in EV motors and wind turbine generators, potentially derailing clean energy deployment targets.
Electric vehicle manufacturing faces immediate constraints as automakers struggle to secure neodymium, praseodymium, dysprosium, and terbium for motor magnets. Without these materials, EV production cannot scale to meet climate goals or regulatory mandates. Automakers are exploring alternative motor designs using different materials, but such technologies remain years from commercial viability at scale. The 130% tariff on Chinese-manufactured EV components compounds the crisis.
Renewable energy deployment similarly depends on rare earths for wind turbine generators and various solar panel components. Ambitious clean energy targets adopted by states and the federal government assume continued access to these materials. The combination of Chinese export restrictions and US tariffs threatens to slow renewable energy deployment precisely when climate science demands acceleration. Policymakers face difficult choices between climate goals and China policy objectives.
Defense and National Security Implications
| Defense Impact Metric | Severity/Timeline |
|---|---|
| Rare Earth Dependence | Critical vulnerability |
| Weapons Production Risk | High |
| Pentagon Stockpile | Limited duration |
| Alternative Source Timeline | 5-10 years |
| Defense Budget Impact | Significant increase needed |
The Department of Defense faces its most serious supply chain crisis in modern history as China’s rare earth restrictions threaten production of advanced weapons systems. Fighter jets, precision-guided missiles, radar systems, submarines, and countless other platforms depend on rare earth permanent magnets, specialty alloys, and electronic components sourced from China. The December 1 restrictions explicitly target companies with military affiliations, potentially halting critical defense production.
Pentagon stockpiles provide only limited buffer against supply disruptions. While the Defense Logistics Agency maintains strategic reserves of critical materials, these stocks are insufficient for extended production under wartime mobilization scenarios. The military is conducting emergency assessments of rare earth dependencies across all weapons programs, identifying critical vulnerabilities and exploring alternative materials or technologies.
Domestic production capacity represents the only long-term solution, but building rare earth processing infrastructure requires 5-10 years and substantial investment. The Pentagon is exploring emergency authorities to accelerate domestic production, including potential Defense Production Act invocations, direct government investment in processing facilities, and guaranteed purchase agreements to ensure economic viability. However, none of these approaches can address immediate vulnerabilities if Chinese supplies are completely cut off.
Disclaimer: The data research report we present here is based on information found from various sources. We are not liable for any financial loss, errors, or damages of any kind that may result from the use of the information herein. We acknowledge that though we try to report accurately, we cannot verify the absolute facts of everything that has been represented.