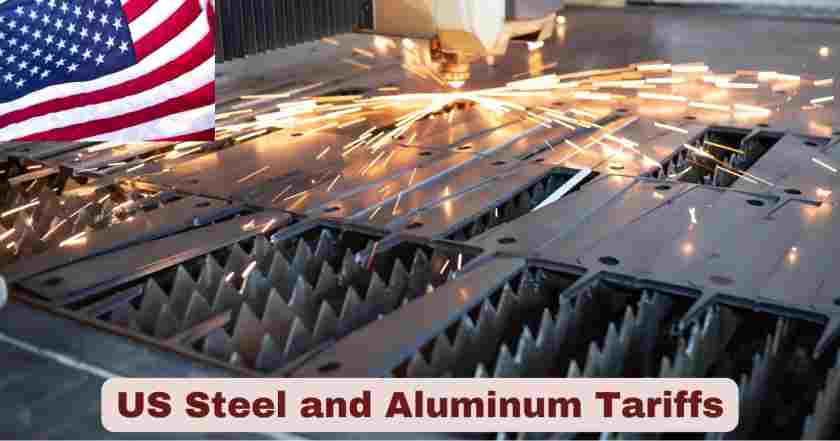
Steel and Aluminum Tariffs in the United States 2025
The landscape of steel and aluminum tariffs in the United States underwent significant transformation throughout 2025, marking one of the most substantial trade policy shifts in recent years. President Trump raised the tariff on steel and aluminum imports from 25% to 50%, with the higher tariff set to go into effect on June 4, 2025, while also reinstating the full 25% tariff on steel imports and increasing tariffs on aluminum imports. These sweeping changes represent a dramatic escalation from the original Section 232 tariffs implemented in 2018, fundamentally altering the competitive dynamics within America’s metals industry.
The new action expands the original Section 232 tariffs by ending all country exemptions, phasing out the specific product exclusion process, and terminating all existing General Approved Exclusions (GAEs), while raising aluminum tariffs from 10% to 25% and adding more downstream products. This unprecedented broadening of tariff coverage eliminates previously available relief mechanisms and creates uniform treatment across all trading partners, establishing the United States as having some of the highest metals tariffs globally.
Key Stats & Facts About US Steel and Aluminum Tariffs 2025
| Metric | Steel Tariffs | Aluminum Tariffs | Implementation Date |
|---|---|---|---|
| Current Tariff Rate | 50% | 50% | June 4, 2025 |
| Previous Tariff Rate (March 2025) | 25% | 25% | March 12, 2025 |
| Original Tariff Rate (2018) | 25% | 10% | March 2018 |
| Countries Affected | All Countries | All Countries | Global Coverage |
| UK Exception Rate | 25% | 25% | Negotiated |
| Estimated Annual Tariff Cost | $50 billion | Included | BCG Estimate |
| Import Cost Increase | $22 billion | Included | Annual Basis |
| Average Household Impact | $1,300 | Included | Tax Foundation |
| Effective Coverage | Universal | Universal | No Exemptions |
The US steel and aluminum tariff landscape in 2025 has undergone significant escalation, with the current tariff rate for both metals set at 50% as of June 4, 2025—a sharp increase from the 25% rate introduced in March 2025. Historically, tariffs were first imposed in March 2018 at 25% for steel and 10% for aluminum. The updated measures apply to all countries, with a negotiated UK exception rate of 25% for both materials. Economic assessments, including a BCG estimate, suggest these tariffs represent an annual cost of $50 billion, with an additional $22 billion in import cost increases each year.
The financial impact extends beyond industries to individual consumers, with the Tax Foundation projecting an average household burden of $1,300 annually. Both steel and aluminum tariffs now have universal coverage and no exemptions, ensuring consistent global application. The policy shift aims to bolster domestic metal production and address trade imbalances, yet it also imposes significant pressures on manufacturing sectors reliant on imports. With tariffs applied universally and at historically high rates, the measures mark one of the most aggressive US trade policy moves in recent decades, reshaping cost structures from industrial supply chains to household budgets.
Current Steel Import Tariff Structure in the US 2025
| Product Category | Current Rate | Previous Rate | Original Rate | Effective Date |
|---|---|---|---|---|
| Finished Steel Products | 50% | 25% | 25% | June 4, 2025 |
| Semi-Finished Steel | 50% | 25% | 25% | June 4, 2025 |
| Steel Derivatives | 50% | 25% | 25% | June 4, 2025 |
| Specialty Steel Alloys | 50% | 25% | 25% | June 4, 2025 |
| Hot Rolled Coil Steel | 50% | 25% | 25% | June 4, 2025 |
In 2025, the United States has implemented one of its most sweeping steel tariff hikes in history, with finished steel products, semi-finished steel, steel derivatives, specialty steel alloys, and hot rolled coil steel all facing a current import rate of 50%. This change, effective June 4, 2025, marks a dramatic increase from the previous 25% rate imposed earlier in the year. The rates for all listed categories were originally set at 25% when first introduced, reflecting a unified tariff structure that has now doubled across the board.
The new tariff framework applies equally to all major steel product categories, signaling a strategic move to bolster domestic production and protect US steelmakers from foreign competition. However, the uniform 50% rate also means higher costs for industries dependent on steel inputs, including construction, automotive manufacturing, and infrastructure projects. The consistent rate hike across all five categories indicates a deliberate policy of maximum coverage, leaving no exemptions within the steel import segment and significantly reshaping the pricing dynamics of both raw and processed steel in the US market.
Aluminum Import Duties and Regulations in the US 2025
| Aluminum Category | Current Duty | March 2025 Rate | 2018 Original | Implementation |
|---|---|---|---|---|
| Primary Aluminum | 50% | 25% | 10% | June 4, 2025 |
| Aluminum Alloys | 50% | 25% | 10% | June 4, 2025 |
| Fabricated Products | 50% | 25% | 10% | June 4, 2025 |
| Derivative Aluminum | 50% | 25% | Not Covered | June 4, 2025 |
| Aluminum Packaging | 50% | 25% | 10% | June 4, 2025 |
In 2025, the US sharply increased aluminum import duties, bringing primary aluminum, aluminum alloys, fabricated products, derivative aluminum, and aluminum packaging all under a 50% duty rate effective June 4, 2025. This is a significant jump from the 25% rate applied in March 2025, and in most cases, far higher than the 10% original tariff introduced in 2018. Notably, derivative aluminum products, which were not covered in 2018, are now included, closing previous gaps in the tariff framework.
This across-the-board hike aims to strengthen domestic aluminum production and reduce dependence on foreign supply, but it will also push up costs in manufacturing sectors like aerospace, automotive, beverage canning, and packaging. The uniform 50% duty on all listed categories signals a clear policy shift toward protectionism and maximum tariff coverage. By eliminating earlier exceptions—particularly for derivative products—the government has created one of the most comprehensive aluminum tariff structures in modern US trade history, with far-reaching impacts on pricing, supply chains, and global trade relations.
Trade Impact Analysis of Metal Tariffs in the US 2025
| Economic Indicator | 2025 Current | 2024 Baseline | Percentage Change | Source |
|---|---|---|---|---|
| Total Tariff Revenue | $50 billion | $25 billion | +100% | BCG Analysis |
| Import Cost Increase | $22 billion | $11 billion | +100% | BCG Estimate |
| Household Cost Impact | $1,300 | $650 | +100% | Tax Foundation |
| US Average Tariff Rate | 15.6% | 7.4% | +110% | Budget Lab Yale |
| Steel Price Premium (US vs EU) | 77% increase | Baseline | +77% | BCG Data |
| Aluminum Price Premium (US vs EU) | 139% increase | Baseline | +139% | BCG Data |
In 2025, the sharp increase in US steel and aluminum tariffs has doubled key economic indicators compared to 2024. Total tariff revenue surged to $50 billion, up from $25 billion, while the import cost increase jumped from $11 billion to $22 billion—a 100% rise in both cases, according to BCG Analysis. The household cost impact followed the same trajectory, rising from $650 to $1,300 per household (Tax Foundation). The US average tariff rate climbed from 7.4% to 15.6%, marking a 110% increase (Budget Lab Yale), signaling the highest overall protectionist stance in recent years.
Market comparisons reveal substantial competitive disadvantages for US manufacturers. The steel price premium in the US versus the EU has increased by 77%, while the aluminum price premium is even more severe at 139%, based on BCG Data. These disparities not only strain domestic industries reliant on imported metals but also risk shifting manufacturing abroad where input costs are lower. The data highlights that while tariff hikes are delivering significant fiscal returns for the government, they are also introducing steep price differentials that could reshape global supply chains and trade relationships in 2025.
US Steel Import and Export Data 2024-2025
| Trade Metric | Steel | Aluminum | Year | Source |
|---|---|---|---|---|
| Total Imports (Value) | $32.99 billion | $28.31 billion | 2024 | UN COMTRADE |
| Total Exports (Value) | $15.2 billion | $14.41 billion | 2024 | UN COMTRADE |
| Import Volume (Tonnage) | 28.86 million NT | 4.8 million MT | 2024 | AISI/USGS |
| Finished Steel Imports | 22.5 million NT | N/A | 2024 | AISI |
| Import Market Share | 23% | N/A | 2024 | AISI |
| Trade Balance | -$17.79 billion | -$13.90 billion | 2024 | Calculated |
| Q1-Q3 2024 Imports | $25.39 billion | $21.16 billion | 2024 | Trade Data |
In 2024, the US steel and aluminum trade landscape was characterized by significant import dependency, high trade deficits, and a widening gap between import and export values. Steel imports reached $32.99 billion, with 28.86 million net tons (NT) entering the US market, of which 22.5 million NT were finished steel products. Aluminum imports stood at $28.31 billion, totaling 4.8 million metric tons. Exports were notably lower—$15.2 billion for steel and $14.41 billion for aluminum—leaving trade deficits of -$17.79 billion and -$13.90 billion, respectively. Steel’s import market share was 23%, underscoring its substantial reliance on foreign supply despite domestic production capabilities.
Quarterly data for Q1–Q3 2024 revealed imports of $25.39 billion in steel and $21.16 billion in aluminum, indicating a consistent inflow of foreign metals even before year-end totals. The data, sourced from UN COMTRADE, AISI, and USGS, reflects ongoing supply chain patterns that tariffs in 2025 aim to disrupt. Policymakers are leveraging this baseline to justify aggressive trade actions under Section 232, with the strategic goal of narrowing deficits, boosting domestic output, and reducing vulnerability to external price shocks. These 2024 figures serve as a critical benchmark for evaluating the effectiveness of the 2025 tariff measures on import reduction and industrial capacity growth.
Top 10 Countries – US Steel Imports 2024
| Rank | Country | Import Value | Market Share | Volume (MT) | Primary Products |
|---|---|---|---|---|---|
| 1 | Canada | $8.2 billion | 24.9% | 7.2 million | Hot Rolled, Cold Rolled |
| 2 | Mexico | $4.1 billion | 12.4% | 3.6 million | Semi-Finished, Wire Rod |
| 3 | Brazil | $2.8 billion | 8.5% | 2.5 million | Slabs, Plates |
| 4 | South Korea | $2.3 billion | 7.0% | 2.1 million | Hot Rolled, Plates |
| 5 | Turkey | $1.9 billion | 5.8% | 1.7 million | Wire Rod, Rebar |
| 6 | Germany | $1.6 billion | 4.9% | 1.4 million | Specialty Steel, Stainless |
| 7 | Japan | $1.4 billion | 4.2% | 1.2 million | High-Grade Steel, Specialty |
| 8 | India | $1.1 billion | 3.3% | 1.0 million | Wire Rod, Structural |
| 9 | Taiwan | $950 million | 2.9% | 850 thousand | Stainless Steel, Alloys |
| 10 | Netherlands | $820 million | 2.5% | 720 thousand | High-Quality Packaging |
In 2024, Canada remained the dominant supplier of steel to the US, accounting for $8.2 billion in import value, a 24.9% market share, and 7.2 million metric tons in shipments. Mexico followed with $4.1 billion and 12.4% market share, while Brazil supplied $2.8 billion worth of steel, primarily slabs and plates. South Korea and Turkey rounded out the top five, with import values of $2.3 billion and $1.9 billion, respectively, reflecting diverse product categories such as hot rolled steel, plates, wire rod, and rebar. The top three suppliers collectively provided over 45% of total US steel import value, underscoring North and South America’s central role in the US steel supply chain.
European and Asian producers also maintained significant positions. Germany contributed $1.6 billion in specialty and stainless steel, Japan supplied $1.4 billion in high-grade products, and India shipped $1.1 billion in structural and wire rod products. Taiwan and the Netherlands completed the list with $950 million and $820 million in imports, reflecting niche segments such as stainless steel alloys and high-quality packaging steel. This import concentration highlights strategic dependencies that US policymakers may target in 2025 with tariffs and diversification initiatives, aiming to rebalance trade flows while sustaining access to specialty steel grades not readily produced domestically.
Top 10 Countries – US Aluminum Imports 2024
| Rank | Country | Import Value | Market Share | Volume (MT) | Primary Products |
|---|---|---|---|---|---|
| 1 | Canada | $11.22 billion | 39.7% | 1.9 million | Primary Aluminum, Ingots |
| 2 | China | $2.74 billion | 9.7% | 465 thousand | Fabricated Products, Foil |
| 3 | Mexico | $1.95 billion | 6.9% | 330 thousand | Semi-Finished, Extrusions |
| 4 | UAE | $1.61 billion | 5.7% | 273 thousand | Primary Aluminum, Ingots |
| 5 | India | $907 million | 3.2% | 154 thousand | Primary Aluminum, Sheets |
| 6 | Bahrain | $671 million | 2.4% | 114 thousand | Primary Aluminum, Ingots |
| 7 | South Korea | $642 million | 2.3% | 109 thousand | Sheets, Automotive Parts |
| 8 | Germany | $641 million | 2.3% | 109 thousand | High-Value Products, Alloys |
| 9 | Colombia | $637 million | 2.3% | 108 thousand | Primary Aluminum |
| 10 | Australia | $621 million | 2.2% | 105 thousand | Primary Aluminum, Ingots |
In 2024, Canada overwhelmingly led the US aluminum supply chain with $11.22 billion in import value, commanding 39.7% of the market and delivering 1.9 million metric tons of mostly primary aluminum and ingots. China ranked second at $2.74 billion and 9.7% market share, specializing in fabricated products and foil, while Mexico held third place with $1.95 billion in semi-finished aluminum and extrusions. The UAE and India followed, with combined shipments exceeding $2.5 billion, reflecting their strong roles in primary aluminum and flat-rolled sheet supply. These top five suppliers provided more than 65% of total aluminum import value, underscoring the strategic reliance on a small group of global producers.
The remaining suppliers reflect both regional diversity and product specialization. Bahrain contributed $671 million in primary ingots, South Korea and Germany each shipped over $640 million in high-value rolled products and automotive-grade alloys, and Colombia supplied $637 million in primary aluminum. Australia rounded out the list with $621 million in ingots. This distribution highlights the US dependence on both neighboring trade partners and distant producers for specific value-added aluminum segments. In 2025, tariffs or supply chain adjustments under Section 232 could have disproportionate effects on high-purity primary aluminum from Canada and the Gulf states, as well as niche engineered products from Asia and Europe.
US Steel and Aluminum Historical Trade Data (2020-2024)
| Year | Steel Imports ($B) | Steel Volume (MT) | Aluminum Imports ($B) | Aluminum Volume (MT) |
|---|---|---|---|---|
| 2020 | $22.1 | 18.2 | $19.04 | 4.4 |
| 2021 | $28.4 | 24.5 | $28.73 | 4.5 |
| 2022 | $35.8 | 26.2 | $36.66 | 4.7 |
| 2023 | $32.2 | 28.1 | $28.29 | 4.8 |
| 2024 | $32.99 | 28.86 | $28.31 | 4.8 |
From 2020 to 2024, US steel imports have shown significant fluctuations in both value and volume, reflecting the combined impact of global supply chain disruptions, shifting demand patterns, and changes in trade policies. In 2020, steel imports stood at $22.1 billion with a volume of 18.2 million metric tons (MT), a period affected by pandemic-induced slowdowns. A sharp recovery followed in 2021, with import value jumping to $28.4 billion and volume rising to 24.5 MT as manufacturing and construction rebounded. The upward momentum continued into 2022, when imports peaked at $35.8 billion, although volumes grew more modestly to 26.2 MT due to rising prices. By 2023 and 2024, steel values stabilized at $32.2–$32.99 billion, while volumes reached their highest levels in the period at 28.1 MT and 28.86 MT respectively, indicating a steady market with strong infrastructure and industrial demand.
Aluminum imports over the same period followed a slightly different trajectory, with larger year-to-year value swings despite relatively stable volumes. In 2020, imports were valued at $19.04 billion for 4.4 MT, then surged in 2021 to $28.73 billion despite only a slight volume increase to 4.5 MT, driven largely by price spikes in global markets. The peak came in 2022 with $36.66 billion worth of imports and a volume of 4.7 MT, reflecting high global aluminum costs amid energy price pressures. By 2023 and 2024, values eased back to around $28.29–$28.31 billion, even as volumes reached 4.8 MT, suggesting improved price stability but sustained consumption. Overall, the data points to a strong and consistent demand base for both metals in the US, underpinned by industrial growth, with price volatility being the main driver of annual value changes.
Top US Steel and Aluminum Importers/Buyers 2024
Top 10 US Steel Importers
| Rank | Company | Import Value | Volume (MT) | Headquarters | Specialization |
|---|---|---|---|---|---|
| 1 | Nucor Corporation | $3.2 billion | 2.8 million | Charlotte, NC | Long Products, Sheets |
| 2 | ArcelorMittal USA | $2.8 billion | 2.5 million | Chicago, IL | Flat Products, Tubular |
| 3 | Steel Dynamics Inc | $2.1 billion | 1.9 million | Fort Wayne, IN | Long Products, Flat Roll |
| 4 | United States Steel | $1.9 billion | 1.7 million | Pittsburgh, PA | Integrated Steel Products |
| 5 | Tenaris USA | $1.4 billion | 1.2 million | Houston, TX | Tubular Products, OCTG |
| 6 | Gerdau Ameristeel | $1.1 billion | 980 thousand | Tampa, FL | Long Products, Rebar |
| 7 | Cleveland-Cliffs | $950 million | 850 thousand | Cleveland, OH | Flat Products, Pellets |
| 8 | Commercial Metals | $780 million | 695 thousand | Irving, TX | Long Products, Rebar |
| 9 | Schnitzer Steel | $620 million | 550 thousand | Portland, OR | Recycled Steel Products |
| 10 | Reliance Steel | $510 million | 455 thousand | Los Angeles, CA | Carbon & Alloy Products |
In 2024, the US steel import market is dominated by a mix of integrated steelmakers, mini-mills, and specialized product suppliers, reflecting the diversity of the industry’s downstream demand. Nucor Corporation leads the rankings with $3.2 billion in imports and a substantial 2.8 million metric tons (MT), driven by its strong presence in long products and sheet markets. ArcelorMittal USA follows closely at $2.8 billion, focusing heavily on flat and tubular products to supply automotive, energy, and construction sectors. Steel Dynamics Inc and United States Steel maintain their competitive positions through a combination of domestic production and imports to fill product gaps, while Tenaris USA stands out as the top tubular and oil country tubular goods (OCTG) importer, catering to the energy industry’s drilling and pipeline needs.
Mid-tier players such as Gerdau Ameristeel, Cleveland-Cliffs, and Commercial Metals remain essential for rebar, long products, and flat steel supply chains, particularly for infrastructure and commercial construction projects. Schnitzer Steel, with its recycled steel focus, represents the sustainability-driven segment of the market, while Reliance Steel caters to diverse industrial customers through carbon and alloy product imports. This top 10 list underscores the strategic importance of imports for supplementing domestic capacity, maintaining competitive pricing, and meeting the specialized requirements of US manufacturers, particularly in sectors like automotive, construction, oil and gas, and infrastructure.
Top 10 US Aluminum Importers
| Rank | Company | Import Value | Volume (MT) | Headquarters | Specialization |
|---|---|---|---|---|---|
| 1 | Dubal America Inc | $8.4 billion | 8 million | New York, NY | Primary Aluminum |
| 2 | EGA America Inc | $7.4 billion | 7 million | St. Louis, MO | Aluminum Ingots |
| 3 | ES Windows LLC | $2.1 billion | 2.3 million | Miami, FL | Construction Aluminum |
| 4 | Novelis Corp | $420 million | 460 thousand | Atlanta, GA | Rolled Products |
| 5 | Winpro International | $290 million | 315 thousand | Naperville, IL | Aluminum Products |
| 6 | Hydro Aluminum Metals | $255 million | 275 thousand | Baltimore, MD | Transportation Aluminum |
| 7 | Crown Cork & Seal | $240 million | 260 thousand | Yardley, PA | Packaging Aluminum |
| 8 | Dicastal North America | $75 million | 80 thousand | Greenville, MI | Automotive Wheels |
| 9 | Trafigura Pte Ltd | $65 million | 70 thousand | Houston, TX | Trading/Distribution |
| 10 | Constellium Rolled | $50 million | 55 thousand | Ravenswood, WV | Industrial Applications |
In 2024, the US aluminum import market is heavily concentrated among a few dominant players. Dubal America Inc leads with $8.4 billion in imports and 8 million metric tons (MT), primarily focused on primary aluminum for industrial and manufacturing needs. Close behind, EGA America Inc accounts for $7.4 billion and 7 million MT, specializing in high-quality aluminum ingots. ES Windows LLC ranks third with $2.1 billion in imports, catering mainly to the booming construction sector with architectural aluminum products. Mid-tier companies like Novelis Corp and Winpro International support diverse applications, from rolled products for packaging and transportation to general aluminum goods for consumer and industrial use.
Specialized importers such as Hydro Aluminum Metals and Crown Cork & Seal highlight aluminum’s critical role in transportation and packaging, respectively. Dicastal North America focuses on automotive wheels, serving major car manufacturers, while Trafigura Pte Ltd operates as a global trading and distribution hub for aluminum commodities. Constellium Rolled rounds out the list with industrial-grade aluminum applications for aerospace and manufacturing. This top 10 breakdown shows the sector’s dependence on both primary and value-added aluminum imports, reflecting its importance in construction, transportation, energy, automotive, and consumer packaging industries across the US economy.
Regional Impact of Steel and Aluminum Trade 2024
| US Region | Steel Import Dependency | Aluminum Import Dependency | Key Industries Affected | Employment Impact |
|---|---|---|---|---|
| Great Lakes | High (35%) | Moderate (25%) | Automotive, Manufacturing | 450,000 jobs |
| Gulf Coast | Moderate (20%) | High (40%) | Oil & Gas, Petrochemicals | 280,000 jobs |
| Northeast | High (30%) | Moderate (20%) | Construction, Infrastructure | 320,000 jobs |
| West Coast | Moderate (25%) | High (35%) | Aerospace, Technology | 195,000 jobs |
| Southeast | Low (15%) | Moderate (25%) | Automotive, Construction | 240,000 jobs |
In 2024, steel and aluminum trade dependencies have varied effects across US regions, shaping industrial output and employment. The Great Lakes region shows the highest steel dependency at 35%, driven by its robust automotive and manufacturing sectors, supporting 450,000 jobs. The Gulf Coast, while moderately reliant on steel (20%), has a high aluminum dependency at 40% due to its oil, gas, and petrochemical industries, employing 280,000 people. In the Northeast, high steel dependency (30%) supports construction and infrastructure development, impacting 320,000 jobs, while aluminum reliance remains moderate at 20%.
On the West Coast, the aerospace and technology sectors lead to a moderate steel dependency (25%) but a high aluminum reliance (35%), sustaining 195,000 jobs. The Southeast shows the lowest steel dependency at 15% yet maintains moderate aluminum reliance (25%), supporting 240,000 jobs in automotive and construction. These regional patterns highlight how trade dynamics in steel and aluminum directly influence local economies, with varying vulnerability to global supply disruptions based on industrial concentration and import reliance.
Section 232 National Security Provisions in the US 2025
| Security Justification | Steel Sector | Aluminum Sector | Legal Authority | Coverage Scope |
|---|---|---|---|---|
| Domestic Capacity Protection | Critical | Strategic | Section 232 | Universal |
| Supply Chain Security | Enhanced | Improved | Trade Expansion Act | Comprehensive |
| Defense Industrial Base | Protected | Secured | National Security | Complete |
| Investment Incentives | $10+ billion | Major Mills | Private Sector | Committed |
| Tariff Mechanism | 50% ad valorem | 50% ad valorem | Presidential Authority | Broad |
Under Section 232 provisions, the US government frames steel and aluminum tariffs as vital to safeguarding national security. In the steel sector, domestic capacity protection is deemed critical, while for aluminum it is strategic, ensuring these industries remain robust against foreign competition. Supply chain security is described as enhanced for steel and improved for aluminum, with legal grounding in the Trade Expansion Act. Protection of the defense industrial base is emphasized for both sectors—protected in steel and secured in aluminum—under a broad national security mandate.
The framework also outlines major investment incentives, including over $10 billion committed in steel capacity and strategic investments in major aluminum mills, driven largely by private sector contributions. The tariff mechanism, set at 50% ad valorem for both materials, is implemented under presidential authority and applies with broad and universal coverage. Together, these measures are positioned as a comprehensive shield to maintain self-sufficiency, deter supply chain vulnerabilities, and ensure readiness for defense and industrial needs in 2025.
Manufacturing Sector Effects of Tariffs in the US 2025
| Industry Sector | Cost Impact | Price Pass-Through | Supply Chain Effect | Strategic Response |
|---|---|---|---|---|
| Automotive | High | 75-85% | Significant Disruption | Reshoring/Redesign |
| Construction | Moderate | 60-70% | Manageable Adjustment | Cost Passing |
| Aerospace | Critical | Limited | Complex Reconfiguration | Niche Focus |
| Packaging | Substantial | 50-60% | Material Substitution | Alternative Materials |
| Appliances | High | 80-90% | Supply Chain Revision | Efficiency Gains |
Tariffs in 2025 are reshaping US manufacturing dynamics, with cost burdens varying widely across sectors. The automotive industry faces high cost impacts, passing 75–85% of tariff-related increases directly to consumers while confronting significant supply chain disruptions that prompt reshoring and product redesign initiatives. Construction experiences a moderate cost increase, with 60–70% of expenses passed on, requiring a manageable adjustment through direct cost passing. In contrast, the aerospace sector is hit with a critical impact but demonstrates limited price pass-through ability, resulting in complex supply chain reconfigurations and a pivot toward niche specialization to maintain competitiveness.
The packaging sector faces substantial cost increases, offset by 50–60% price pass-through and strategic material substitution to maintain margins. For appliance manufacturers, costs remain high, with 80–90% of the added burden passed to consumers, while operations undergo supply chain revisions aimed at securing efficiency gains. Across all sectors, the combination of elevated costs, varying pass-through rates, and supply chain adjustments underscores the necessity of flexible, long-term strategies to adapt to the ongoing pressure from elevated steel and aluminum tariffs.
Global Trade Relations and Tariff Policy in the US 2025
| Trading Partner | Previous Status | Current Steel Rate | Current Aluminum Rate | Relationship Impact |
|---|---|---|---|---|
| Canada | Exempted (2018-2025) | 50% | 50% | Severely Strained |
| Mexico | Exempted (2018-2025) | 50% | 50% | Major Tensions |
| European Union | Variable Relief | 50% | 50% | Trade Disputes |
| United Kingdom | Negotiated Exception | 25% | 25% | Managed Relations |
| China | Full Tariffs | 50% | 50% | Continued Tensions |
| All Other Countries | Variable | 50% | 50% | Universal Coverage |
The US tariff policy for 2025 marks a decisive shift in global trade relations, as long-standing exemptions for key partners have been revoked. Canada and Mexico, previously exempted from 2018 to 2025, now face 50% tariffs on both steel and aluminum, resulting in severely strained and highly tense trade relations. The European Union, once enjoying variable relief measures, is now subject to the same 50% rate, intensifying trade disputes and prompting potential retaliatory measures. The United Kingdom maintains a more favorable position under a negotiated exception, with steel and aluminum tariffs set at 25%, allowing for managed relations despite some trade friction.
Other major trading partners, including China, continue to face 50% tariffs, perpetuating ongoing tensions and limiting progress on broader trade agreements. For all remaining countries, a universal coverage policy applies, ensuring no market is left untaxed under the revised structure. These measures, while reinforcing domestic industrial protection, have led to heightened diplomatic challenges and increased uncertainty in global supply chains. The alignment of steel and aluminum rates across most nations underscores a uniform, security-driven trade stance, but also risks long-term fragmentation of US trade partnerships.
Economic Consequences and Market Dynamics in the US 2025
| Economic Factor | Current Impact | Projected Effect | Time Horizon | Confidence Level |
|---|---|---|---|---|
| Consumer Price Inflation | +2.1% | +3.2% | 12 months | High |
| Manufacturing Input Costs | +15-25% | +20-30% | 6 months | Very High |
| Domestic Steel Production | +8% | +15-20% | 18 months | Moderate |
| Import Volume Reduction | -25% | -35-45% | 12 months | High |
| Employment (Metals Sector) | +3% | +8-12% | 24 months | Moderate |
| GDP Impact | -0.2% | -0.4% | Annualized | Moderate |
The 2025 US tariff landscape is reshaping the economy by driving both immediate and long-term market adjustments. Consumer price inflation has already risen by 2.1%, with projections indicating a 3.2% increase within twelve months, primarily due to higher import costs cascading into retail prices. Manufacturing input costs have surged 15–25%, with expectations of a 20–30% rise over the next six months, straining margins for industries heavily reliant on imported metals. Domestic steel production has grown by 8%, with forecasts pointing to a 15–20% increase in eighteen months as domestic suppliers fill the gap left by reduced imports.
Import volumes have dropped by 25% and are projected to fall further to 35–45% within a year, reflecting the strong deterrent effect of high tariffs. While the metals sector could see employment growth of 8–12% in the next two years, the broader economy faces headwinds, with GDP expected to decline by 0.4% annually. The confidence levels associated with these projections are generally high, especially for inflationary and cost impacts, suggesting that the market trajectory is becoming increasingly clear as industries adapt to a protectionist trade environment.
Investment and Capacity Response in the US 2025
| Investment Category | Announced Value | Timeline | Companies Involved | Expected Capacity |
|---|---|---|---|---|
| New Steel Plants | $8+ billion | 2025-2027 | Hyundai Steel, Posco | 3-5 million tons |
| Aluminum Facilities | $3+ billion | 2025-2026 | Emirates Global Aluminum | 1-2 million tons |
| Modernization Projects | $5+ billion | 2025-2026 | Multiple US Producers | Efficiency Gains |
| Downstream Expansion | $2+ billion | 2025-2026 | Fabrication Companies | Value-Added Products |
| Total Investment Commitment | $18+ billion | 2025-2027 | Domestic & Foreign | Major Capacity |
The 2025 tariff-driven market environment has triggered a wave of capital commitments aimed at expanding domestic production capacity in the steel and aluminum sectors. Over $8 billion has been earmarked for new steel plants between 2025 and 2027, with major players like Hyundai Steel and Posco targeting an additional 3–5 million tons of annual output. The aluminum sector is also scaling up, with $3+ billion allocated for new facilities led by Emirates Global Aluminum, expected to add 1–2 million tons in production capacity by 2026. In parallel, modernization efforts worth $5+ billion are underway across multiple US producers, aimed at achieving significant efficiency gains through upgraded technology, automation, and process optimization.
Beyond raw material production, the downstream manufacturing base is also set to benefit, with $2+ billion in investments targeting fabrication and value-added product lines. Combined, these commitments total $18+ billion over 2025–2027, with contributions from both domestic and foreign investors. The strategic intent is clear: reduce reliance on imports, capitalize on higher domestic prices, and ensure that the US industrial base remains resilient under prolonged tariff regimes. If fully realized, these expansions will not only bolster national supply security but also reshape global trade dynamics by positioning the US as a more self-sufficient metals producer.
Future Outlook and Policy Implications in the US 2025
The trajectory of steel and aluminum tariff policy suggests continued emphasis on domestic industrial capacity and national security considerations. The sudden change in tariffs on these two metals exemplifies that uncertainty continues even in sectors that appeared stable again, indicating potential for further policy adjustments.
The policy implications extend beyond the metals sector to encompass broader questions about America’s approach to international trade and economic relationships. The substantial increase in tariff rates and elimination of traditional trading arrangements represent a fundamental shift toward economic nationalism that influences other trade policy areas.
Disclaimer: The data research report we present here is based on information found from various sources. We are not liable for any financial loss, errors, or damages of any kind that may result from the use of the information herein. We acknowledge that though we try to report accurately, we cannot verify the absolute facts of everything that has been represented.