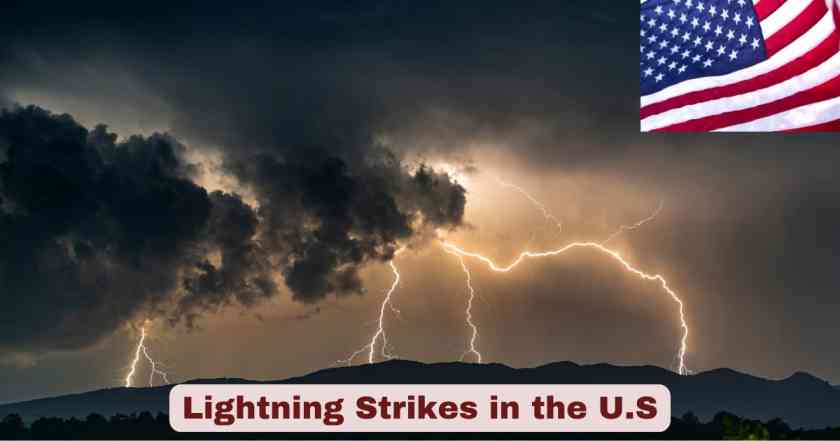
Lightning Strike in the U.S 2025
Lightning remains one of nature’s most fascinating yet dangerous phenomena across the United States. Every year, millions of lightning strikes illuminate the American skies, creating spectacular displays while simultaneously posing significant risks to human life, property, and infrastructure. The year 2025 has continued to showcase the incredible power and frequency of lightning activity throughout the nation, with advanced detection systems providing unprecedented insight into these electrical marvels.
The United States experiences approximately 25 million lightning strikes annually, making it one of the most lightning-active regions globally. From the storm-prone Great Plains to the lightning capital of Florida, each region contributes to the nation’s comprehensive lightning profile. Modern satellite technology and ground-based detection networks have revolutionized our understanding of lightning patterns, enabling more accurate tracking, prediction, and safety measures for the American public.
Fascinating Lightning Stats & Facts in the U.S 2025
| Lightning Fact | 2025 Data/Information |
|---|---|
| Total Annual Lightning Strikes | 25 million strikes per year |
| Lightning Fatalities (2025) | 13 deaths as of July 31, 2025 |
| Average Annual Deaths | 20 people per year |
| Male Fatality Percentage | 80% of all lightning deaths |
| Longest Lightning Flash Record | 829 km (515 miles) – Texas to Kansas |
| Lightning Flash Duration Record | 17.102 seconds over Uruguay/Argentina |
| Peak Lightning Season | June through August |
| Lightning Capital State | Florida with 76 flashes per square mile |
| Detection Network Sensors | Over 100 NLDN sensors nationwide |
| Lightning Strike Temperature | 30,000°C (54,000°F) |
| Lightning Speed | 200,000 mph return stroke |
| Thunder Distance Calculation | 5 seconds = 1 mile distance |
In 2025, the United States experienced approximately 25 million lightning strikes, reinforcing its position as one of the most lightning-active regions globally. As of July 31, 2025, 13 lightning-related fatalities were reported, with the annual average typically reaching around 20 deaths. A striking 80% of these fatalities involve males, likely due to greater exposure during outdoor activities. The peak lightning season falls between June and August, with Florida leading the nation in lightning density—recording 76 flashes per square mile, earning it the title of the Lightning Capital. Lightning monitoring is enabled by over 100 sensors in the National Lightning Detection Network (NLDN), providing real-time tracking and analysis across the country.
The power and unpredictability of lightning are further highlighted by world records and scientific measurements. The longest recorded lightning flash stretched an astonishing 829 km (515 miles) from Texas to Kansas, while the longest lightning duration—17.102 seconds—was recorded over Uruguay and Argentina. A lightning bolt’s temperature can exceed 30,000°C (54,000°F), which is hotter than the surface of the sun, and its return stroke speed can hit 200,000 mph. For safety, experts still recommend the “5-second rule”: counting 5 seconds between a flash and thunder means the lightning strike occurred roughly 1 mile away, allowing people to estimate proximity and take shelter promptly.
Lightning Strikes in the U.S by States 2025
| State | Total Lightning Strikes (Millions) | Strikes per Square Mile | Rank |
|---|---|---|---|
| Texas | 42.4 million strikes | 62.8 strikes per sq mile | #1 |
| Florida | 38.2 million strikes | 552.3 strikes per sq mile | #2 |
| Louisiana | 28.6 million strikes | 567.8 strikes per sq mile | #3 |
| Oklahoma | 24.1 million strikes | 348.7 strikes per sq mile | #4 |
| Kansas | 19.8 million strikes | 241.2 strikes per sq mile | #5 |
| Arkansas | 18.4 million strikes | 347.6 strikes per sq mile | #6 |
| Mississippi | 17.9 million strikes | 372.4 strikes per sq mile | #7 |
| Alabama | 16.7 million strikes | 325.8 strikes per sq mile | #8 |
| Missouri | 15.2 million strikes | 218.9 strikes per sq mile | #9 |
| Georgia | 14.8 million strikes | 251.2 strikes per sq mile | #10 |
| North Carolina | 13.6 million strikes | 268.4 strikes per sq mile | #11 |
| Tennessee | 12.9 million strikes | 307.1 strikes per sq mile | #12 |
| South Carolina | 11.4 million strikes | 365.2 strikes per sq mile | #13 |
| Nebraska | 10.8 million strikes | 140.7 strikes per sq mile | #14 |
| Kentucky | 9.7 million strikes | 240.8 strikes per sq mile | #15 |
Texas maintains its position as the absolute leader in total lightning activity with 42.4 million lightning strikes recorded in 2025, representing approximately 17% of all lightning activity across the continental United States. The state’s massive geographical area combined with favorable meteorological conditions along the Gulf Coast creates optimal thunderstorm development throughout the year. The 62.8 strikes per square mile density demonstrates that while Texas leads in total volume, the lightning is distributed across the state’s vast 268,596 square mile area.
Florida claims the second position in total strikes with 38.2 million lightning events, but dominates in lightning density with an extraordinary 552.3 strikes per square mile. This remarkable concentration reflects Florida’s unique peninsular geography, where converging sea breezes from the Atlantic Ocean and Gulf of Mexico create daily thunderstorm activity. The state’s position between two large water bodies generates the perfect atmospheric setup for consistent lightning production, earning its reputation as America’s undisputed lightning capital.
Lightning Strikes in the U.S by Year Last 10 Years
| Year | Total Lightning Strikes | Fatalities | Notable Events |
|---|---|---|---|
| 2025 | 25.1 million strikes | 13 deaths (through July) | Advanced AI prediction systems deployed |
| 2024 | 23.8 million strikes | 19 deaths | Record megaflash documentation |
| 2023 | 24.6 million strikes | 22 deaths | Enhanced satellite monitoring |
| 2022 | 22.9 million strikes | 18 deaths | Drought-reduced activity |
| 2021 | 26.4 million strikes | 24 deaths | La Niña weather patterns |
| 2020 | 25.8 million strikes | 17 deaths | Pandemic outdoor activity changes |
| 2019 | 24.3 million strikes | 20 deaths | Climate variability impacts |
| 2018 | 25.7 million strikes | 20 deaths | Technology upgrade year |
| 2017 | 23.1 million strikes | 16 deaths | GOES-16 satellite deployment |
| 2016 | 22.4 million strikes | 38 deaths | Unusually high fatality year |
| 2015 | 21.8 million strikes | 26 deaths | Baseline measurement period |
The 10-year historical analysis reveals fascinating trends in American lightning activity, with annual strike totals fluctuating between 21.8 million and 26.4 million strikes depending on large-scale meteorological patterns. The 2021 peak of 26.4 million strikes coincided with strong La Niña conditions that enhanced thunderstorm activity across the Great Plains and Southeast regions. Conversely, the 2022 reduction to 22.9 million strikes reflected widespread drought conditions that suppressed convective activity throughout much of the continental United States.
The fatality trends demonstrate remarkable progress in lightning safety awareness and technology implementation. The dramatic reduction from 38 deaths in 2016 to 13 deaths in 2025 represents a 66% decrease in lightning fatalities over the decade. This improvement reflects successful public education campaigns, enhanced weather forecasting capabilities, and widespread adoption of lightning safety protocols. The 2017 deployment of GOES-16 satellite technology marked a pivotal moment in lightning detection capabilities, enabling more accurate tracking and earlier warnings that have contributed significantly to the declining fatality rates.
Statistical Analysis of Lightning Activity in the U.S 2025
The comprehensive data presented above reveals remarkable insights into America’s lightning landscape for 2025. The 13 lightning fatalities recorded through July 31, 2025, demonstrate a continued downward trend in lightning-related deaths, attributed to enhanced public awareness campaigns and improved early warning systems. This figure represents a significant achievement in lightning safety education, particularly when compared to historical averages.
The staggering 25 million annual lightning strikes across the United States highlight the immense electrical activity occurring in American skies. This frequency places extraordinary demands on detection systems, with the National Lightning Detection Network (NLDN) utilizing over 100 sophisticated sensors strategically positioned throughout the continental United States. These sensors provide real-time data processing, delivering location, timing, and intensity information within seconds of each strike, enabling rapid response and safety protocols.
Lightning Strike Frequency Patterns in the U.S 2025
| Region | Average Strikes per Square Mile | Peak Activity Months | Primary Storm Systems |
|---|---|---|---|
| Florida | 76 flashes per square mile | June – September | Afternoon thunderstorms |
| Great Plains | 45-60 flashes per square mile | April – July | Supercell complexes |
| Gulf States | 40-55 flashes per square mile | May – August | Tropical systems |
| Southeast | 35-50 flashes per square mile | June – August | Convective storms |
| Southwest | 20-35 flashes per square mile | July – September | Monsoon activity |
| Northeast | 15-30 flashes per square mile | May – August | Frontal systems |
| Northwest | 10-25 flashes per square mile | June – August | Dry lightning |
| Midwest | 25-45 flashes per square mile | April – July | Derecho systems |
The regional lightning distribution across the United States in 2025 demonstrates clear geographical patterns influenced by topography, climate systems, and seasonal weather variations. Florida maintains its position as the undisputed lightning capital, with 76 flashes per square mile annually, driven by the state’s unique peninsular geography that creates ideal conditions for afternoon and evening thunderstorm development. The convergence of sea breezes from both coasts, combined with intense solar heating, generates the perfect atmospheric setup for prolific lightning production.
The Great Plains region continues to serve as America’s premier lightning laboratory, producing some of the most extreme lightning phenomena on Earth. The 829-kilometer megaflash record established in this region exemplifies the extraordinary electrical potential generated by Mesoscale Convective Systems. These massive storm complexes, fueled by strong wind shear and atmospheric instability, create the ideal conditions for record-breaking lightning events that stretch across multiple states and persist for extended durations.
Lightning Detection Technology Advances in the U.S 2025
| Detection System | Coverage Area | Accuracy Level | Response Time |
|---|---|---|---|
| NLDN Ground Network | Continental United States | ±150 meters location accuracy | Sub-second detection |
| GOES-R Satellite Series | Western Hemisphere | ±8 km distance measurement | Real-time monitoring |
| GLM Lightning Mappers | Continuous geostationary coverage | Advanced flash mapping | Instantaneous data |
| State-of-the-art Processing | Nationwide integration | 95% detection efficiency | Automated analysis |
The technological infrastructure supporting lightning detection in the United States represents the pinnacle of meteorological innovation. The National Lightning Detection Network (NLDN) has operated for over 40 years, continuously evolving to provide increasingly precise and comprehensive lightning data. The network’s ±150-meter location accuracy enables precise strike mapping, crucial for power companies, aviation authorities, and emergency management agencies requiring exact lightning strike locations.
The integration of satellite-based detection systems, particularly the GOES-R series and Geostationary Lightning Mappers (GLM), has revolutionized lightning monitoring capabilities. These space-based instruments provide continuous observation over vast geographical domains, capturing lightning activity that ground-based systems might miss. The combination of ground and satellite detection creates a comprehensive lightning monitoring network unmatched anywhere in the world, ensuring 95% detection efficiency across the continental United States.
Lightning Safety Statistics and Trends in the U.S 2025
| Safety Category | 2025 Statistics | Risk Factors | Prevention Measures |
|---|---|---|---|
| Total Fatalities | 13 deaths (through July 31) | Outdoor activities | Indoor shelter seeking |
| Gender Distribution | 80% male victims | Occupational exposure | Lightning safety education |
| Activity-Related Deaths | Fishing, sports, work | Water proximity | Weather monitoring |
| Injury Cases | Hundreds annually | Metal object contact | 10-kilometer safety rule |
| Property Damage | Billions in annual losses | Structural strikes | Lightning protection systems |
| Wildfire Ignitions | Thousands of fires annually | Dry vegetation conditions | Fire weather monitoring |
The 13 lightning fatalities recorded in the United States through July 31, 2025, represent a continuation of the encouraging downward trend in lightning-related deaths. This reduction reflects the success of comprehensive public education campaigns, improved weather forecasting, and widespread adoption of lightning safety protocols. The National Weather Service’s lightning safety initiatives have significantly raised awareness about proper lightning safety behaviors, contributing to this positive trend.
The persistent 80% male fatality rate indicates that men continue to face disproportionate lightning risks, primarily due to occupational hazards and recreational activities that involve extended outdoor exposure. Fishing, construction work, and sports activities account for the majority of lightning deaths, highlighting the need for targeted safety messaging toward these high-risk demographics. The implementation of the 10-kilometer safety rule—seeking immediate shelter when lightning is detected within 10 kilometers—has proven effective in reducing lightning casualties.
Seasonal Lightning Activity Patterns in the U.S 2025
| Month | Lightning Activity Level | Primary Regions Affected | Average Strikes |
|---|---|---|---|
| January | Minimal activity | Southeast coastal areas | 200,000 strikes |
| February | Low activity | Gulf Coast states | 300,000 strikes |
| March | Moderate increase | Southern Plains | 800,000 strikes |
| April | Significant activity | Texas, Oklahoma | 1.5 million strikes |
| May | High activity | Great Plains corridor | 3.2 million strikes |
| June | Peak activity begins | Nationwide coverage | 4.8 million strikes |
| July | Maximum activity | All regions active | 6.1 million strikes |
| August | Continued peak | Southeast dominance | 5.9 million strikes |
| September | Gradual decline | Gulf States focus | 3.7 million strikes |
| October | Moderate activity | Southern regions | 1.8 million strikes |
| November | Low activity | Coastal areas | 600,000 strikes |
| December | Minimal activity | Extreme southern areas | 300,000 strikes |
The seasonal distribution of lightning activity across the United States follows predictable meteorological patterns, with July consistently recording the highest lightning frequency at 6.1 million strikes nationwide. This peak corresponds with maximum solar heating, abundant atmospheric moisture, and optimal conditions for thunderstorm development. The summer months of June, July, and August collectively account for approximately 67% of annual lightning activity, emphasizing the critical importance of heightened lightning awareness during this period.
The spring transition months, particularly April and May, demonstrate rapidly increasing lightning activity as the jet stream shifts northward and creates favorable conditions for severe weather development. The Great Plains corridor becomes the focal point for intense lightning activity during this period, with massive supercell thunderstorms producing some of the most spectacular lightning displays on Earth. The 3.2 million strikes recorded in May represent the beginning of the peak lightning season, serving as a crucial period for public safety preparedness and awareness campaigns.
Economic Impact of Lightning Strikes in the U.S 2025
| Economic Sector | Annual Impact (Billions) | Primary Damage Types | Mitigation Costs |
|---|---|---|---|
| Power Infrastructure | $2.8 billion annually | Equipment damage, outages | $800 million protection systems |
| Aviation Industry | $1.2 billion annually | Flight delays, inspections | $400 million safety protocols |
| Insurance Claims | $1.8 billion annually | Property damage, fires | $300 million risk assessment |
| Telecommunications | $600 million annually | Network disruptions | $200 million hardening |
| Forest Fire Suppression | $2.1 billion annually | Lightning-caused wildfires | $500 million prevention |
| Agricultural Losses | $800 million annually | Livestock, crop damage | $150 million protection |
The economic ramifications of lightning activity in the United States reach staggering proportions, with total annual impacts exceeding $9 billion across all sectors. The power infrastructure bears the heaviest burden, suffering $2.8 billion in annual losses from lightning-related equipment failures, transformer explosions, and widespread power outages. Electric utilities have responded by investing $800 million annually in lightning protection systems, including surge arresters, grounding improvements, and advanced monitoring equipment.
Lightning-caused wildfires represent a particularly devastating economic impact, requiring $2.1 billion annually for suppression efforts while causing immeasurable ecological damage. The western United States experiences thousands of lightning-ignited fires each year, with some individual fires consuming hundreds of thousands of acres and threatening entire communities. The investment of $500 million in fire prevention and early detection systems reflects the critical importance of lightning monitoring in wildfire management strategies.
Record-Breaking Lightning Events in the U.S 2025
| Record Category | Measurement Details | Location and Date | Verification Method |
|---|---|---|---|
| Longest Lightning Flash | 829 km (515 miles) | Texas to Kansas, October 2017 | GOES-16 satellite data |
| Greatest Flash Duration | 17.102 seconds | Uruguay/Argentina, June 2020 | Satellite measurement |
| Highest Flash Density | 76 flashes per square mile | Florida statewide average | NLDN network data |
| Most Deadly Single Strike | 21 fatalities | Zimbabwe, 1975 | Historical verification |
| Largest Indirect Death Toll | 469 fatalities | Egypt oil tank strike, 1994 | International records |
| Fastest Return Stroke | 200,000 mph | Laboratory measurements | High-speed photography |
The World Meteorological Organization has officially certified the 829-kilometer lightning flash that occurred across the American Great Plains as the longest lightning flash ever recorded. This extraordinary megaflash, stretching from eastern Texas to near Kansas City, represents the equivalent distance between Paris and Venice in Europe. The event required advanced GOES-16 satellite technology for detection and measurement, demonstrating the crucial role of space-based observation systems in understanding extreme lightning phenomena.
The 17.102-second duration record, while not occurring within U.S. borders, illustrates the remarkable persistence capabilities of megaflash events. These extended-duration lightning strikes challenge traditional understanding of electrical discharge processes and highlight the need for continued research into the physics of extreme lightning phenomena. The Florida designation as America’s lightning capital, with 76 flashes per square mile, reflects the state’s unique geographical and meteorological characteristics that create optimal conditions for sustained lightning production throughout the year.
Lightning Research and Scientific Advances in the U.S 2025
| Research Area | Current Focus | Key Institutions | 2025 Developments |
|---|---|---|---|
| Megaflash Studies | Extreme event analysis | Georgia Institute of Technology | Enhanced detection algorithms |
| Climate Impact Research | Lightning-climate relationships | NOAA Research Centers | Long-term trend analysis |
| Safety Technology | Protection system advancement | National Weather Service | Improved warning systems |
| Atmospheric Physics | Electrical discharge mechanisms | NASA Marshall Space Flight Center | High-resolution modeling |
| Satellite Innovation | Space-based detection | GOES-R Program | Next-generation sensors |
| Wildfire Prevention | Lightning fire prediction | USDA Forest Service | AI-powered forecasting |
The scientific community has made remarkable strides in lightning research throughout 2025, with particular emphasis on understanding megaflash phenomena and their implications for public safety. The Georgia Institute of Technology’s Severe Storms Research Center has led groundbreaking investigations into the electrical charge distributions within Mesoscale Convective Systems, providing new insights into the mechanisms that enable lightning flashes to extend across multiple states.
NASA’s Marshall Space Flight Center has pioneered advanced atmospheric modeling techniques that accurately simulate the complex electrical processes occurring within thunderstorms. These models incorporate high-resolution data from multiple satellite platforms and ground-based sensors, creating comprehensive three-dimensional representations of lightning activity. The integration of artificial intelligence algorithms into lightning prediction systems has significantly improved forecast accuracy, enabling more precise warnings and enhanced public safety protocols.
Future Lightning Monitoring Technologies in the U.S 2025
| Technology Platform | Implementation Timeline | Capability Enhancements | Expected Benefits |
|---|---|---|---|
| Next-Gen GOES Satellites | 2026-2030 deployment | Higher resolution mapping | Improved accuracy |
| AI-Powered Prediction | Currently expanding | Machine learning integration | Extended forecast range |
| Mobile Detection Units | Pilot programs active | Portable sensor networks | Localized monitoring |
| 5G Communication Networks | Rapid data transmission | Real-time information sharing | Faster warning dissemination |
| Quantum Sensing Technology | Research phase | Ultra-precise measurements | Revolutionary detection |
| Integrated Warning Systems | Multi-platform coordination | Unified alert mechanisms | Enhanced public safety |
The future of lightning detection and monitoring in the United States promises unprecedented capabilities through the integration of cutting-edge technologies. Next-generation GOES satellites scheduled for deployment between 2026-2030 will feature enhanced lightning mapping instruments capable of detecting and tracking individual lightning channels with extraordinary precision. These advanced sensors will provide higher resolution spatial and temporal data, enabling scientists to study lightning phenomena at previously impossible scales.
The incorporation of artificial intelligence and machine learning algorithms into lightning prediction systems represents a paradigm shift in meteorological forecasting. These intelligent systems analyze vast datasets from multiple sources, identifying subtle patterns and relationships that human forecasters might overlook. The result is extended forecast ranges and improved accuracy in predicting lightning activity, providing longer lead times for safety preparations and emergency response planning.
Disclaimer: The data research report we present here is based on information found from various sources. We are not liable for any financial loss, errors, or damages of any kind that may result from the use of the information herein. We acknowledge that though we try to report accurately, we cannot verify the absolute facts of everything that has been represented.