Population by Race in Scotland 2026
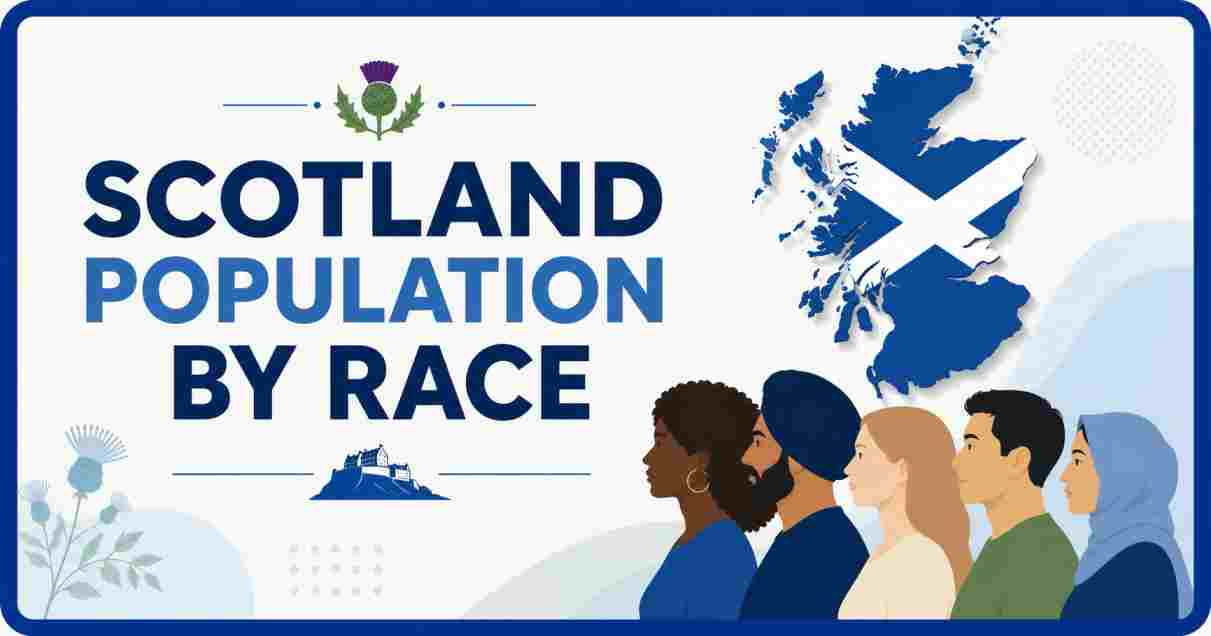
Scotland’s population has grown more ethnically diverse over the past decade than at almost any point in its recorded history, even as the overwhelming majority of residents continue to identify as White Scottish or White Other British. Unlike some other nations that avoid direct race or ethnicity questions, Scotland’s national census asks residents to identify their ethnic group directly, producing detailed, government-verified data that tracks exactly how the country’s population makeup has shifted between the 2011 and 2022 censuses.
This report breaks down the latest Scotland population by ethnic group statistics, covering the White Scottish and White British majority, the country’s growing Asian, African, Caribbean/Black, and Mixed ethnicity communities, generational and geographic patterns in diversity, and how these figures compare to the rest of the United Kingdom. Whether you’re researching Scotland’s changing demographics, immigration trends, or ethnic diversity by city and region, this report lays out the full, current picture using the most detailed and authoritative data available.
Interesting Facts About Population by Race in Scotland 2026
| Interesting Fact | Data (2022 Census, Latest Available) |
|---|---|
| Scotland’s Total Population (Census Day, 20 March 2022) | 5,436,600 — the largest ever recorded |
| Scotland’s Total Population (Mid-2024 Estimate) | Over 5.5 million |
| Identify as White Scottish | 77.7% |
| Identify as White Other British | 9.4% |
| Combined White Scottish + White Other British | 87.1%, down from 91.8% in 2011 |
| Identify as a White Minority Ethnic Group (Polish, Irish, Gypsy/Traveller, Roma, etc.) | 5.8%, up from 4.2% in 2011 |
| Identify as Asian, African, Caribbean/Black, Mixed, or Other Ethnic Group | 7.1%, up from 4.0% in 2011 |
| Total “Minority Ethnic” Population (All Non-White-Scottish/British Groups) | 12.9%, up from 8.2% in 2011 |
| Population Born Outside the UK | 10.2%, up from 7.0% in 2011 |
| Most Ethnically Diverse City | Edinburgh, at 17.9% minority ethnic |
| Under-18s From a Black/Minority Ethnic Background | 11.6%, compared to just 1.5% of over-65s |
| People Reporting “No Religion” | 51.1% — a majority, for the first time in Scotland’s census history |
Source: National Records of Scotland (NRS), Scotland’s Census 2022, Ethnic Group, National Identity, Language and Religion release.
As a content writer analyzing this data, the clearest theme in Scotland’s 2022 census results is the genuine acceleration of ethnic diversification between 2011 and 2022, following a much slower pace of change in the decade before that. The minority ethnic population — defined as everyone outside the White Scottish/White Other British categories — grew from 8.2% to 12.9% of the total population in just eleven years, a larger jump than the 4.5% to 8.2% increase recorded between 2001 and 2011. This acceleration was driven by growth across nearly every ethnic group tracked, alongside a rise in the overseas-born population from 7.0% to 10.2%.
The second major theme is the sharp generational divide running through this data. While just 1.5% of Scots aged 65 and over come from a Black or minority ethnic background, that figure jumps to 11.6% among those under 18 — meaning Scotland’s ethnic diversity is heavily concentrated among children and young people rather than being evenly spread across all age groups. Combined with the finding that 17.8% of Scots aged 20-39 were born outside the UK, this data makes clear that Scotland’s demographic future looks considerably more diverse than its past, even though the national headline “White Scottish/British” figure of 87.1% still describes the large majority of the population today.
Why Scotland’s Census Data Is Different: Ethnic Group, Not Ancestry
| Detail | Explanation |
|---|---|
| Question Type | Direct, self-identified ethnic group question |
| Responsible Agency | National Records of Scotland (NRS), a non-ministerial department of the Scottish Government |
| Broad Category Headings on the 2022 Form | White; Mixed or Multiple; Asian, Asian Scottish or Asian British; African, African Scottish or African British; Caribbean or Black; Other |
| Census Frequency | Every 10 years, with the most recent taken in March 2022 (delayed one year due to COVID-19) |
| Comparable UK Nations | England, Wales, and Northern Ireland also ask direct ethnicity questions |
| Next Scheduled Census | 2032 |
Source: National Records of Scotland (NRS), Scotland’s Census 2022 metadata and question design documentation.
Unlike some other English-speaking nations that rely on indirect measures such as ancestry or country of birth, Scotland’s Census asks residents to self-identify their ethnic group directly, using a structured set of tick-box categories grouped under six broad headings: White; Mixed or Multiple; Asian, Asian Scottish or Asian British; African, African Scottish or African British; Caribbean or Black; and Other. This approach, shared across England, Wales, and Northern Ireland, produces data that can be compared relatively consistently across the UK, unlike countries such as Australia that rely on ancestry-based proxies instead.
The 2022 Census questionnaire introduced several refinements compared to 2011, including new Roma and Showman/Showwoman tick-boxes within the White category, and a restructured African and Caribbean/Black question that moved from multiple separate tick-boxes to a single combined option per group, with a further breakout allowing people to specifically identify as “Black, Black Scottish or Black British” if they preferred that terminology. Because of these structural changes, National Records of Scotland advises researchers to sum related categories when comparing 2011 and 2022 figures directly, rather than comparing individual sub-categories in isolation.
Ethnic Group Breakdown Statistics Scotland 2026
| Ethnic Group | Share of Population (2022 Census) |
|---|---|
| White: Scottish | 77.7% |
| White: Other British | 9.4% |
| White: Polish | 1.7% |
| White: Other (Irish, Gypsy/Traveller, Roma, Showman/Showwoman, Other White) | ~4.1% |
| Asian, Asian Scottish or Asian British | ~4% |
| — Including Pakistani | 1.3% |
| — Including Indian | 1.0% |
| — Including Chinese | 0.9% |
| African, African Scottish or African British | ~1.0-1.2% |
| Caribbean or Black | ~1.2% (African and Black groups combined) |
| Mixed or Multiple Ethnic Groups | 1.1% |
| Other Ethnic Group (Including Arab) | ~1% |
Source: National Records of Scotland (NRS), Scotland’s Census 2022, Ethnic Group detailed dataset (UV201).
Breaking the data down to individual ethnic groups reveals a population still overwhelmingly composed of White Scottish and White Other British residents (87.1% combined), though the detailed breakdown shows meaningful diversity within even the broader “White” category itself. White Polish residents alone account for 1.7% of Scotland’s total population, reflecting sustained EU migration patterns particularly following EU enlargement in the 2000s, while smaller but still significant populations identify as White Irish, Gypsy/Traveller, Roma, or Showman/Showwoman.
Among minority ethnic groups specifically, Pakistani heritage residents form the largest single identifiable non-White group at 1.3% of the population, followed closely by Indian (1.0%) and Chinese (0.9%) communities — reflecting Scotland’s long-established South and East Asian communities, many concentrated in Glasgow and Edinburgh for multiple generations. Asian ethnic groups collectively make up close to 4% of Scotland’s population, making this the largest minority ethnic category overall, ahead of African and Caribbean/Black groups (roughly 1.2% each) and those identifying with Mixed or Multiple ethnic backgrounds (1.1%).
Growth in Minority Ethnic Population Scotland 2026
| Census Year | White Scottish/Other British | White Minority Ethnic | Non-White Minority Ethnic | Total Minority Ethnic |
|---|---|---|---|---|
| 2011 | 91.8% | 4.2% | 4.0% | 8.2% |
| 2022 | 87.1% | 5.8% | 7.1% | 12.9% |
| Percentage Point Change | -4.7 | +1.6 | +3.1 | +4.7 |
| Relative Growth Rate, Total Minority Ethnic Population | — | — | — | +57% since 2011 |
Source: National Records of Scotland (NRS), Scotland’s Census 2022, comparison with Census 2011 results.
The pace of change in Scotland’s ethnic composition between 2011 and 2022 was substantial by historical standards, with the total minority ethnic population growing by 4.7 percentage points — from 8.2% to 12.9% of the national population, representing roughly a 57% relative increase in little more than a decade. This growth was not confined to a single group: both White minority ethnic populations (such as Polish and Irish communities) and non-White minority ethnic populations (such as Asian, African, and Caribbean/Black communities) grew simultaneously, with the non-White minority ethnic share nearly doubling from 4.0% to 7.1%.
For context, this 2011-2022 increase considerably outpaced the equivalent growth recorded in the previous decade, when the minority ethnic population grew more modestly from 4.5% in 2001 to 8.2% in 2011. Analysts attribute this acceleration primarily to sustained international migration into Scotland, reflected in the parallel rise in the overseas-born population from 7.0% to 10.2% over the same period, alongside a growing share of births in Scotland occurring to mothers who were themselves born outside the UK.
Geographic Distribution of Ethnic Diversity Scotland 2026
| City/Area | Minority Ethnic Share of Population |
|---|---|
| Edinburgh | 17.9% |
| Glasgow | 17.3% |
| Aberdeen | 17.1% |
| Dundee | 10.6% |
| Urban Scotland (Overall) | 9% of urban population is Black/minority ethnic |
| Rural Scotland (Overall) | 2.1% Black/minority ethnic, 3.6% White minority |
| Share of All BME Residents Living in Urban Areas | 91% |
Source: National Records of Scotland (NRS), Scotland’s Census 2022, at a glance ethnicity summary; Coalition for Racial Equality and Rights (CRER) analysis.
Scotland’s ethnic diversity remains heavily concentrated in its four largest cities, with Edinburgh recording the highest minority ethnic share at 17.9%, narrowly ahead of Glasgow (17.3%) and Aberdeen (17.1%), while Dundee trails at 10.6%. Outside these major urban centers, ethnic diversity drops off sharply: rural Scotland is home to just 2.1% Black/minority ethnic residents and 3.6% White minority ethnic residents, figures that stand in stark contrast to the cities.
This concentration means that 91% of all Black and minority ethnic residents in Scotland live in urban areas, even though urban areas themselves contain a smaller share of the country’s total population. Glasgow’s growth has been especially rapid, with its minority ethnic population rising 75% since 2011, driven substantially by the city’s expanding young population — roughly 32.6% of Glasgow’s under-18 residents now come from a Black or minority ethnic background, illustrating just how much more pronounced the city’s diversity is among children compared to the population as a whole.
Country of Birth and Migration Statistics Scotland 2026
| Metric | 2011 Figure | 2022 Figure |
|---|---|---|
| Population Born Outside the UK | 7.0% | 10.2% |
| Population Aged 20-39 Born Outside the UK | — | 17.8% |
| English-Born Residents in Scotland | — | 506,207 (9.6% combined with Wales-born) |
| English Language Proficiency (“Well” or “Very Well”) | 93.8% | 94.2% |
Source: National Records of Scotland (NRS), Scotland’s Census 2022, Country of Birth dataset (UV204).
Migration remains the primary driver behind Scotland’s growing ethnic diversity, with the share of residents born outside the UK rising from 7.0% in 2011 to 10.2% in 2022 — a proportion that climbs considerably higher among younger working-age adults, reaching 17.8% among those aged 20 to 39. This age concentration reflects the reality that migration to Scotland, as in most developed nations, skews heavily toward people of working and childbearing age rather than being evenly distributed across the population.
Despite this growing international migration, Scotland’s English language proficiency has remained remarkably stable, with 94.2% of residents reporting they speak, read, and write English “well” or “very well” in 2022, only a marginal increase from 93.8% in 2011 — evidence that rising diversity in country of birth has not translated into any meaningful decline in overall English proficiency nationally. As Jon Wroth-Smith, Director of Census Statistics at NRS, noted, migration has become essential to Scotland’s demographic trajectory: without it, the country’s population would have declined overall and would contain considerably fewer people in younger age groups.
Age Structure and the Generational Diversity Gap Scotland 2026
| Age Group | Share From a Black/Minority Ethnic Background |
|---|---|
| Under 18 | 11.6% |
| 65 and Over | 1.5% |
| Glasgow’s Under-18 Population Specifically | 32.6% |
| Scotland’s Over-65 Population (Total, All Ethnicities) | 1,091,000 — now exceeds the under-15 population |
| Scotland’s Under-15 Population (Total, All Ethnicities) | 832,300 |
Source: National Records of Scotland (NRS), Scotland’s Census 2022; Coalition for Racial Equality and Rights (CRER) analysis.
Perhaps the single most striking pattern in Scotland’s ethnicity data is the generational gap in diversity: children and young people are far more likely to come from a Black or minority ethnic background than older Scots, with 11.6% of under-18s falling into this category compared to just 1.5% of those aged 65 and over — nearly an eightfold difference. This gap is even more pronounced in Scotland’s most diverse city, where 32.6% of Glasgow’s under-18 population comes from a Black or minority ethnic background.
This generational pattern sits alongside a broader demographic shift affecting all of Scotland regardless of ethnicity: for the first time, Scots aged 65 and over (1,091,000 people) now outnumber those under 15 (832,300), continuing a trend seen across most G7 nations. Taken together, these two patterns suggest that Scotland’s population is simultaneously aging overall while becoming considerably more ethnically diverse among its youngest members, a combination that carries significant implications for how the country plans education, healthcare, and workforce policy over the coming decades.
How Scotland Compares to the Rest of the UK 2026
| Nation | White British/Scottish/Irish/Welsh (Combined) | Minority Ethnic Population |
|---|---|---|
| Scotland (2022) | 87.1% (White Scottish + Other British) | 12.9% |
| England and Wales (2021) | ~81.7% | ~18.3% |
| Northern Ireland (2021) | ~96.6% | ~3.4% |
| Population Growth Rate, 2011-2021/2022 | Scotland: +2.7% | England & Wales: +6.3%; Northern Ireland: +5.1% |
Source: National Records of Scotland (NRS); Office for National Statistics (ONS), Census 2021 for England and Wales; Northern Ireland Statistics and Research Agency (NISRA), Census 2021.
Placed alongside the rest of the United Kingdom, Scotland’s minority ethnic population share of 12.9% sits well below England and Wales’ combined figure of roughly 18.3%, but considerably above Northern Ireland, which remains the least ethnically diverse of the UK’s four nations at approximately 3.4%. This positioning is consistent with Scotland’s overall migration and population growth patterns, which have historically lagged behind England in particular — Scotland’s population grew just 2.7% between the 2011 and 2022 censuses, compared to 6.3% in England and Wales over a similar period.
These comparative figures matter for understanding Scotland’s trajectory: with minority ethnic growth accelerating faster than overall population growth in the most recent census cycle, and with England and Wales still recording a meaningfully higher baseline diversity level, demographers generally expect Scotland’s minority ethnic share to continue narrowing the gap with the rest of the UK over the coming decades, particularly as continued migration and the country’s already more diverse younger population age into adulthood. For businesses, policymakers, and researchers examining UK-wide diversity trends in 2026, this cross-national comparison provides essential context that Scotland’s ethnicity statistics, taken in isolation, cannot fully convey.
Historical Trend: Scotland’s Ethnic Diversity Since 1991
| Census Year | Minority Ethnic Population (Non-White-Scottish/British) |
|---|---|
| 1991 | Well under 2% (limited comparable data) |
| 2001 | 4.5% |
| 2011 | 8.2% |
| 2022 | 12.9% |
| Population Born Outside UK, 1991 | 3.0% |
| Population Born Outside UK, 2001 | 3.8% |
Source: National Records of Scotland (NRS), historical census comparisons, 1991-2022.
Viewed across a longer historical arc, Scotland’s minority ethnic population has grown roughly sixfold since the early 1990s, climbing from a figure well under 2% in 1991 to 12.9% by 2022. The pace of this growth has itself accelerated with each successive census: the increase from 2001 to 2011 (4.5% to 8.2%) was larger than the increase from 1991 to 2001, and the 2011 to 2022 increase was larger still, suggesting Scotland’s diversification has been speeding up rather than leveling off with each passing decade.
This accelerating trend closely tracks the parallel rise in Scotland’s overseas-born population, which climbed steadily from 3.0% in 1991 to 3.8% in 2001, then to 7.0% in 2011, and 10.2% by 2022 — each decade roughly doubling the pace of increase recorded in the one before it. For anyone tracking Scotland’s demographic future heading toward the next census in 2032, this consistent, compounding historical pattern suggests the minority ethnic share of Scotland’s population is likely to continue climbing at a similar or faster rate, particularly given how much more diverse the country’s youngest residents already are compared to previous generations.
| Metric | 2011 Figure | 2022 Figure |
|---|---|---|
| Population With “No Religion” | 36.7% | 51.1% — first-ever majority |
| Scottish National Identity Only | 62.4% | 65.5% |
| British National Identity Only | 8.4% | 13.9% |
| Both Scottish and British Identity | 18.3% | 8.2% |
| Population With Some Gaelic Skills (Age 3+) | 1.7% | 2.5% |
Source: National Records of Scotland (NRS), Scotland’s Census 2022, Religion and National Identity datasets.
Beyond ethnicity itself, Scotland’s census captures several related dimensions of national identity and belief that offer further context for the country’s diversity. For the first time in the survey’s history, more than half of Scots (51.1%) reported having no religion in 2022, a dramatic rise from 36.7% just eleven years earlier, continuing a decades-long secularization trend common across much of Western Europe.
National identity data reveals a more complex pattern, with those identifying as “Scottish only” rising modestly from 62.4% to 65.5%, while those identifying as “British only” nearly doubled from 8.4% to 13.9% — even as the share identifying with both Scottish and British identity simultaneously fell sharply from 18.3% to 8.2%. Meanwhile, Gaelic language skills continued their modest recovery, with 2.5% of Scots aged 3 and over reporting some ability in the language in 2022, an increase of over 43,100 people since 2011, reflecting ongoing government investment in Gaelic-medium education even as English remains overwhelmingly dominant, spoken by the vast majority of the population as recorded through Scotland’s detailed and directly-collected ethnic and cultural census data.
Disclaimer: The data research report we present here is based on information found from various sources. We are not liable for any financial loss, errors, or damages of any kind that may result from the use of the information herein. We acknowledge that though we try to report accurately, we cannot verify the absolute facts of everything that has been represented.