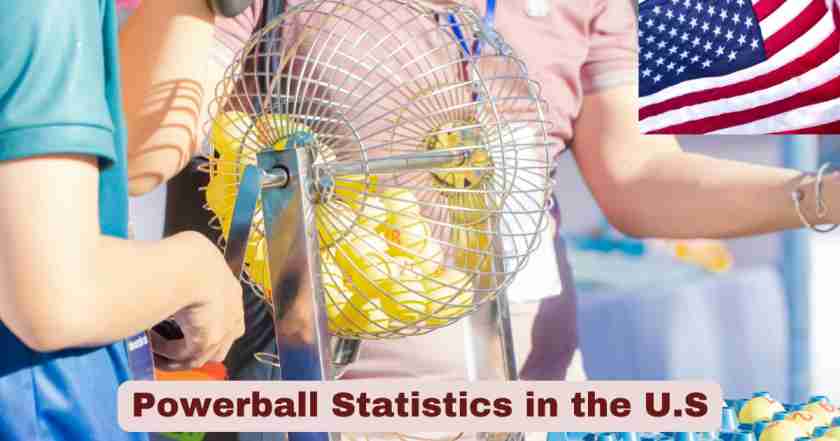
Powerball in the US 2025
Powerball continues to be one of the most iconic and widely played lottery games in the United States. Its simple format and promise of life-changing jackpots have made it a staple across the country. The game operates under a multi-jurisdictional system, allowing players from nearly every state and U.S. territory to participate. Regularly scheduled drawings throughout the week build excitement, while the chance to add optional multipliers keeps players engaged. Powerball appeals to a broad audience, from casual participants to regular lottery enthusiasts, all drawn to the dream of turning a small wager into a massive fortune.
In 2025, Powerball maintains its reputation as a major force in American entertainment and pop culture. Whether it’s a growing jackpot grabbing headlines or long-shot odds igniting hope, the game continues to fuel nationwide anticipation with each drawing. Beyond just the jackpot, Powerball offers various prize levels and bonus features that enhance the overall player experience. It’s more than just a lottery—it’s a shared national experience, uniting millions in the pursuit of possibility, excitement, and a chance at the American dream.
Powerball Stats & Facts in the US 2025
| Powerball Facts 2025 | Details |
|---|---|
| Total Participating Jurisdictions | 48 (45 states + DC + Puerto Rico + US Virgin Islands) |
| Drawing Schedule | Monday, Wednesday, Saturday |
| Ticket Price | $2 per play, $3 with Power Play |
| Number Selection Range | 5 numbers from 1-69, 1 Powerball from 1-26 |
| Starting Jackpot | $40 million |
| Overall Odds of Winning Any Prize | 1 in 24.87 |
| Odds of Winning Jackpot | 1 in 292,201,338 |
| Largest Jackpot Ever | $2.04 billion (November 2022) |
| Power Play Multipliers | 2x, 3x, 4x, 5x, 10x |
| Estimated Current Jackpot (July 2025) | $130.6 million cash value |
As of 2025, Powerball operates across 48 jurisdictions—including 45 states, Washington D.C., Puerto Rico, and the U.S. Virgin Islands—making it a nationwide sensation. Drawings are held three times a week on Monday, Wednesday, and Saturday, offering frequent opportunities to win. Each standard Powerball ticket costs $2, with an optional Power Play feature available for $1 extra, increasing non-jackpot prizes through multipliers. To play, participants must choose 5 numbers from 1 to 69, and 1 Powerball number from 1 to 26, a format designed to create large jackpots while maintaining reasonable odds of winning smaller prizes.
The starting jackpot for Powerball is an impressive $40 million, with total winnings often rolling over and accumulating into massive prize pools. The overall odds of winning any prize stand at 1 in 24.87, making it possible for millions to walk away with smaller wins. However, the odds of hitting the jackpot are 1 in 292,201,338, reflecting the game’s high-stakes appeal. The largest jackpot ever recorded was a staggering $2.04 billion, won in November 2022, setting a U.S. lottery record. Power Play multipliers—2x, 3x, 4x, 5x, and even 10x—enhance the game’s excitement, boosting secondary prizes substantially. As of July 2025, the estimated current jackpot stands at $130.6 million cash value, continuing to drive nationwide interest and participation with each draw.
Powerball Prize Distribution in the US 2025
| Prize Tier | Match Requirements | Base Prize | Power Play Prize | Odds |
|---|---|---|---|---|
| Grand Prize | 5 + Powerball | Jackpot | Jackpot | 1 in 292,201,338 |
| Second Prize | 5 numbers | $1,000,000 | $2,000,000 | 1 in 11,688,053 |
| Third Prize | 4 + Powerball | $50,000 | $100,000-$500,000 | 1 in 913,129 |
| Fourth Prize | 4 numbers | $100 | $200-$1,000 | 1 in 36,525 |
| Fifth Prize | 3 + Powerball | $100 | $200-$1,000 | 1 in 14,494 |
| Sixth Prize | 3 numbers | $7 | $14-$70 | 1 in 579 |
| Seventh Prize | 2 + Powerball | $7 | $14-$70 | 1 in 701 |
| Eighth Prize | 1 + Powerball | $4 | $8-$40 | 1 in 92 |
| Ninth Prize | Powerball only | $4 | $8-$40 | 1 in 38 |
The Powerball prize structure in 2025 maintains its nine-tier system, offering multiple ways for players to win across different prize categories. The second-tier prize of $1 million for matching all five white balls becomes $2 million with Power Play, making it one of the most attractive non-jackpot prizes in American lottery games. The third-tier prize of $50,000 for matching four numbers plus the Powerball can multiply to as much as $500,000 with the maximum Power Play multiplier.
Lower-tier prizes demonstrate the game’s accessibility, with matching just the Powerball earning $4, which doubles to $8 with Power Play. The 1 in 38 odds for the lowest prize tier ensure that players have a reasonable chance of winning something, contributing to the game’s sustained popularity. The Power Play multiplier significantly enhances the value proposition for all non-jackpot prizes, with the 10x multiplier available only when the jackpot is $150 million or less, creating strategic timing considerations for players.
Powerball Jackpot Trends in the US 2025
| Jackpot Metrics | Statistics |
|---|---|
| Average Starting Jackpot | $40 million |
| Current Estimated Jackpot | $130.6 million cash value |
| Largest 2025 Jackpot | $167.3 million (Kentucky winner) |
| Jackpot Rollover Frequency | 85% of drawings |
| Average Jackpot Growth | $5-15 million per drawing |
| Cash vs. Annuity Preference | 95% choose cash option |
| Multi-State Participation | 48 jurisdictions |
| Record Jackpot (All-Time) | $2.04 billion (2022) |
Powerball jackpot trends in 2025 show consistent growth patterns with the majority of drawings resulting in rollovers due to the challenging 1 in 292 million odds. The $167.3 million jackpot won in Kentucky represents the largest prize claimed in 2025 so far, demonstrating the game’s continued ability to create substantial winners. The 85% rollover frequency indicates that jackpots typically grow for several drawings before being won, creating mounting excitement and increased ticket sales.
The cash option preference remains overwhelmingly popular, with 95% of jackpot winners choosing the lump sum payment over the 30-year annuity option. This trend reflects modern financial planning preferences and the immediate gratification sought by winners. The average jackpot growth of $5-15 million per drawing depends on sales volume and participation rates, with weekend drawings typically generating higher increases due to increased player participation across all 48 participating jurisdictions.
Powerball Winner Demographics in the US 2025
| Winner Demographics | 2025 Statistics |
|---|---|
| Total Prize Winners (All Tiers) | 295,289 per drawing average |
| Jackpot Winners YTD | 3 winners |
| Million-Dollar Winners | 15 winners |
| $50,000+ Winners | 287 winners |
| Top Winning States | California, Texas, Florida |
| Power Play Usage | 28% of all tickets |
| Quick Pick vs. Self-Selected | 80% Quick Pick, 20% Self-Selected |
| Average Claim Time | 45 days |
The Powerball winner demographics for 2025 reveal interesting patterns in prize distribution and claiming behavior across the United States. With an average of 295,289 prize winners across all tiers per drawing, the game continues to create numerous winners despite the challenging jackpot odds. The three jackpot winners year-to-date represent typical frequency for the game, while 15 million-dollar winners from the second prize tier demonstrate the substantial non-jackpot prizes available.
California, Texas, and Florida lead in winner volume, correlating with their large populations and high participation rates. The 28% Power Play usage rate shows significant player interest in multiplying their potential winnings. The 80% Quick Pick preference aligns with national lottery trends, as most players prefer computer-generated random numbers. The 45-day average claim time indicates that winners typically take time to plan their financial strategies before claiming prizes, particularly for larger amounts.
Powerball Revenue and Economic Impact in the US 2025
| Economic Impact Metrics | 2025 Data |
|---|---|
| Total Annual Revenue | $4.2 billion estimated |
| State Educational Funding | $1.8 billion contributed |
| Retailer Commissions | $294 million |
| Administrative Costs | $168 million |
| Prize Payouts | $2.1 billion |
| Average Revenue per State | $87.5 million |
| Tickets Sold per Drawing | 38.5 million average |
| Employment Impact | 12,000 jobs supported |
The Powerball economic impact in 2025 demonstrates the game’s significant contribution to state economies and public programs across the United States. The estimated $4.2 billion in annual revenue represents a substantial economic driver, with $1.8 billion directed to educational funding in participating states. This 43% allocation to education varies by state but consistently provides crucial funding for public schools, scholarships, and educational programs.
Retailer commissions of $294 million support local businesses across the nation, with convenience stores, gas stations, and grocery stores receiving 7% commission on ticket sales. The average 38.5 million tickets sold per drawing reflects consistent player engagement, while the 12,000 jobs supported include lottery officials, retailers, and support staff. The $2.1 billion in prize payouts represents 50% of revenue, maintaining the game’s competitive payout ratio while funding essential state programs through the remaining proceeds.
Powerball Technology and Innovation in the US 2025
| Technology Features | 2025 Specifications |
|---|---|
| Digital Ticket Options | Available in 35 states |
| Mobile App Downloads | 15.2 million active users |
| Online Ticket Sales | $890 million annually |
| Drawing Security Technology | RNG certified systems |
| Ticket Verification | QR code scanning |
| Multi-State Coordination | Real-time data sharing |
| Prize Claim Processing | Digital verification |
| Player Education Tools | Interactive odds calculators |
Powerball technology advancement in 2025 showcases the modernization of America’s premier lottery game through digital innovation and enhanced security measures. The availability of digital ticket options in 35 states represents significant progress in player convenience, while 15.2 million active mobile app users demonstrate the successful transition to digital platforms. The $890 million in annual online ticket sales constitutes approximately 21% of total revenue, reflecting changing consumer preferences for digital transactions.
The RNG certified drawing systems ensure complete fairness and transparency in number selection, while QR code scanning provides instant ticket verification for players. Real-time data sharing across all 48 participating jurisdictions enables seamless coordination of jackpot calculations and prize distributions. The interactive odds calculators and player education tools help promote responsible gaming by clearly communicating the statistical realities of lottery participation, supporting informed decision-making among the millions of Americans who play Powerball regularly.
Disclaimer: The data research report we present here is based on information found from various sources. We are not liable for any financial loss, errors, or damages of any kind that may result from the use of the information herein. We acknowledge that though we try to report accurately, we cannot verify the absolute facts of everything that has been represented.


