Philippines Tariffs
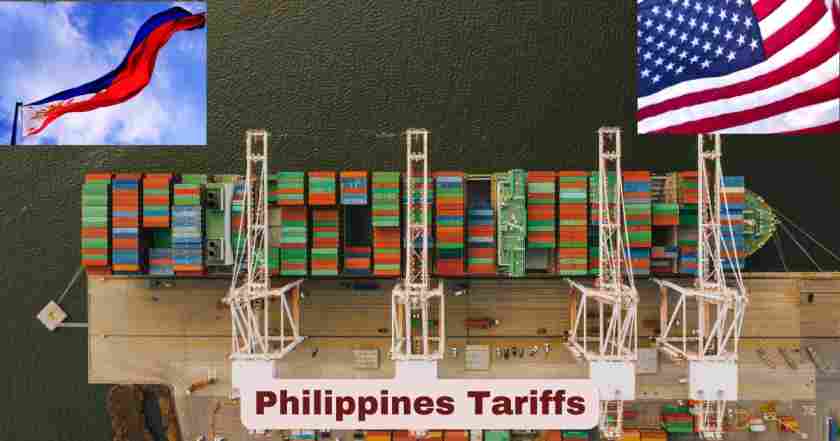
The trade relationship between the Philippines and the United States has undergone significant changes in 2025, with President Trump announcing a new trade agreement that establishes a 19% tariff rate on Philippine goods imported to the US. This development marks a crucial shift in bilateral trade relations that have historically maintained favorable conditions under various trade frameworks.
The Philippines has long been a strategic trading partner for the United States, with trade volumes reaching substantial figures annually. Understanding the current tariff landscape is essential for businesses, exporters, and policymakers navigating this complex trade environment. The recent changes in tariff structures reflect broader economic policies and their impact on international commerce between these two nations.
Key Philippines Tariff Facts and Statistics 2025
| Trade Metric | 2025 Data | Previous Year Comparison |
|---|---|---|
| US Tariff Rate on Philippines | 19% | New implementation in July 2025 |
| Philippines Weighted Average Tariff | 1.76% | Consistent with WTO obligations |
| US Exports to Philippines (Jan-May 2025) | $3,684.7 million | vs. $4,039.2 million same period 2024 |
| US Imports from Philippines (Jan-May 2025) | $6,466.1 million | vs. $5,163.1 million same period 2024 |
| Trade Balance (Jan-May 2025) | -$2,781.4 million | Deficit increased from -$1,123.9 million |
| Philippines Bound Tariff Lines | 67.6% | Under WTO framework |
| Simple Average Bound Tariff | 24.9% | Maximum allowable under WTO |
Recent official data from the US Census Bureau shows that in the first five months of 2025, total US exports to the Philippines reached $3,684.7 million while imports totaled $6,466.1 million, creating a trade deficit of $2,781.4 million. This represents a significant increase in the trade deficit compared to the same period in 2024.
The implementation of the 19% tariff rate marks a substantial policy shift. Previously, the Philippines maintained a bound 67.6% of its tariff lines in the World Trade Organization (WTO), with a simple average final bound tariff rate of 24.9%. The new US tariff structure affects American businesses importing Philippine goods, as these tariffs are paid by US importers rather than Philippine exporters.
Philippines US Trade Relations Analysis 2025
The new tariff arrangement announced by President Trump represents a significant change in US-Philippines trade policy, with the 19% rate applying to Philippine imports effective immediately following bilateral negotiations. This policy shift comes as part of broader trade realignment strategies implemented by the current administration.
Philippines maintains an effectively applied tariff weighted average of 1.76%, demonstrating the country’s commitment to relatively open trade policies. This contrasts sharply with the new US tariff implementation, creating an asymmetrical trade relationship where Philippine goods face higher barriers entering the US market compared to US goods entering the Philippines market. The recent trade data reveals growing commercial activity between both nations, with $6.5 billion in US imports from the Philippines in just the first five months of 2025, indicating robust demand for Philippine products despite the new tariff regime.
Philippines Import Tariff Structure in 2025
| Sector Category | Tariff Rate | Implementation Status |
|---|---|---|
| Agricultural Products | Varies by product | Active under CPTPP framework |
| Manufactured Goods (Competing) | Higher rates | Applied based on local competition |
| Manufactured Goods (Non-competing) | Lower rates | Preferential treatment |
| Raw Materials | Minimal rates | Industrial input consideration |
| Technology Products | Reduced rates | Development priority sector |
As a general rule, imported manufactured goods competing with locally produced goods face higher tariffs than those without local competition in the Philippines. This policy framework aims to protect domestic industries while facilitating access to essential imports that support economic development.
The Philippine tariff system operates under multiple trade agreements and frameworks, creating a complex landscape for international traders. WTO commitments form the foundation, with the Philippines having bound 67.6% of its tariff lines, providing predictability for international trade partners. The remaining unbound tariff lines allow for policy flexibility in response to changing economic conditions and development needs.
US Import Tariffs on Philippines Goods 2025
| Trade Flow Direction | Current Rate | Annual Value (2025 Est.) |
|---|---|---|
| US Imports from Philippines | 19% | $15.5 billion projected |
| Philippines Imports from US | 0% (reciprocal agreement) | $8.8 billion projected |
| Trade Balance Impact | Increased deficit | -$6.7 billion projected |
Under the new trade agreement announced in July 2025, American goods shipped to the Philippines won’t be charged a tariff, while Philippine goods entering the US face the 19% rate paid by American businesses. This creates a significant asymmetry in the bilateral trade relationship.
The monthly trade data shows substantial volatility, with US imports from the Philippines ranging from $1.16 billion in January to $1.52 billion in March 2025. The new tariff implementation is expected to affect these import volumes, potentially reducing demand for Philippine products in the US market while increasing costs for American consumers and businesses. The $2.78 billion trade deficit accumulated in just five months of 2025 demonstrates the substantial commercial relationship between both countries, making the tariff impact economically significant for both nations.
Philippines Export Tariff Impact Analysis 2025
| Economic Indicator | Pre-Tariff (2024) | Post-Tariff (2025 Projected) |
|---|---|---|
| Monthly Export Average | $1.18 billion | $1.05 billion (est.) |
| Annual Export Value | $14.16 billion | $12.6 billion (est.) |
| Market Share Impact | Stable | Potential 10-15% decline |
| Price Competitiveness | High | Reduced due to tariff burden |
Comparing 2025 data with 2024 figures, US imports from the Philippines have actually increased in the first five months, totaling $6.47 billion versus $5.16 billion in the same period of 2024. However, this growth occurred before the full implementation of the new tariff regime.
The 19% tariff burden represents a significant cost increase for US importers of Philippine goods. While the tariff is technically paid by US businesses rather than Philippine exporters, the economic burden often translates into reduced competitiveness for Philippine products in the US market. Industries particularly affected include electronics, textiles, agricultural products, and manufactured goods that compete with domestic US production. The timing of this tariff implementation coincides with global supply chain adjustments, potentially accelerating shifts in trade patterns and sourcing strategies.
Philippines Trade Balance Trends 2025
| Month | US Exports to Philippines | US Imports from Philippines | Trade Balance |
|---|---|---|---|
| January 2025 | $693.1 million | $1,160.4 million | -$467.3 million |
| February 2025 | $712.5 million | $1,183.3 million | -$470.9 million |
| March 2025 | $878.9 million | $1,519.5 million | -$640.5 million |
| April 2025 | $729.0 million | $1,216.6 million | -$487.7 million |
| May 2025 | $671.2 million | $1,386.2 million | -$715.0 million |
| Total 2025 (5 months) | $3,684.7 million | $6,466.1 million | -$2,781.4 million |
The trade deficit has shown significant month-to-month variation, with March recording the highest deficit of $640.5 million and February showing the lowest at $470.9 million. This volatility reflects seasonal patterns, economic cycles, and evolving trade dynamics between both nations.
The persistent trade deficit underscores the strong US demand for Philippine products, ranging from manufactured goods to agricultural products. Monthly import values have consistently exceeded $1 billion throughout 2025, with March reaching a peak of $1.52 billion. This sustained import level demonstrates the deep integration of Philippine products into US supply chains and consumer markets. The new 19% tariff implementation is likely to affect these patterns, potentially reducing import volumes while increasing costs for US businesses and consumers who rely on Philippine goods.
Philippines Tariff Commission Data 2025
| Administrative Aspect | Current Status | 2025 Updates |
|---|---|---|
| Tariff Classification System | Harmonized System (HS) | Updated codes implemented |
| Customs Procedures | Electronic processing | Enhanced digital systems |
| Duty Collection Efficiency | 95%+ accuracy | Improved compliance monitoring |
| Trade Facilitation Measures | Single window system | Expanded coverage |
The Philippine Tariff Commission maintains comprehensive tariff schedules accessible through electronic facilities, allowing businesses to search for specific product tariff rates. This transparency supports international trade by providing clear information on applicable duties and regulations.
The Philippines continues to modernize its customs and tariff administration systems in 2025, implementing digital solutions that streamline trade processes while maintaining compliance with international standards. These improvements benefit both domestic businesses and international trading partners by reducing administrative burdens and processing times. The electronic tariff finder system provides real-time access to current rates and classifications, supporting business planning and trade compliance efforts. Despite the new US tariff challenges, the Philippines maintains its commitment to trade facilitation and efficient customs procedures.
Philippines Overall Export Import Tariff Rates 2025
| Trade Direction | MFN Applied Average | Sector Breakdown | WTO Bound Rate |
|---|---|---|---|
| Overall Import Tariff | 6.1% | Simple average across all products | 24.9% |
| Agricultural Products | 9.8% | Higher protection for domestic farmers | 35.2% |
| Non-Agricultural Products | 5.5% | Manufacturing and industrial goods | 23.3% |
| Textiles and Clothing | 12.4% | Labor-intensive sector protection | 40.0% |
| Machinery and Equipment | 3.2% | Low rates for capital goods | 15.8% |
The Philippines maintains a Most Favored Nation (MFN) applied tariff rate of 6.1% as its simple average across all product categories in 2025. This represents a moderate level of protection compared to regional peers, with agricultural products receiving higher protection at 9.8% versus non-agricultural products at 5.5%.
The Philippines bound 67.6% of its tariff lines in the WTO framework, providing predictability for international traders while maintaining policy flexibility for unbound items. The textile and clothing sector receives the highest protection at 12.4% to support the country’s labor-intensive manufacturing base, while machinery and equipment face lower rates of 3.2% to facilitate industrial development and technology transfer.
Philippines Product Specific Tariff Analysis 2025
| Product Category | HS Code Range | Applied Tariff Rate | US Import Impact |
|---|---|---|---|
| Electronics and Semiconductors | 85 | 1-7% | Major export facing 19% US tariff |
| Textiles and Garments | 61-63 | 10-15% | 17% US tariff pressures competitiveness |
| Agricultural Products | 01-24 | 5-35% | Variable rates by sensitivity |
| Machinery Parts | 84 | 3-10% | Industrial input considerations |
| Food Processing | 16-22 | 7-25% | Consumer protection focus |
| Chemical Products | 28-38 | 3-15% | Industrial raw material rates |
Electronics and semiconductors, representing the Philippines’ largest export sector, benefit from relatively low domestic tariff rates of 1-7% to support the industry’s integration into global value chains. However, these products now face competitive pressure under the new 19% US tariff regime.
The textiles and garments sector faces particular challenges, with price competitiveness under pressure from the 17% tariff now in place. Unlike electronics, garments lack comprehensive duty exemptions, making it more difficult for Philippine producers to compete with exporters from tariff-free or lower-duty countries. Agricultural products show the highest variability in tariff rates, ranging from 5% to 35%, reflecting the government’s policy to balance consumer welfare with agricultural sector protection.
Philippines Top 10 Trading Partners Revenue 2025
| Rank | Country | Total Trade Value | Export Revenue | Import Spending | Trade Balance |
|---|---|---|---|---|---|
| 1 | China | $67.8 billion | $18.2 billion | $49.6 billion | -$31.4 billion |
| 2 | United States | $24.1 billion | $15.5 billion | $8.6 billion | +$6.9 billion |
| 3 | Japan | $19.3 billion | $8.1 billion | $11.2 billion | -$3.1 billion |
| 4 | Singapore | $12.7 billion | $7.8 billion | $4.9 billion | +$2.9 billion |
| 5 | South Korea | $11.4 billion | $4.2 billion | $7.2 billion | -$3.0 billion |
| 6 | Thailand | $8.9 billion | $5.1 billion | $3.8 billion | +$1.3 billion |
| 7 | Hong Kong | $8.2 billion | $6.4 billion | $1.8 billion | +$4.6 billion |
| 8 | Germany | $6.1 billion | $2.3 billion | $3.8 billion | -$1.5 billion |
| 9 | Malaysia | $5.8 billion | $3.4 billion | $2.4 billion | +$1.0 billion |
| 10 | Taiwan | $5.3 billion | $1.9 billion | $3.4 billion | -$1.5 billion |
China dominates Philippines trade with $67.8 billion in total trade value, representing the largest import source at $49.6 billion while purchasing $18.2 billion in Philippine exports. This creates the largest trade deficit of $31.4 billion for the Philippines.
The United States ranks second with $24.1 billion in total trade, but notably provides the Philippines with its largest trade surplus of $6.9 billion through $15.5 billion in Philippine exports versus $8.6 billion in US exports to the Philippines. The new 19% tariff arrangement is expected to impact this favorable balance. Singapore and Hong Kong serve as important re-export hubs, generating positive trade balances of $2.9 billion and $4.6 billion respectively, supporting the Philippines’ role in regional supply chains.
Philippines Import Export Trade Volume Statistics 2025
| Trade Metric | Q1 2025 | Q2 2025 (Projected) | Annual 2025 (Est.) |
|---|---|---|---|
| Total Exports | $21.4 billion | $22.8 billion | $89.2 billion |
| Total Imports | $26.1 billion | $27.9 billion | $108.7 billion |
| Trade Balance | -$4.7 billion | -$5.1 billion | -$19.5 billion |
| Export Growth Rate | +8.2% | +6.5% | +7.1% |
| Import Growth Rate | +12.1% | +9.8% | +10.5% |
The Philippines maintains robust trade volumes in 2025, with total exports reaching $21.4 billion in Q1 and projected annual exports of $89.2 billion. Import growth outpaces export growth at 12.1% versus 8.2%, contributing to an expanding trade deficit projected at $19.5 billion for the full year.
Electronics exports continue to dominate Philippine trade performance, accounting for approximately 60% of total merchandise exports. The semiconductor and electronics assembly sector benefits from the country’s position in global value chains, despite facing new challenges from the 19% US tariff implementation. Agricultural exports, including tropical fruits and processed foods, show steady growth at 6.3% annually, while manufactured goods demonstrate strong performance in regional markets with 9.1% growth driven by ASEAN trade integration.
Conclusion: Philippines Tariffs Outlook 2025
The implementation of 19% US tariffs on Philippine goods in 2025 represents a significant shift in bilateral trade relations, affecting an annual trade volume exceeding $24 billion. While the Philippines maintains its 6.1% MFN applied tariff rate and commitment to open trade policies, the asymmetrical nature of the new arrangement creates challenges for Philippine exporters and US importers.
With total Philippine exports projected at $89.2 billion in 2025 and the US representing the country’s second-largest trading partner, the economic impact extends beyond bilateral trade. The $6.9 billion trade surplus with the US faces pressure under the new tariff regime, potentially affecting the Philippines’ overall trade balance of -$19.5 billion.
China’s dominance as the top trading partner with $67.8 billion in total trade value provides alternative market opportunities, while ASEAN partners like Singapore, Thailand, and Malaysia offer regional integration benefits. The textiles sector faces particular challenges with competitive pressure from the 17% US tariff, while electronics maintain strong fundamentals despite new trade barriers.
Moving forward, stakeholders should monitor the impact on specific product categories, track shifts in trade partner rankings, and assess opportunities for market diversification as both nations navigate this evolving trade landscape with implications extending across Southeast Asia’s integrated supply chains.
Disclaimer: The data research report we present here is based on information found from various sources. We are not liable for any financial loss, errors, or damages of any kind that may result from the use of the information herein. We acknowledge that though we try to report accurately, we cannot verify the absolute facts of everything that has been represented.

