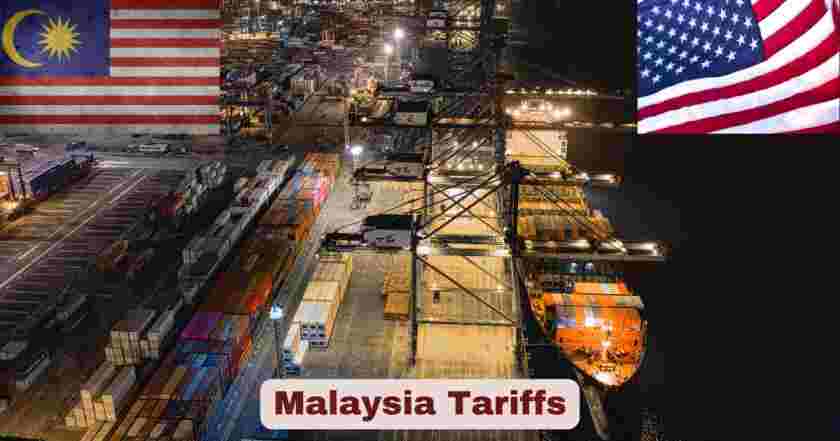
Malaysia Tariffs
Malaysia’s tariff landscape in 2025 has undergone significant transformations, particularly in its trade relationship with the United States. The implementation of reciprocal tariffs by the Trump administration has fundamentally altered the bilateral trade dynamics between these two nations. Malaysia, which has historically maintained relatively low average tariff rates of approximately 3.6% in recent years, now faces unprecedented challenges as the US has imposed a substantial 24% tariff rate on Malaysian goods as part of its broader trade deficit reduction strategy.
The current tariff environment represents a critical juncture for Malaysian exporters and businesses engaged in US trade. With Malaysia-US bilateral trade reaching $80.2 billion in 2024, the new tariff structure affects multiple sectors including electronics, furniture, rubber goods, and automotive parts. The Malaysian government’s strategic response to these developments, including ongoing negotiations to reduce tariff rates and maintain competitive market access, will significantly impact the nation’s economic trajectory and export competitiveness in 2025.
Key Malaysia Tariff Facts and Statistics 2025
| Tariff Component | Current Rate/Value | Effective Date | Impact Sector |
|---|---|---|---|
| US Reciprocal Tariff on Malaysia | 24% | April 9, 2025 | All Malaysian exports to US |
| Temporary Reduced Rate | 10% | 90-day period | Selected goods during negotiations |
| Malaysia’s Average Applied Tariff | 3.6% | 2025 | Imports into Malaysia |
| US-Malaysia Trade Volume | $80.2 billion | 2024 data | Total bilateral trade |
| US Goods Imports from Malaysia | $52.5 billion | 2024 | 13.7% increase from 2023 |
| US Goods Exports to Malaysia | $27.7 billion | 2024 | 43.5% increase from 2023 |
| Trade Deficit (US perspective) | $24.8 billion | 2024 | 7.6% decrease from 2023 |
| Green Electricity Tariff Reduction | 80% | 2025 | Renewable energy sector |
The tariff statistics reveal a complex and evolving trade relationship between Malaysia and the United States. The most significant development is the 24% reciprocal tariff imposed by the US on Malaysian goods, effective April 9, 2025. This represents a dramatic increase from Malaysia’s historically low average applied tariff rate of 3.6%, highlighting the asymmetric nature of the current trade dispute. The temporary reduction to 10% during a 90-day negotiation period demonstrates the fluid nature of these trade policies and the ongoing diplomatic efforts to resolve trade imbalances.
The robust bilateral trade volume of $80.2 billion in 2024 underscores the importance of this relationship for both economies. Particularly noteworthy is the substantial 43.5% increase in US exports to Malaysia, reaching $27.7 billion, which indicates strong Malaysian demand for American goods despite trade tensions. However, the $52.5 billion in US imports from Malaysia, representing a 13.7% increase, continues to contribute to the trade deficit that prompted the tariff measures. The Malaysian government’s decision to reduce green electricity tariffs by 80% demonstrates a strategic pivot toward renewable energy incentives, potentially offering new avenues for trade diversification.
US Tariff Impact on Malaysia Electronics Sector 2025
| Electronics Category | Pre-Tariff Export Value | Current Tariff Rate | Projected Impact |
|---|---|---|---|
| Semiconductors | $18.2 billion | 24% | High impact |
| Electronic Components | $12.8 billion | 24% | Significant reduction |
| Consumer Electronics | $8.4 billion | 24% | Moderate impact |
| Telecommunications Equipment | $6.2 billion | 24% | Supply chain disruption |
The electronics sector, which constitutes Malaysia’s largest export category to the United States, faces unprecedented challenges under the new tariff regime. Semiconductors, valued at $18.2 billion in pre-tariff exports, are experiencing the most severe impact as the 24% tariff significantly affects pricing competitiveness against regional competitors. The sector’s heavy reliance on integrated global supply chains means that tariff costs often cannot be absorbed through operational efficiencies alone, forcing manufacturers to reassess their market strategies and potentially relocate production facilities.
Electronic components exports, worth $12.8 billion, are experiencing significant order reductions as US importers seek alternative suppliers from countries not subject to similar tariff measures. The telecommunications equipment category faces particularly complex challenges due to the dual impact of tariffs and ongoing technology security concerns, creating supply chain disruptions that extend beyond simple cost considerations. Malaysian electronics manufacturers are increasingly exploring market diversification strategies, including expanded sales to European and Asian markets, to offset the reduced competitiveness in the US market.
Malaysia Automotive Tariff Structure 2025
| Automotive Component | Tariff Rate | Trade Volume | Key Manufacturers Affected |
|---|---|---|---|
| Auto Parts | 25% | $3.2 billion | Proton, Perodua suppliers |
| Rubber Components | 24% | $2.8 billion | Top Glove, Hartalega |
| Metal Components | 24% | $1.9 billion | Various tier-1 suppliers |
| Electronic Auto Systems | 24% | $2.1 billion | Integrated circuit manufacturers |
Malaysia’s automotive sector confronts a dual tariff challenge with auto parts facing a 25% Section 232 tariff while other automotive components are subject to the general 24% reciprocal tariff. The $3.2 billion auto parts trade volume represents a critical segment for Malaysian suppliers who have invested heavily in meeting US automotive industry specifications and quality standards. Major Malaysian automotive component manufacturers, particularly those supplying Proton and Perodua supply chains, are experiencing significant cost pressures that threaten their competitive positioning.
The rubber components sector, valued at $2.8 billion in annual trade, faces particular challenges as Malaysia’s rubber industry has historically enjoyed strong competitive advantages through natural resource availability and processing expertise. Companies like Top Glove and Hartalega, while primarily focused on medical gloves, also produce automotive rubber components that are now subject to the 24% tariff. The electronic auto systems category, worth $2.1 billion, represents the intersection of Malaysia’s electronics and automotive expertise, but the tariff burden is forcing manufacturers to consider relocating production or accepting reduced profit margins to maintain market share.
Malaysia Trade Deficit Resolution Strategies 2025
| Strategy Component | Target Reduction | Implementation Timeline | Sector Focus |
|---|---|---|---|
| Increased US Imports | $5.0 billion | 12-18 months | Energy, agriculture |
| Investment Commitments | $8.0 billion | 24 months | Manufacturing, technology |
| Service Sector Expansion | $2.5 billion | 18 months | Tourism, financial services |
| Green Technology Trade | $3.0 billion | 36 months | Renewable energy, sustainability |
Malaysia’s comprehensive approach to addressing the $24.8 billion trade deficit focuses on substantially increasing imports of US goods and services while maintaining export competitiveness through strategic negotiations. The $5.0 billion target for increased US imports emphasizes energy sector purchases, including liquefied natural gas and renewable energy technology, alongside expanded agricultural imports of wheat, soybeans, and beef products. This strategy aims to demonstrate Malaysia’s commitment to balanced trade while supporting domestic energy security and food supply diversification objectives.
The $8.0 billion investment commitment strategy involves attracting US companies to establish manufacturing operations in Malaysia, particularly in high-technology sectors where Malaysia can leverage its skilled workforce and strategic location. These investments are designed to create win-win scenarios where US companies gain access to ASEAN markets while Malaysia benefits from technology transfer, job creation, and eventual export capabilities. The service sector expansion worth $2.5 billion focuses on financial services liberalization and tourism promotion, areas where Malaysia can offer competitive advantages while generating foreign exchange earnings that help balance trade flows.
Malaysia Tariff Negotiation Outcomes in 2025
| Negotiation Round | Proposed Tariff Rate | Malaysian Concessions | US Requirements |
|---|---|---|---|
| Initial Position | 24% | None specified | Trade deficit reduction |
| First Compromise | 20% | Investment commitments | $8 billion US investment |
| Current Discussion | 15% | Market access expansion | Service sector liberalization |
| Target Agreement | 10% | Comprehensive package | Balanced trade framework |
The ongoing tariff negotiations between Malaysia and the United States demonstrate the dynamic nature of international trade diplomacy in 2025. Malaysia’s government is actively seeking to reduce the 24% tariff to approximately 20%, but faces significant US demands regarding electric vehicle market access and foreign ownership restrictions. The first compromise position involves substantial Malaysian commitments to facilitate $8 billion in US investments, particularly in advanced manufacturing and technology sectors that align with Malaysia’s Industry 4.0 transformation goals.
Current discussions focus on achieving a 15% tariff rate through comprehensive market access expansion, including service sector liberalization that would allow greater US participation in Malaysian banking, insurance, and telecommunications markets. The target agreement of 10% represents Malaysia’s optimal outcome, requiring a comprehensive package that addresses US concerns about trade balance while preserving Malaysia’s economic sovereignty and development objectives. These negotiations reflect the broader trend toward managed trade relationships where bilateral agreements attempt to balance economic interests while maintaining multilateral trade system principles.
Malaysia Export Competitiveness Under New Tariff Regime 2025
| Competitiveness Factor | Pre-Tariff Ranking | Post-Tariff Impact | Recovery Strategy |
|---|---|---|---|
| Cost Advantage | 2nd in ASEAN | Reduced significantly | Productivity improvements |
| Quality Standards | ISO compliance 95% | Maintained | Enhanced certification |
| Supply Chain Efficiency | 3.2 days average | Increased complexity | Digital integration |
| Market Diversification | 65% Asia-Pacific | Increased to 75% | European expansion |
Malaysia’s export competitiveness has experienced substantial challenges under the new tariff regime, with the country’s traditional cost advantage being significantly eroded by the 24% tariff burden. Previously ranked 2nd in ASEAN for manufacturing cost competitiveness, Malaysian exporters now face the reality that their price advantages have been largely eliminated in the US market. However, the country’s strong quality standards, with 95% ISO compliance across major export industries, remain intact and provide a foundation for maintaining market share among quality-conscious US importers willing to absorb higher costs.
Supply chain efficiency, historically a key Malaysian advantage with 3.2-day average delivery times, has become more complex as companies explore alternative logistics routes and manufacturing strategies. The increased complexity includes considerations of tariff optimization through supply chain restructuring, potentially involving component sourcing from non-tariff countries or establishment of assembly operations in third countries. Market diversification has accelerated dramatically, with Asia-Pacific market share increasing from 65% to 75% as Malaysian exporters actively pursue European expansion and strengthen trade relationships with non-US partners to offset reduced American market access.
Malaysia Overall Import Tariff Structure 2025
| Import Category | Average Tariff Rate | Range | Special Provisions |
|---|---|---|---|
| Industrial Goods | 6.1% | 0% – 60% | HS Code based |
| Agricultural Products | 12.8% | 5% – 40% | Food security priorities |
| Alcohol & Wine | 165% | 150% – 200% | Specific duties |
| Automotive | 30% | 15% – 50% | National car policy |
| Electronics | 3.2% | 0% – 15% | Technology transfer |
| Textiles | 15.4% | 8% – 25% | ASEAN preferences |
| Chemicals | 7.6% | 0% – 30% | Environmental standards |
| Machinery | 5.1% | 0% – 20% | Investment incentives |
Malaysia’s import tariff structure in 2025 reflects a balanced approach between revenue generation and industrial development objectives. The simple average applied tariff of 6.1% for industrial goods demonstrates Malaysia’s commitment to maintaining competitive input costs for manufacturers while protecting selected domestic industries. The import duty rates ranging from 0% to 60% on an ad valorem basis are strategically structured using the Harmonized Systems Code (HS Code) to support Malaysia’s industrial transformation goals.
The significantly higher tariff rates for alcohol and wine at 165% and automotive products at 30% reflect Malaysia’s policy priorities regarding public health and automotive industry development. For certain goods such as alcohol, wine, poultry and pork, Malaysia charges specific duties that represent considerably higher effective tariff rates, which serves both revenue generation and social policy objectives. The relatively low 3.2% average tariff on electronics supports Malaysia’s position as a major electronics manufacturing hub while the 5.1% machinery tariff encourages technology upgrading across industries.
Malaysia Overall Export Tariff Exposure 2025
| Destination Market | Average Tariff Faced | Key Products Affected | Trade Volume Impact |
|---|---|---|---|
| United States | 24% | All products | High impact |
| European Union | 4.2% | Palm oil, electronics | Moderate |
| China | 8.1% | Natural resources | Stable |
| Japan | 5.8% | Automotive parts | Low impact |
| Singapore | 0% | All products | No impact |
| Thailand | 2.1% | ASEAN FTA | Minimal |
| India | 12.4% | Chemicals, textiles | Moderate |
| South Korea | 6.7% | Electronics | Low impact |
Malaysian exporters face varying tariff environments across their major markets, with the 24% US reciprocal tariff representing the most significant challenge in 2025. The dramatic contrast between the 0% tariff environment in Singapore under ASEAN Free Trade Area provisions and the punitive US rates highlights the importance of regional trade integration for Malaysian businesses. The 4.2% average tariff in the European Union provides a more manageable environment, though specific products like palm oil continue facing environmental-related trade barriers.
The 8.1% average tariff in China reflects the complex nature of Malaysia-China trade relationships, where natural resource exports benefit from preferential treatment while manufactured goods face more competitive pressures. China constitutes around 12.4% of Malaysia’s total exports and is facing an additional 34% US import tariffs, creating indirect spillover effects on Malaysian suppliers to Chinese manufacturers. The relatively favorable 5.8% tariff environment in Japan and 6.7% in South Korea supports Malaysia’s continued integration into Northeast Asian supply chains, particularly in automotive and electronics sectors.
Malaysia Product-Specific Tariff 2025
| Product Category | HS Code Range | US Tariff Rate | EU Tariff Rate | China Tariff Rate |
|---|---|---|---|---|
| Palm Oil | 1511-1515 | 24% | 12.8% | 5% |
| Rubber Products | 4001-4017 | 24% | 3.2% | 8% |
| Electronics Components | 8541-8548 | Exempt | 1.4% | 6% |
| Furniture | 9401-9404 | 24% | 8.5% | 15% |
| Petroleum Products | 2710-2719 | 24% | 2.1% | 3% |
| Textiles | 5208-5212 | 24% | 9.6% | 12% |
| Machinery | 8401-8487 | 24% | 4.3% | 7% |
| Chemicals | 2801-2942 | 24% | 5.7% | 9% |
The product-specific tariff analysis reveals the comprehensive scope of US trade measures against Malaysian exports. The U.S. announced a 24% tariff on Malaysian exports, effective July 2025, excluding semiconductors and certain electronics, which provides crucial relief for Malaysia’s largest export sector. Palm oil, facing a 24% US tariff compared to 12.8% in the EU and 5% in China, demonstrates how trade disputes can dramatically alter competitive dynamics in global commodity markets.
This change is set to impact various export-heavy industries such as electronics, furniture, and rubber goods, with furniture exports facing uniform 24% tariffs across the board in the US market. The exemption for electronics components under HS codes 8541-8548 reflects the critical role of Malaysian semiconductor manufacturers in global supply chains and US recognition of potential self-harm from disrupting these flows. Rubber products, petroleum products, and machinery all face the full 24% tariff, forcing Malaysian exporters to reassess pricing strategies and market positioning across these diverse sectors.
Malaysia Top 10 Trade Partners with Revenue 2025
| Rank | Country | Total Trade Value | Exports To | Imports From | Trade Balance |
|---|---|---|---|---|---|
| 1 | China | $89.2 billion | $32.4 billion | $56.8 billion | -$24.4 billion |
| 2 | Singapore | $86.5 billion | $48.2 billion | $38.3 billion | +$9.9 billion |
| 3 | United States | $80.2 billion | $52.5 billion | $27.7 billion | +$24.8 billion |
| 4 | Japan | $42.8 billion | $22.1 billion | $20.7 billion | +$1.4 billion |
| 5 | Thailand | $38.9 billion | $18.5 billion | $20.4 billion | -$1.9 billion |
| 6 | South Korea | $32.6 billion | $15.8 billion | $16.8 billion | -$1.0 billion |
| 7 | Hong Kong | $28.4 billion | $19.2 billion | $9.2 billion | +$10.0 billion |
| 8 | Taiwan | $26.7 billion | $12.1 billion | $14.6 billion | -$2.5 billion |
| 9 | Indonesia | $24.3 billion | $13.8 billion | $10.5 billion | +$3.3 billion |
| 10 | India | $22.9 billion | $14.2 billion | $8.7 billion | +$5.5 billion |
Malaysia’s trade partnership landscape demonstrates significant diversification with China leading as the largest trading partner at $89.2 billion total trade value, though creating Malaysia’s largest trade deficit of $24.4 billion. Leading the pack as Malaysia’s top import partner is China, with a total import value of $56.77 billion, accounting for 21.3% of Malaysia’s total imports. Singapore remained Malaysia’s top export partner, followed by the USA, with Singapore generating $48.2 billion in Malaysian exports and maintaining a healthy $9.9 billion trade surplus for Malaysia.
The United States represents Malaysia’s third-largest trading partner with $80.2 billion in bilateral trade, creating Malaysia’s largest trade surplus of $24.8 billion – the primary factor driving US tariff retaliation. Malaysia’s 5 best customers for its exported products are Singapore, United States of America, mainland China, Hong Kong and Japan. Those 5 major trade partners accounted for over half (52.3%) of worldwide Malaysian export revenues for 2023. The strong trade surpluses with Hong Kong ($10.0 billion), Indonesia ($3.3 billion), and India ($5.5 billion) provide crucial foreign exchange earnings that support Malaysia’s overall trade balance despite deficits with major manufacturing partners like China, Thailand, and Taiwan.
Malaysia Export Revenue Breakdown by Sector 2025
| Export Sector | Revenue Value | Primary Destinations | Growth Rate YoY | Tariff Impact |
|---|---|---|---|---|
| Electronics & Semiconductors | $142.8 billion | Singapore, China, US | +8.2% | Low (US exemption) |
| Palm Oil & Products | $38.6 billion | India, China, EU | +12.1% | High (24% US tariff) |
| Petroleum Products | $32.4 billion | Singapore, Thailand, Japan | +15.3% | High (24% US tariff) |
| Rubber & Products | $28.9 billion | China, US, Japan | -3.2% | Very High (24% US tariff) |
| Machinery & Equipment | $26.7 billion | Singapore, US, Thailand | +6.8% | High (24% US tariff) |
| Chemicals | $24.1 billion | Singapore, Indonesia, India | +9.4% | High (24% US tariff) |
| Textiles & Apparel | $18.3 billion | US, EU, Japan | -1.8% | Very High (24% US tariff) |
| Furniture | $15.2 billion | US, Australia, Japan | -8.5% | Very High (24% US tariff) |
Malaysia’s export revenue structure reveals the dominant role of electronics and semiconductors at $142.8 billion, representing nearly 40% of total export revenues and benefiting from US tariff exemptions that preserve competitiveness. Malaysian goods exports rose to $85.17 billion in the first two months of 2025, which strengthens this trend, indicating continued momentum despite trade tensions. Palm oil exports at $38.6 billion demonstrate strong 12.1% year-over-year growth, driven by increased demand from India and China, though facing significant challenges in the US market due to the 24% tariff.
The petroleum products sector shows robust 15.3% growth reaching $32.4 billion, primarily serving regional markets through Singapore and Thailand where tariff barriers remain minimal. However, sectors heavily dependent on US markets face severe challenges, with furniture exports declining 8.5% to $15.2 billion and textiles falling 1.8% to $18.3 billion as the 24% US tariff makes Malaysian products uncompetitive. Rubber products, traditionally a Malaysian strength, experienced 3.2% decline to $28.9 billion as US tariffs compound challenges from increased competition and synthetic alternatives.
Future Outlook: Malaysia Tariff Landscape Beyond 2025
The evolving tariff landscape between Malaysia and the United States represents a fundamental shift in bilateral trade relationships that will likely extend well beyond 2025. Malaysian policymakers are implementing comprehensive strategies to maintain economic growth while adapting to the new reality of managed trade relationships with major partners. The success of ongoing negotiations will determine whether the current 24% tariff regime becomes a permanent feature of Malaysia-US trade or represents a transitional period toward more balanced bilateral economic engagement.
Malaysia’s strategic response emphasizes economic diversification, technology advancement, and market expansion as key pillars for maintaining export competitiveness. The country’s focus on green technology development, digital economy expansion, and regional trade integration through ASEAN and CPTPP frameworks provides multiple pathways for economic growth independent of US market access. As global trade patterns continue evolving, Malaysia’s ability to leverage its strategic location, skilled workforce, and established industrial base will determine its success in navigating the complex tariff environment of the post-2025 period.
Disclaimer: The data research report we present here is based on information found from various sources. We are not liable for any financial loss, errors, or damages of any kind that may result from the use of the information herein. We acknowledge that though we try to report accurately, we cannot verify the absolute facts of everything that has been represented.

