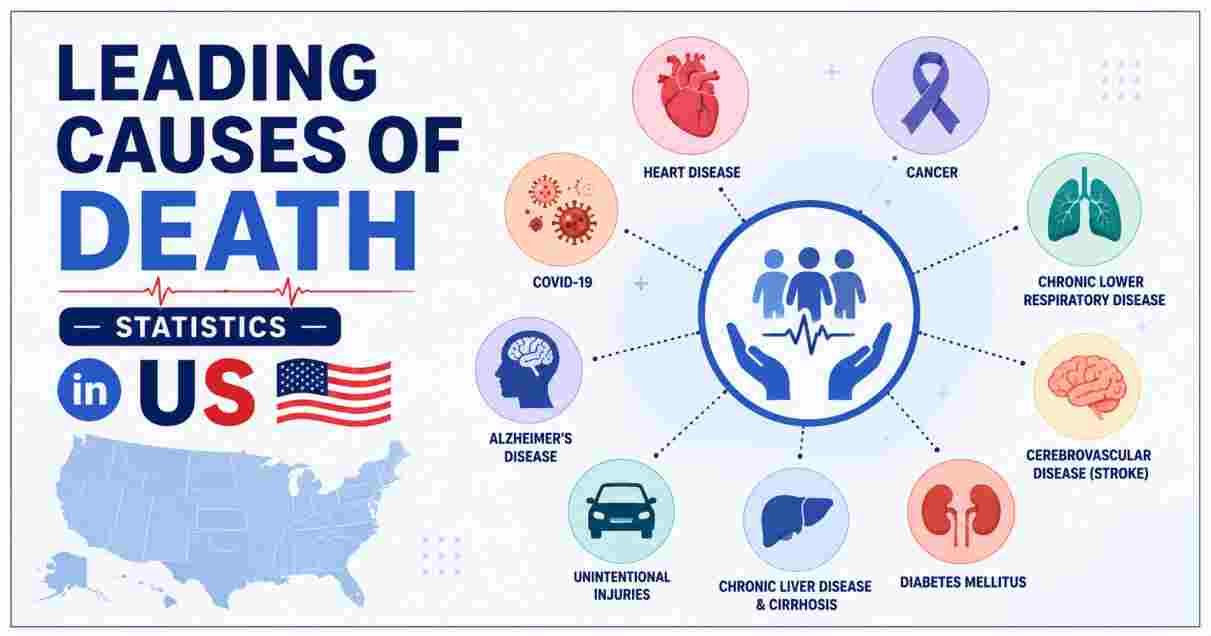
Leading Causes of Death in America 2026
Death is the most democratic of all statistics — it touches every household, every zip code, and every demographic group in the United States. What the data consistently reveal, however, is that how and when Americans die is far from random. It follows powerful patterns shaped by age, sex, race, income, and geography — patterns that public health researchers, policymakers, and physicians spend entire careers trying to understand and address. The most current authoritative picture of American mortality comes from the National Center for Health Statistics (NCHS) Data Brief Number 548, published in January 2026, which presents final 2024 mortality data drawn from death certificates filed in all 50 states and the District of Columbia via the National Vital Statistics System (NVSS). The headline finding is cautiously encouraging: life expectancy for the US population rose to 79.0 years in 2024, an increase of 0.6 year from 78.4 in 2023, and the overall age-adjusted death rate fell 3.8% from 750.5 per 100,000 in 2023 to 722.1 per 100,000 in 2024. But behind that positive trend lie stark inequalities, a persistent gender gap in mortality, and some deeply concerning cause-specific patterns.
In 2024, a total of 3,072,039 deaths occurred in the United States, according to the NCHS provisional data published in September 2025. The ten leading causes of death accounted for 70.9% of all US deaths — a figure that has been remarkably stable across recent years and reflects the degree to which a relatively small set of chronic and external causes dominate American mortality. The most significant change on the 2024 top-ten list compared to 2023 is the displacement of COVID-19, which fell from the 10th leading cause in 2023 to the 15th leading cause in 2024 following a 37.1% drop in COVID-19 deaths, from 49,932 in 2023 to 31,426 in 2024. In its place on the top-ten list entered suicide, which claimed 48,824 lives in 2024, reflecting both the enduring mental health burden on Americans and the persistent lethality of a condition that receives dramatically less public health funding than diseases responsible for fewer deaths.
Key Facts: Leading Causes of Death Statistics in the US 2026
TOP 10 LEADING CAUSES OF DEATH — US 2024 (NCHS FINAL DATA)
============================================================

 1. Heart Disease          |████████████████████████████████████  683,491 deaths
 2. Cancer                 |████████████████████████████████      619,876 deaths
 3. Unintentional Injuries |███████████                           197,449 deaths
 4. Stroke                 |█████████                             166,852 deaths
 5. Chronic Lower Resp.    |████████                              145,643 deaths
 6. Alzheimer's Disease    |██████                                116,022 deaths
 7. Diabetes               |█████                                  94,445 deaths
 8. Kidney Disease         |███                                    55,081 deaths
 9. Liver Disease          |███                                    52,274 deaths
10. Suicide                |███                                    48,824 deaths

(Source: CDC NCHS FastStats / Mortality in the United States 2024, Data Brief No. 548, January 2026)
| Rank | Cause of Death | Deaths (2024) | Age-Adjusted Rate per 100,000 |
|---|---|---|---|
| 1 | Heart disease | 683,491 | 157.6 |
| 2 | Cancer (malignant neoplasms) | 619,876 | 139.4 |
| 3 | Unintentional injuries (accidents) | 197,449 | 53.3 |
| 4 | Stroke (cerebrovascular diseases) | 166,852 | 38.6 |
| 5 | Chronic lower respiratory diseases | 145,643 | 32.4 |
| 6 | Alzheimer’s disease | 116,022 | 27.1 |
| 7 | Diabetes mellitus | 94,445 | 21.7 |
| 8 | Nephritis / kidney disease | 55,081 | 12.6 |
| 9 | Chronic liver disease and cirrhosis | 52,274 | 12.7 |
| 10 | Suicide | 48,824 | 13.7 |
Source: CDC NCHS FastStats — Deaths and Mortality; Mortality in the United States, 2024, NCHS Data Brief No. 548, January 29, 2026
The 2024 final mortality data from the NCHS confirms patterns that have defined American public health for decades while introducing a few significant shifts. Heart disease and cancer remain entrenched in the top two positions, together accounting for over 1.3 million American deaths in a single year — a number that dwarfs every other cause on the list. The scale of cardiac and oncologic mortality in the United States reflects decades of dietary patterns, aging demographics, environmental exposures, and healthcare inequities that no single policy intervention has yet been able to adequately address. The 14.4% drop in unintentional injury deaths from 62.3 to 53.3 per 100,000 — driving the cause down from its rate of 222,698 deaths in 2023 to 197,449 in 2024 — represents the most dramatic year-over-year improvement among all ten leading causes and is largely attributable to the continuing decline in drug overdose deaths, particularly from synthetic opioids.
The entry of suicide as the 10th leading cause of death in 2024, replacing COVID-19, is a development that deserves attention beyond the statistical ranking change. Suicide claimed 48,824 American lives in 2024 — roughly the size of a mid-sized American city — and it did so while receiving only a fraction of the research funding, clinical infrastructure, and public awareness campaigns directed at other major causes of death. The simultaneous decline in COVID-19 deaths (down 37.1% to 31,426 in 2024) is a genuine public health success story, reflecting the cumulative effects of vaccination, natural immunity, and improved treatment. But COVID-19’s departure from the top ten should not obscure the fact that it still killed 31,000+ Americans in 2024 — roughly comparable to annual flu deaths in severe seasons.
Mortality Statistics by Gender in the US 2026
DEATH RATE BY SEX — US 2024 (AGE-ADJUSTED, PER 100,000)
========================================================

Males    |████████████████████████████████████████████  844.8 per 100,000
Females  |████████████████████████████████             613.5 per 100,000

Gender mortality gap:  Males die at 37.7% higher rate than females

Life Expectancy 2024:
  Males:   76.5 years  |████████████████████████████████████████
  Females: 81.4 years  |████████████████████████████████████████████████

Gender gap in life expectancy: 4.9 years (decreased 0.4 year from 2023)

(Source: NCHS Data Brief No. 548, January 2026; NCHS Provisional Data 2024, September 2025)
| Metric | Males | Females | Gap |
|---|---|---|---|
| Age-adjusted death rate (per 100,000) | 844.8 | 613.5 | Males: 37.7% higher |
| Life expectancy at birth (2024) | 76.5 years | 81.4 years | 4.9-year gap |
| Life expectancy at birth (2023) | 75.8 years | 81.1 years | 5.3-year gap |
| YoY improvement in life expectancy | +0.7 years | +0.3 years | Males improving faster |
| Life expectancy at age 65 (2024) | 18.4 years | 20.8 years | 2.4-year gap |
| Life expectancy at age 65 (2023) | 18.2 years | 20.7 years | 2.5-year gap (narrowing) |
| Suicide death rate disparity | Males: ~4x higher suicide rate | — | Males ~77.9% of all suicides |
| Unintentional injury death rate | Substantially higher in males | — | Drug overdose, motor vehicle crashes |
Source: NCHS Data Brief No. 548, “Mortality in the United States, 2024,” January 29, 2026; NCHS Provisional Data Report, September 2025
The gender mortality gap in the United States — where men die at an age-adjusted rate of 844.8 per 100,000 compared to women’s 613.5 per 100,000 — is one of the most durable and least discussed disparities in American public health. Men are 37.7% more likely to die in any given year on an age-adjusted basis, and they reach that death on average 4.9 years earlier than women. The 2024 data shows a slight narrowing of this gap: male life expectancy improved by 0.7 years while female life expectancy improved by only 0.3 years, partially closing a gap that widened sharply during the COVID-19 pandemic years when male excess mortality was particularly pronounced. Despite this narrowing, the fundamental structural drivers of the male mortality disadvantage — higher rates of heart disease, unintentional injury death, suicide, homicide, and occupational hazards — remain firmly in place.
The suicide gender disparity warrants specific attention within this broader context. While suicide claimed 48,824 lives in 2024, the distribution of those deaths is deeply unequal by sex: men account for approximately 77.9% of all suicide deaths, dying by suicide at nearly four times the rate of women. This is not because men experience more suicidal ideation — women report higher rates of suicidal thoughts and are more likely to attempt suicide — but because men are more likely to use firearms, which are far more lethal. The life expectancy at age 65 gap of 2.4 years between men and women also has enormous implications for retirement policy, Social Security planning, and elder care provision, since women are substantially more likely to spend their later years as widows managing finances and healthcare alone.
Leading Causes of Death by Age Group in the US 2026
DEATH RATE BY AGE GROUP — US 2024 (DEATHS PER 100,000 POPULATION)
==================================================================

Ages  1–4    |▌                          25.6 per 100,000
Ages  5–14   |▌                          14.5 per 100,000
Ages 15–24   |███                        66.9 per 100,000
Ages 25–34   |██████                    124.5 per 100,000
Ages 35–44   |█████████                 213.9 per 100,000
Ages 45–54   |█████████████████         386.9 per 100,000
Ages 55–64   |████████████████████████████████  859.8 per 100,000
Ages 65–74   |████████████████████████████████████████████████████████████████  1,772.9
Ages 75–84   |████████ (off scale)      4,264.0 per 100,000
Ages 85+     |████████ (off scale)     13,834.0 per 100,000

(Source: NCHS Data Brief No. 548, January 2026)
| Age Group | Death Rate per 100,000 (2024) | Leading Causes |
|---|---|---|
| Under 1 (infant) | 552.5 per 100,000 live births (IMR) | Congenital malformations, low birth weight, SIDS |
| Ages 1–4 | 25.6 | Unintentional injuries, congenital malformations, homicide |
| Ages 5–14 | 14.5 (unchanged from 2023) | Unintentional injuries, cancer, suicide |
| Ages 15–24 | 66.9 (down 12.9% from 2023) | Unintentional injuries, suicide, homicide |
| Ages 25–34 | 124.5 (down 15.9% from 2023) | Unintentional injuries, suicide, homicide |
| Ages 35–44 | 213.9 (down 9.9% from 2023) | Unintentional injuries, heart disease, suicide |
| Ages 45–54 | 386.9 (down 6.0% from 2023) | Heart disease, cancer, unintentional injuries |
| Ages 55–64 | 859.8 (down 4.4% from 2023) | Cancer, heart disease, unintentional injuries |
| Ages 65–74 | 1,772.9 (down 2.0% from 2023) | Heart disease, cancer, stroke |
| Ages 75–84 | 4,264.0 (down 1.9% from 2023) | Heart disease, cancer, Alzheimer’s, stroke |
| Ages 85+ | 13,834.0 (down 3.2% from 2023) | Heart disease, Alzheimer’s, cancer, stroke |
Source: NCHS Data Brief No. 548, “Mortality in the United States, 2024,” Table 3; CDC NCHS FastStats — Deaths and Mortality; CDC WISQARS Leading Causes of Death
The age-stratified death rate data tells perhaps the most important story in American mortality statistics: death is exponentially concentrated at older ages. The death rate for Americans aged 85 and older — 13,834 per 100,000 — is over 200 times higher than the rate for children aged 5–14 (14.5 per 100,000). This enormous gradient has profound implications for health policy, resource allocation, and public health priorities. The largest single-year percentage improvements in 2024 occurred in the 25–34 age group (down 15.9%) and the 15–24 age group (down 12.9%) — both strongly linked to the declining death toll from drug overdoses, particularly fentanyl-related deaths, which drove a major upward spike in young adult mortality during the peak opioid crisis years.
The pattern of leading causes by age group reflects the fundamental biology of aging and the social determinants of early death. For children and young adults, unintentional injury, suicide, and homicide dominate — external, often preventable causes that have nothing to do with the chronic disease burden that kills older Americans. Suicide is the second leading cause of death for ages 10–34 and the fourth leading cause for ages 35–44, according to CDC WISQARS data for 2023, a pattern that has persisted for years and reflects the profound failure to adequately address mental health in younger Americans. Heart disease and cancer begin their climb in middle age, and by ages 65 and above they dominate the mortality picture entirely, with Alzheimer’s disease rising steeply as the population reaches the oldest age brackets where it becomes the fourth and eventually a top-two cause.
Death Rates by Race and Ethnicity in the US 2026
AGE-ADJUSTED DEATH RATES BY RACE/ETHNICITY AND SEX — US 2024
=============================================================

American Indian/Alaska Native Males    |████████████████████████████████  1,213.0
Black/African American Males           |████████████████████████████      1,094.9
White Non-Hispanic Males               |████████████████████████          871.1
Hispanic Males                         |████████████████████              651.9
Asian Non-Hispanic Males               |████████████████                  454.2

American Indian/Alaska Native Females  |████████████████████████          872.7
Black/African American Females         |████████████████████              727.2
White Non-Hispanic Females             |████████████████                  646.6
Hispanic Females                       |███████████████                   454.6
Asian Non-Hispanic Females             |██████████                        317.6

(Deaths per 100,000; Source: NCHS Data Brief No. 548, January 2026)
| Population Group | Age-Adjusted Death Rate 2024 (per 100,000) | Change from 2023 |
|---|---|---|
| American Indian / Alaska Native males | 1,213.0 | Down 5.1% from 1,277.7 |
| American Indian / Alaska Native females | 872.7 | Down 5.2% from 920.3 |
| Black / African American males | 1,094.9 | Down 4.9% from 1,151.6 |
| Black / African American females | 727.2 | Down 3.5% from 753.6 |
| White non-Hispanic males | 871.1 | Down 3.9% from 906.4 |
| White non-Hispanic females | 646.6 | Down 2.4% from 662.8 |
| Hispanic males | 651.9 | Down 5.9% from 692.8 |
| Hispanic females | 454.6 | Down 3.8% from 472.4 |
| Asian non-Hispanic males | 454.2 | Down 4.6% from 476.1 |
| Asian non-Hispanic females | 317.6 | Down 5.1% from 334.6 |
Source: NCHS Data Brief No. 548, “Mortality in the United States, 2024,” Table 2 — Age-adjusted death rates by race, Hispanic origin, and sex, 2023 and 2024, January 29, 2026
The racial and ethnic mortality data from 2024 reveals both persistent structural disparities and broad improvement across all groups. The most striking disparity is the death rate gap between American Indian and Alaska Native males (1,213.0 per 100,000) and Asian non-Hispanic females (317.6 per 100,000) — a nearly fourfold difference in the probability of dying in a given year, adjusted for age. This gap reflects cumulative inequities in healthcare access, economic opportunity, environmental exposure, and the legacy of historical policies. The encouraging news is that every racial and ethnic group saw age-adjusted death rate decreases from 2023 to 2024, with Hispanic males achieving the largest improvement (5.9%) and American Indian / Alaska Native females seeing a 5.2% decrease — both meaningful improvements even as these populations continue to carry disproportionate mortality burdens.
Black men continue to carry a substantially higher mortality burden than white men — a 1,094.9 versus 871.1 per 100,000 rate, or roughly 25.7% higher — driven by higher rates of cardiovascular disease, homicide, diabetes, and kidney disease, all of which are themselves shaped by structural factors including differential access to healthcare, exposure to neighborhood violence, and the chronic stress associated with systemic racial inequity. The “Hispanic paradox” — the finding that Hispanic Americans have lower death rates than non-Hispanic white Americans despite generally lower average incomes and healthcare access — is visible again in the 2024 data, with Hispanic males at 651.9 per 100,000 versus White non-Hispanic males at 871.1 per 100,000. This pattern has been documented consistently for decades and is thought to reflect a combination of selective migration, cultural protective factors, and dietary patterns.
Life Expectancy & Overall Mortality Trends in the US 2026
US LIFE EXPECTANCY AT BIRTH — RECENT TREND
===========================================

2021  |████████████████████████████████████████  76.1 years (COVID low point)
2022  |████████████████████████████████████████  77.5 years (+1.4 yr recovery)
2023  |████████████████████████████████████████  78.4 years (+0.9 yr recovery)
2024  |████████████████████████████████████████  79.0 years (+0.6 yr recovery)

Male life expectancy 2024:   76.5 years
Female life expectancy 2024: 81.4 years

(Source: NCHS Data Brief No. 548, January 2026)
| Life Expectancy Metric | 2024 Data | Change from 2023 |
|---|---|---|
| Overall US life expectancy at birth | 79.0 years | +0.6 year from 78.4 (2023) |
| Male life expectancy at birth | 76.5 years | +0.7 year from 75.8 (2023) |
| Female life expectancy at birth | 81.4 years | +0.3 year from 81.1 (2023) |
| Life expectancy at age 65 (all) | 19.7 years | +0.2 year from 19.5 (2023) |
| Life expectancy at age 65 (males) | 18.4 years | +0.2 year from 18.2 (2023) |
| Life expectancy at age 65 (females) | 20.8 years | +0.1 year from 20.7 (2023) |
| Overall age-adjusted death rate 2024 | 722.1 per 100,000 | Down 3.8% from 750.5 (2023) |
| Total deaths registered in US 2024 | 3,072,039 | Provisional; covers 99.9% of records |
| Top 10 causes share of all deaths | 70.9% | Consistent with 2023 |
Source: NCHS Data Brief No. 548, “Mortality in the United States, 2024,” January 29, 2026; NCHS Provisional Data Report 2024, September 2025
The recovery of US life expectancy to 79.0 years in 2024 represents the third consecutive year of post-pandemic improvement and is a genuine public health milestone. At the depths of the COVID-19 pandemic in 2021, US life expectancy fell to 76.1 years — the lowest level since 1996 — and the three-year climb back to 79.0 reflects the combined effects of declining COVID-19 mortality, a significant fall in drug overdose deaths, and broad improvements across most major cause-of-death categories. That said, 79.0 years still leaves the United States substantially behind peer nations: comparable high-income countries like Japan, Switzerland, Australia, and most of Northern Europe have life expectancies ranging from 82 to 85 years. The US gap with peer nations — historically persistent and rooted in healthcare system structure, gun violence, obesity rates, and drug overdose mortality — has not been closed by the pandemic-era recovery.
The 3.8% decline in the overall age-adjusted death rate in 2024 — among the largest single-year improvements in recent memory — was driven by improvements across all ten leading causes. The 14.4% drop in unintentional injury deaths (from 62.3 to 53.3 per 100,000) was the standout, reflecting the significant downward trend in overdose deaths that accelerated in 2023–2024 after years of crisis-level mortality. Suicide rates declined a modest 2.8% (from 14.1 to 13.7 per 100,000), representing only incremental progress in a cause that still takes nearly 50,000 American lives annually and ranks as the second leading cause of death for Americans aged 10–34. The age-specific death rate for 5–14 year olds was the only group that did not improve significantly in 2024 — remaining unchanged at 14.5 per 100,000 — a concerning signal in a group where mortality should be among the most preventable.
Disclaimer: The data research report we present here is based on information found from various sources. We are not liable for any financial loss, errors, or damages of any kind that may result from the use of the information herein. We acknowledge that though we try to report accurately, we cannot verify the absolute facts of everything that has been represented.