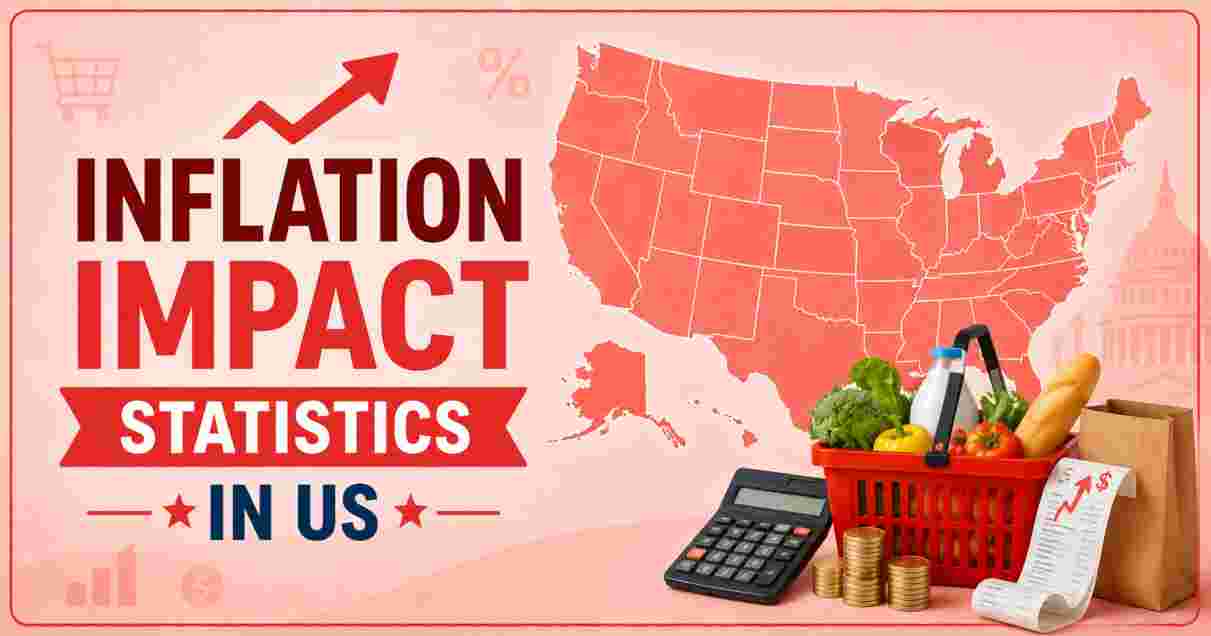
Inflation Impact in the US in 2026
Inflation’s impact in the United States in 2026 is being felt more broadly, more deeply, and in more places simultaneously than at almost any point since the post-pandemic price surge of 2021–2022. The Consumer Price Index rose 3.8% year-over-year in April 2026 — the highest annual rate since May 2023 and a full 1.4 percentage points above where it stood just two months earlier, when it looked like the inflation fight was finally being won. Before the late-February US-Israeli strikes on Iran began, the annual CPI inflation rate had eased all the way to 2.4%. That relative calm lasted less than two months. The Iran war triggered a massive oil price shock that sent gasoline up 28.4% annually, fuel oil up 54.3%, and diesel prices soaring 42% in a single month — and those energy shocks are now transmitting through every layer of the US economy, from the cost of trucking groceries to stores, to the price airlines charge for a ticket, to the margins wholesale distributors charge for the goods that fill American homes and businesses.
What makes inflation in 2026 qualitatively different from the Iran-war energy shock alone is the sustained underlying pressure that predated the conflict. The tariff regime introduced by President Trump approximately a year ago has been quietly embedding cost increases into trade service margins, apparel prices, household furnishings, and imported goods — creating a second, more structural inflation layer beneath the energy spike. When core CPI — which strips out food and energy entirely — still came in at +2.8% annually in April 2026, that is not an Iran war story. It is evidence of domestic cost pressure operating independently of geopolitical events. For American households, the combination is crushing: real average hourly wages fell 0.3% annually in April 2026 — the first time in three years that wages lost to inflation on an annual basis. Navy Federal Credit Union chief economist Heather Long described it plainly on May 12: “Inflation is eating up all wage gains. This is a setback for middle-class and lower-income households.” That is the lived reality behind every data point in this article.
Inflation Impact Statistics 2026 | Key Interesting Facts
  US Inflation Impact 2026 — Headline Numbers (as of May 14, 2026)
  ═════════════════════════════════════════════════════════════════

  CPI All Items YoY — April 2026 (released May 12, 2026)
  +3.8%  ████████████████████████████████████████  Highest since May 2023

  CPI before Iran war (Jan–Feb 2026):
  +2.4%  ████████████████████████  Easing trend — now reversed

  Energy CPI YoY — April 2026:
  +17.9% ████████████████████████████████████████████████████████████████

  Gasoline CPI YoY — April 2026:
  +28.4% ████████████████████████████████████████████████████████████████████████

  Food CPI YoY — April 2026:
  +3.2%  ████████████████████████████████████████

  Shelter CPI YoY — April 2026:
  +3.3%  ████████████████████████████████████████

  Real Wage Growth YoY — April 2026:
  −0.3%  ████  (negative — first time since April 2023)
| Interesting Fact | Data Point | Source |
|---|---|---|
| CPI all items — April 2026 (year-over-year) | +3.8% — the highest annual rate since May 2023; up from 3.3% in March | BLS CPI Summary April 2026, May 12, 2026 |
| CPI all items — April 2026 (month-over-month) | +0.6% seasonally adjusted; index level 333.020 (1982–84=100) | BLS USDL-26-0721, May 12, 2026 |
| CPI in January and February 2026 (pre-Iran war) | +2.4% YoY in both January and February — inflation had nearly reached the Fed’s target | BLS / Trading Economics, Jan–Feb 2026 |
| CPI — March 2026 (month Iran war shock hit CPI) | +3.3% YoY — a jump of 0.9 percentage points in a single month; largest MoM reading since June 2022 (+0.9%) | BLS / Trading Economics, Apr 10, 2026 |
| Energy CPI — April 2026 (year-over-year) | +17.9% — the steepest annual energy increase since September 2022; accounted for over 40% of the monthly headline increase | BLS / Trading Economics, May 12, 2026 |
| Gasoline CPI — April 2026 (year-over-year) | +28.4% — pump prices past $4 per gallon for the first time in over 3 years | BLS CPI / CNN, May 12, 2026 |
| Fuel oil CPI — April 2026 (year-over-year) | +54.3% — one of the most extreme single-component CPI readings in years | BLS / Trading Economics, May 12, 2026 |
| Gas prices before vs. after Iran war started | National average gasoline price climbed nearly 50% since the war with Iran started | Trading Economics / CNN, 2026 |
| Food CPI — April 2026 (year-over-year) | +3.2% — accelerating from +2.7% in March; food at home up +0.7% MoM (biggest monthly gain since August 2022) | BLS / US Inflation Calculator, May 12, 2026 |
| Beef prices — April 2026 (year-over-year) | +14.8% YoY — Mark Zandi: “for most families, what matters most is the cost of a gallon of gas and a pound of beef, and both are up quite a lot” | BLS CPI / CNBC, May 12, 2026 |
| Airline fares — April 2026 (year-over-year) | +20.7% YoY; rose +2.8% MoM in April; jet fuel costs passed directly to travelers | BLS CPI / CNBC, May 12, 2026 |
| Shelter CPI — April 2026 (year-over-year) | +3.3% — rose +0.6% MoM in April, double the pace of March; shelter is 32% of the total CPI basket | BLS / Trading Economics, May 12, 2026 |
| Core CPI — April 2026 (year-over-year) | +2.8% — highest since September 2025; well above the Fed’s 2% target | BLS / CNBC, May 12, 2026 |
| Real average hourly wages — April 2026 | −0.5% for the month; −0.3% annually — wages growing 3.6% but prices rising 3.8%; first negative real wage year-over-year since April 2023 | BLS / CNN, May 12, 2026 |
| CNN/SSRS poll — Americans blaming inflation on Trump | 77% of Americans — including a majority of Republicans — say Trump’s policies have increased the cost of living in their community | CNN/SSRS poll, May 12, 2026 |
| Consumer sentiment (2026) | All-time lows — sentiment has hit record lows even as the stock market remains resilient | CNBC / Northlight Asset Management, May 12, 2026 |
| Average household tariff-related annual cost burden | Congressional analyses put the average household’s annual tariff-related cost burden at more than $2,500 — a 44% increase from last year | 101Financial.com / Congressional analysis, May 2026 |
| Loan delinquency trends (Fed NY, released May 2026) | Federal Reserve Bank of New York data: increased rates of consumers becoming seriously delinquent on loans, especially student loans | FRBNY / CNN, May 12, 2026 |
| Beef and veal prices — full-year 2026 USDA forecast | Beef prices predicted to increase +6.3% for the full year 2026 (prediction interval: 0.1% to 13.1%) | USDA ERS Food Price Outlook, April 2026 |
| Apparel CPI — April 2026 (year-over-year) | +4.2% — tariff-sensitive category showing clear tariff-pass-through impact | BLS / Trading Economics, May 12, 2026 |
Source: BLS Consumer Price Index Summary April 2026 (USDL-26-0721, May 12, 2026); BLS CPI full PDF release (May 12, 2026); Trading Economics US Inflation Rate (May 12, 2026); CNBC CPI April 2026 analysis (May 12, 2026); CNN Business “US inflation rose to 3.8% in April” (May 12, 2026)
The facts table above captures a moment that is simultaneously a statistical event and a lived household reality. The 3.8% annual CPI rate in April 2026 is not just a number — it is the culmination of multiple pressures that had been building since late 2025 and detonated in full in the spring of 2026. What stands out most starkly is the speed of the reversal: in January and February 2026, with inflation at 2.4%, the Federal Reserve was beginning to discuss the conditions for rate cuts. By April, rate cut expectations had collapsed entirely and 39% odds of a rate hike by 2027 were being priced into prediction markets. That reversal happened in less than ten weeks. The mechanism was the Iran war energy shock, but the fuel it ignited was already there — in tariff-embedded cost pressures, in persistent shelter inflation, in stubborn services prices running at 3.3% annually — waiting for a catalyst.
The real wage data is the most personally significant statistic in the table for the average American household. When wages grow at 3.6% annually but prices rise 3.8%, every paycheck buys fractionally less than the last one. For a household earning $65,000 per year, a 0.2-percentage-point annual real wage loss translates to roughly $130 in lost purchasing power — not devastating in isolation, but compounding on top of the prior three years of above-target inflation that already eroded real incomes substantially. The households that feel this most sharply are not the wealthy — the CNN/SSRS poll finding that 77% of Americans, including a majority of Republicans, attribute rising living costs to Trump’s policies signals that this is not a partisan or ideological reading of the data. It is a bipartisan kitchen-table reality that is driving consumer sentiment to all-time lows even as Wall Street sits near its own all-time highs.
Inflation Impact Statistics 2026 | Grocery Prices — Food at Home & Restaurant Costs
  US Food Inflation by Category — April 2026 YoY (BLS CPI Data)
  ═══════════════════════════════════════════════════════════════

  Overall Food CPI (Apr 2026 YoY):     +3.2%  ████████████████████████████████████████
  Food at Home (Apr 2026 YoY):         varies  ████████████████████████████████████
  Beef and Veal (Apr 2026 YoY):        +14.8% ████████████████████████████████████████████████████████
  Airline Food / Away From Home:       +0.2% MoM  ████
  Meats, Poultry, Fish, Eggs (Apr MoM): +1.3%  █████████████████████████████████████████
  Beef (Apr 2026 MoM):                 +2.7%  ██████████████████████████████████████████████
  Food Away From Home (Feb 2026 YoY):  +3.9%  ████████████████████████████████████████████████
  Restaurant prices vs 2019:           +35%   ████████████████████████████████████████████████████████

  Egg prices (relative to spring 2025 peak):
  −30% since Trump took office  ████████████████████  (from extraordinary peak)
  −44.7% YoY (Mar 2026 vs Mar 2025)  ██████████████████  (vs spring 2025 high)
  But note: eggs still expensive vs. 2022–2023 baseline
| US Grocery & Food Inflation Metric (2026) | Data Point |
|---|---|
| Overall food CPI — April 2026 (YoY) | +3.2% — accelerated from +2.7% in March; +0.5% MoM in April (after flat March) |
| Food at home (groceries) — April 2026 MoM | +0.7% — the biggest monthly grocery price gain since August 2022; five of six major grocery store food groups increased |
| Meats, poultry, fish, and eggs — April 2026 MoM | +1.3% for the category overall |
| Beef — April 2026 MoM | +2.7% in a single month |
| Beef and veal — April 2026 YoY | +14.8% year-over-year — one of the most widely cited grocery price increases |
| Beef and veal — March 2026 YoY | +12.1% year-over-year in March; up from February despite a small MoM dip |
| Wholesale beef prices — March 2026 YoY | +19.7% year-over-year — wholesale prices signal further retail pressure ahead |
| Beef — full-year 2026 USDA forecast | Predicted to increase +6.3% for all of 2026; farm-level cattle prices up +7.5% forecast |
| Egg prices — vs. spring 2025 peak | Down 30% since Trump took office; down 44.7% YoY in March 2026 vs. spring 2025 peak |
| Egg prices — BLS February 2026 reading | +10.4% in a single month (February); eggs remain elevated vs. pre-2024 baselines |
| Food away from home — February 2026 YoY | +3.9% — full service meals and snacks up +4.6%; limited service up +3.2% |
| Restaurant prices — cumulative increase vs. 2019 | Up 35% cumulatively since 2019 — and that’s before the tip |
| Nonalcoholic beverages — full-year 2025 (context) | +5.1% in 2025 including +11.8% for coffee and tea — a continuing pain point |
| Pork — March 2026 YoY | +0.5% year-over-year; moderate increase; pork predicted +0.4% full year 2026 |
| Poultry — March 2026 YoY | +1.5% year-over-year; moderate increase; poultry predicted +0.7% full year 2026 |
| Fruits and vegetables — February 2026 YoY | +2.7% over the year ended February 2026 |
| Cereals and bakery products — February 2026 YoY | +2.7% year-over-year |
| Nonalcoholic beverages — February 2026 YoY | +5.6% year-over-year — includes coffee, juice, tea |
| Average household annual tariff grocery cost burden | Congressional analyses: tariff-related cost burden exceeds $2,500 per household — equivalent to one month’s rent in many US cities |
Source: BLS Consumer Price Index April 2026 (USDL-26-0721, May 12, 2026); BLS Economics Daily “Consumer prices up 2.4 percent over year ended February 2026” (March 19, 2026); BLS “Consumer Price Index: 2025 in review” (January 2026); USDA ERS Food Price Outlook Summary Findings (April 2026); NBC News Grocery Price Tracker (updated May 4, 2026); Bloomberg “Why Americans Feel Squeezed by the Cost of Living” (February 18, 2026); US Inflation Calculator Food Inflation (May 12, 2026); 101Financial.com (May 2026)
The grocery inflation picture in 2026 is one of sustained, multi-front pressure on the household food budget that has no single easy explanation and no quick fix. Beef dominates the headline — a 14.8% annual price increase by April 2026, driven by a structural contraction in the US cattle herd that began years ago and that no tariff adjustment or Iran ceasefire can quickly reverse. The USDA’s own forecast of a +6.3% beef price increase for the full year 2026 means the category will remain painful all year regardless of what happens in the Middle East. Wholesale beef prices running at +19.7% year-over-year in March signal that the retail price increases already registered are not the end of the story — the pipeline still carries more cost inflation yet to reach the supermarket shelf. The consumer standing at the meat counter in 2026, doing mental arithmetic on a family’s weekly budget, is navigating a market where the most protein-dense, culturally central food in the American diet has become meaningfully unaffordable for a growing share of households.
The egg price story in 2026 is a genuine exception to the otherwise relentless upward trajectory of grocery costs — but requires careful interpretation. While eggs are 44.7% cheaper year-over-year in March 2026 compared to the extraordinary spring 2025 peak driven by avian influenza, they are not cheap by any historical measure. The February 2026 reading of a +10.4% single-month increase confirms that the egg market remains volatile and subject to rapid reversals. Restaurant inflation compounds the grocery story: with prices at eating establishments up 35% cumulatively since 2019, Americans who try to substitute restaurant meals for home cooking to manage time pressure find themselves in an even more expensive environment. The pattern that emerges from this data — beef up 14.8%, airline food up 20.7%, coffee persistent, eggs recovering but fragile — is of a food economy where the items that most directly affect daily lived experience are precisely the ones where inflation has been most stubborn.
Inflation Impact Statistics 2026 | Shelter, Rent & Housing Bills
  US Shelter & Housing Cost Inflation — 2026 (CPI Data)
  ══════════════════════════════════════════════════════

  Shelter CPI (Apr 2026 YoY):       +3.3%  ████████████████████████████████████████████
  Shelter CPI (Apr 2026 MoM):       +0.6%  ████████████████████████████████  (double March pace)
  Shelter CPI (Mar 2026 YoY):       +3.0%  ████████████████████████████████████████
  Shelter CPI (Jan–Feb 2026 YoY):   +3.0%  ████████████████████████████████████████

  Shelter's weight in CPI basket:   32%    ████████████████████████████████████████████████████████████████
  (Largest single component of total CPI — 32 cents of every "inflation dollar")

  Natural gas prices (Feb 2026 YoY):    +10.9%   ████████████████████████████████████████████████████████
  Electricity prices (Feb 2026 YoY):    +4.8%    ████████████████████████████████████████████████
  Energy services (Feb 2026 YoY):       +6.3%    ████████████████████████████████████████████████████
  Household furnishings (Apr 2026 MoM): +0.7%    ████████████████████████████████
| Shelter, Rent & Utility Bill Inflation Metric (2026) | Data Point |
|---|---|
| Shelter CPI — April 2026 (YoY) | +3.3% — accelerated from +3.0% in the prior three months; shelter is the largest single component of CPI at 32% weight |
| Shelter CPI — April 2026 (MoM) | +0.6% — double the pace notched in March; the BLS noted this sharp jump was partly driven by a statistical rebase following the October 2025 federal shutdown |
| October 2025 shutdown statistical artifact | BLS was unable to fully collect rent data in Oct 2025 during the federal shutdown, artificially suppressing shelter CPI in late 2025; the April 2026 reading includes a catch-up effect, per CNN / Pantheon Macroeconomics |
| Shelter inflation trajectory (Jan–Mar 2026) | Held steady at +3.0% YoY for January, February, and March before jumping to +3.3% in April |
| Services less energy services — April 2026 (YoY) | +3.3% — reflects persistent structural inflation in the largest CPI category |
| Transportation services — April 2026 (YoY) | +4.3% — fuel costs flowing through to logistics, trucking, and public transit costs |
| Natural gas service — February 2026 (YoY) | +10.9% — the sharpest annual gain in energy services; directly hitting home heating bills |
| Electricity prices — February 2026 (YoY) | +4.8% — adding meaningfully to monthly household utility costs |
| Energy services total — February 2026 (YoY) | +6.3% — the combined natural gas + electricity cost surge affecting every American household with utility bills |
| Household furnishings — April 2026 (MoM) | +0.7% — tariff-sensitive category rising in April; “tariffs also seemed to hit other areas” |
| Medical care services — February 2026 (YoY) | +4.1% — healthcare cost inflation running well above headline CPI |
| Medical care services — April 2026 (MoM) | −0.1% — a modest monthly dip; hospital services down 0.3% and health insurance down 0.4% |
| Motor vehicle insurance — April 2026 (MoM) | +0.1% — continuing to add to household bills; insurance costs have run persistently high through 2025–2026 |
| Apparel — April 2026 (YoY) | +4.2% — tariff pass-through visible; up from +3.4% in March |
| Personal care — February 2026 (YoY) | +4.5% — toiletries, personal hygiene products among the consistently elevated categories |
| Household furnishings — February 2026 (YoY) | +3.9% — a category that has run elevated throughout 2025–2026 |
| Used cars and trucks — April 2026 (YoY) | −2.7% — one of the few major categories declining annually; provides modest budget relief |
| New vehicles — April 2026 (MoM) | −0.2% — modest monthly decline; auto markets softer even as other categories press higher |
Source: BLS Consumer Price Index April 2026 (USDL-26-0721, May 12, 2026); BLS Consumer Price Index Summary PDF (May 12, 2026); BLS Economics Daily “Consumer prices up 2.4 percent over year ended February 2026” (March 19, 2026); Trading Economics US Core Inflation Rate (May 12, 2026); CNN Business CPI April 2026 (May 12, 2026); CNBC CPI April 2026 (May 12, 2026); Oliver Allen, Pantheon Macroeconomics via CNN (May 12, 2026)
The shelter and bills inflation data for 2026 illuminates why so many Americans report feeling financially squeezed even in months when the headline inflation number appeared to moderate. Shelter — at 32% of the total CPI basket, the single largest component — has been running at +3.0% to +3.3% annually for months, and the April 2026 jump to +0.6% in a single month signals that rent and housing costs are not yet following the broader disinflation narrative that many economists had hoped for. With the October 2025 federal shutdown having artificially suppressed shelter CPI readings in late 2025 — because BLS could not fully collect rent survey data — the April 2026 acceleration carries a statistical rebase component. But even stripping out that artifact, the underlying shelter inflation trend shows no credible sign of returning to the sub-2% rates needed to stop compounding the multi-year affordability crisis in American housing.
The utility bills data adds a further dimension that often gets lost in CPI headline discussions. Natural gas prices rising 10.9% and electricity up 4.8% in the year to February 2026 are not abstract energy transition statistics — they are the monthly bills that land in every American household. For a family spending $200 per month on electricity and $120 on natural gas, a combined 6.3% energy services inflation rate adds roughly $19 per month or $228 per year in bill cost without using a single additional unit of energy. Compounding that with the +4.1% medical care services inflation, +4.5% personal care, and +4.2% apparel visible in the data, and the picture that emerges is of a household budget where almost nothing is getting cheaper except used cars and trucks. The categories declining — used vehicles, medical care month-to-month, hospital services — are not the items most households spend their daily dollars on. The categories rising — shelter, food, energy, transportation, apparel — are exactly the unavoidable ones.
Inflation Impact Statistics 2026 | Energy Bills, Gasoline & the Iran War Effect
  US Energy Inflation — CPI Component Breakdown (2026)
  ══════════════════════════════════════════════════════

  Overall Energy CPI (Apr 2026 YoY):    +17.9%  ████████████████████████████████████████████████████████
                                        (Steepest since Sep 2022)

  Gasoline (Apr 2026 YoY):              +28.4%  ████████████████████████████████████████████████████████████████████████
  Fuel Oil (Apr 2026 YoY):              +54.3%  ████████████████████████████████████████████████████████████████████████████████████████████████
  Natural gas service (Feb 2026 YoY):   +10.9%  ████████████████████████████████████████████████████████

  Gasoline price spike since Iran war started:
  +~50% from late-Feb 2026 baseline     ████████████████████████████████████████████████████████████████████████████████

  Gas price benchmarks:
  Late Feb 2026 (pre-war):   ~$2.75/gallon  ██████████████
  April/May 2026 (peak):     $4.00+/gallon  ████████████████████████████████████████████████████

  Fed rate: 3.5%–3.75% — held steady; rate hike probability by 2027: ~39% (Kalshi)
| Energy Bills, Gasoline & Iran War Impact (2026) | Data Point |
|---|---|
| Energy CPI — April 2026 (YoY) | +17.9% — the steepest annual energy increase since September 2022; up from +12.5% in March |
| Energy CPI — April 2026 contribution to headline | Energy accounted for over 40% of the monthly all-items CPI increase in April |
| Gasoline — April 2026 (YoY) | +28.4% — the dominant energy sub-component; pump prices above $4 per gallon nationally |
| Gasoline — March 2026 (YoY) | +18.9% — already elevated one month earlier; +21.2% MoM in March was the immediate Iran war shock |
| Fuel oil — April 2026 (YoY) | +54.3% — the most extreme YoY reading among major consumer energy components |
| Fuel oil — March 2026 (YoY) | +44.2% — already at crisis-level annual increase one month before April’s report |
| National average gas price — trajectory | Climbed nearly 50% since the US-Israeli strikes on Iran began in late February 2026 |
| Gas price — before vs. after Iran war | Crossed $4 per gallon for the first time in more than 3 years |
| Iran war start date | Late February 2026 — US-Israeli strikes on Iran triggered the energy price shock now flowing through the entire US economy |
| Ceasefire uncertainty timeline (optimistic) | Even if resolved “within weeks,” economists estimate two months for supply chains to normalize (optimistic scenario) |
| Ceasefire uncertainty timeline (pessimistic) | Pessimistic scenario: six to nine months to return to pre-war energy price levels |
| PPI energy (April 2026) — wholesale level | PPI final demand energy: +7.8% in a single month in April at the wholesale level; gasoline PPI +15.6% MoM |
| Diesel fuel — March 2026 PPI | +42.0% in a single month at the producer level — the most extreme fuel cost spike in years |
| Jet fuel — March 2026 PPI | +30.7% in a single month — directly passed through to airline fares (+20.7% YoY in CPI) |
| Federal Reserve rate — May 2026 | Anchored at 3.5%–3.75%; four dissents at late-April meeting — most since 1992 |
| Rate hike odds — Kalshi prediction market (May 13, 2026) | Odds of a Fed rate hike before 2027 climbed to ~39% following the April PPI report |
| Atlanta Fed GDPNow Q2 2026 estimate | +3.7% economic growth in Q2 — economy holding despite inflation shock; growth largely driven by higher-income earners |
| “Double squeeze” consumer diagnosis | Bankrate financial analyst Stephen Kates: “Consumers are currently trapped in a ‘double squeeze,’ wrestling with both the acute pain of the gasoline price spike and the slow rise in other core budget items” |
Source: BLS Consumer Price Index April 2026 (USDL-26-0721, May 12, 2026); BLS Consumer Price Index March 2026 (April 10, 2026); BLS Producer Price Indexes April 2026 (May 13, 2026); BLS Producer Price Indexes March 2026 (April 14, 2026); Trading Economics US Inflation Rate (May 12, 2026); CNN Business CPI April 2026 (May 12, 2026); CNBC CPI inflation breakdown April 2026 chart (May 12, 2026); Atlanta Fed GDPNow Q2 2026; Kalshi prediction market via CNBC (May 13, 2026)
The energy price data is the most visceral component of the 2026 inflation story because it is the one most impossible to avoid. You can delay replacing a household appliance, choose a cheaper cut of beef, or hold off on a clothing purchase — but most Americans cannot stop driving to work, heating their homes, or buying the groceries that arrived on a diesel-fueled truck. The +17.9% annual energy CPI in April 2026 is not just an economic statistic; it is the reason every trip to the gas station in the spring of 2026 produces a moment of sticker shock. The trajectory from pre-war gasoline prices of around $2.75 per gallon to a national average above $4.00 — a nearly 50% increase — is one of the most rapid energy price shocks the US consumer economy has experienced since the 2008 oil crisis.
The duration uncertainty makes this energy shock particularly damaging for household financial planning. Craig Bethune’s assessment — that even an optimistic resolution within weeks still means two months before supply chains normalize, while a pessimistic scenario stretches to six to nine months — means American households cannot count on energy price relief before the end of summer 2026 at the earliest. That timeline has profound downstream consequences: airline fares at +20.7% annually show that jet fuel costs are already fully passed through to travelers. Trucking and logistics margins are under pressure from diesel at crisis levels. The wholesale energy price signal — with gasoline PPI up 15.6% in a single month and diesel up 42% — confirms that the retail price pain already registered in the CPI has a further pipeline of cost pressure still moving toward consumers. For a Federal Reserve that has already held rates steady through eight months of misgivings, and is now watching 39% of prediction market participants price in a hike before 2027, the energy-driven inflation data makes every upcoming policy decision more consequential than the last.
Disclaimer: The data research report we present here is based on information found from various sources. We are not liable for any financial loss, errors, or damages of any kind that may result from the use of the information herein. We acknowledge that though we try to report accurately, we cannot verify the absolute facts of everything that has been represented.