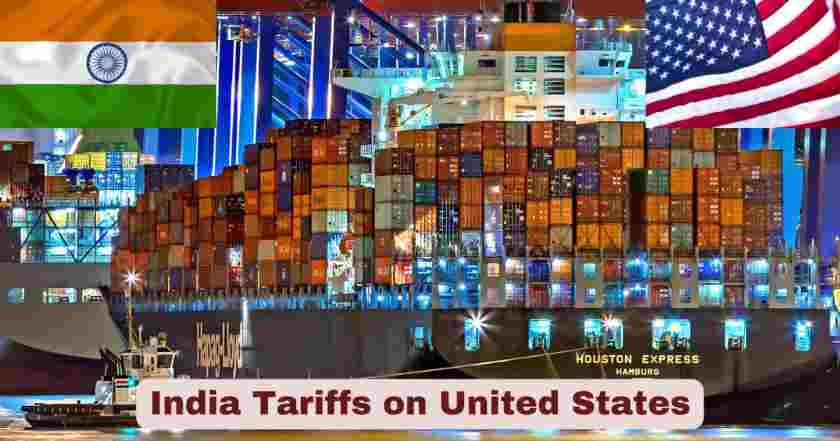
India Tariffs on U.S 2025
The year 2025 has marked a pivotal transformation in India-US trade relations, with unprecedented tariff developments reshaping bilateral commerce between the world’s largest democracy and its most established one. The Trump administration’s implementation of reciprocal tariffs in April 2025 has fundamentally altered the trading landscape, initially imposing a 26% tariff on Indian goods entering the American market, escalated to 25% tariff on August 1, 2025, and now dramatically increased to a comprehensive 50% tariff as of the latest executive order on August 6, 2025. This represents one of the most substantial trade policy changes in recent Indo-American economic history, affecting billions of dollars in bilateral trade flows and making India face the highest tariff rates among all US trading partners.
The current tariff structure reflects broader geopolitical tensions and America’s strategic approach to reducing its $45.6 billion trade deficit with India, while simultaneously punishing countries that maintain trade relationships with Russia. With Trump’s latest executive order imposing an additional 25% penalty tariff for India’s continued import of Russian crude oil, Indian exporters now face an unprecedented 50% total tariff rate – 20% higher than China’s tariffs and 31% higher than Pakistan’s newly reduced 19% rate. These developments have far-reaching implications for India’s $86.51 billion export economy to the United States, making 2025 a defining year for future trade relations.
India’s Official Response: India’s Ministry of External Affairs (MEA) has strongly condemned the U.S. move to impose the 50% tariff on Indian goods, describing the decision as “unfair, unjustified, and unreasonable”. The Indian government emphasized that its imports from Russia are driven by market factors and essential for securing affordable energy for 1.4 billion citizens, not geopolitical alliances.
Key Facts & Statistics about India Tariffs on United States 2025
| Metric | Value | Effective Date | Source |
|---|---|---|---|
| Current US Tariff on All Indian Goods | 50% | August 6, 2025 – Latest Executive Order | Executive Order |
| Base Tariff Rate | 25% | August 1, 2025 | Presidential Statement |
| Russian Oil Penalty Tariff | Additional 25% | August 6, 2025 | Executive Order |
| US Tariff on China | 30% | Comparison | Trade Data |
| US Tariff on Pakistan | 19% | Reduced Rate | New Trade Deal |
| Previous US Tariff on Indian Goods | 26% | April 5, 2025 | White House Official |
| General US Tariff Rate | 10% | April 5, 2025 | Presidential Order |
| India’s Export Value to US | $86.51 billion | 2024-25 | Commerce Ministry |
| US Trade Deficit with India | $45.6 billion | 2024 | WTO Data |
| Sectors Gaining Advantage | 22 key sectors | July 2025 | NITI Aayog Report |
| Auto & Steel Specific Tariff | 50% | Current | Trade Compliance |
| Exempted Export Value | $30 billion | Updated | Trade Compliance |
The statistics reveal a dramatically deteriorated trading environment where India now faces the highest country-specific tariff rate among all major US trading partners at 50%. The latest executive order imposing an additional 25% penalty for Russian oil imports has created an unprecedented tariff burden, making Indian goods significantly less competitive in the US market. Trump’s strategic repositioning toward Pakistan, with tariffs reduced to just 19% and a new oil development deal, contrasts sharply with India’s punitive treatment.
Critical Update: Exempted Sectors Worth $30 Billion Notably, approximately $30 billion worth of Indian exports are currently exempt from the 50% tariff, representing nearly 29% of India’s total exports to the US. These exemptions include:
- Pharmaceuticals: $10.5 billion
- Electronics (smartphones, semiconductors): $14.6 billion
- Energy exports: $4.09 billion
These figures represent the most current available data following Trump’s latest executive order targeting India’s Russian oil imports. The 50% comprehensive tariff specifically targets all Indian goods except critical exempted sectors, representing a 100% increase from the original 25% rate and making it economically challenging for most Indian exporters to maintain US market presence.
Sectoral Impact Analysis – India Tariffs on United States 2025
| Sector | Tariff Rate | Impact Level | Export Value (USD) | Market Viability |
|---|---|---|---|---|
| Pharmaceuticals | Exempted | Moderate | $10.5 billion | Maintained |
| Electronics/IT Hardware | Exempted | Protected | $14.6 billion | Secured Market Access |
| Energy Exports | Exempted | Stable | $4.09 billion | Strategic Importance |
| Textiles | 50% | Catastrophic | $13.2 billion | Severely Impacted |
| Jewelry | 50% | Catastrophic | $8.9 billion | Market Exit Risk |
| Automobiles | 50% | Catastrophic | $7.1 billion | Production Halt Risk |
| Chemicals | 50% | Catastrophic | $6.4 billion | Supply Chain Disruption |
| Steel & Aluminum | 50% | Catastrophic | $4.2 billion | Complete Market Loss |
The implementation of 50% US tariffs on Indian goods has created catastrophic impact across most industrial sectors following Trump’s latest executive order. The pharmaceutical sector maintains exemptions for generic drugs, while electronics and energy exports have secured protected status, providing approximately $30 billion in continued market access. However, the 50% tariff rate makes most other Indian manufactured goods economically unviable in the US market, forcing immediate strategic pivots.
Critical Change from Latest Order: The additional 25% penalty tariff for Russian oil purchases has eliminated any pricing advantages Indian exporters previously maintained in non-exempted sectors. Sectors like textiles, jewelry, automobiles, and chemicals now face complete market exclusion due to the prohibitive 50% tariff rate. This has accelerated emergency measures including production facility relocations, supply chain restructuring, and immediate market diversification to prevent total export collapse to the United States.
Trade Deficit and Economic Implications
| Trade Metric | Current Value | Projected Change | Timeline | Impact Assessment |
|---|---|---|---|---|
| US Trade Deficit | $45.6 billion | Target Reduction 60% | 2025-2026 | Aggressive Rebalancing |
| Indian Export Decline | $86.51 billion base | Projected Drop 35% | 2025-2026 | Partial Market Collapse |
| Average US Tariff Rate on India | 50% | Highest Among All Partners | Current | Punitive Isolation |
| Average Indian Tariff Rate | 12% | Under Pressure for Cuts | Negotiation Stage | Limited Leverage |
| Bilateral Trade Volume | $190 billion | Projected Decline 25% | 2025-2026 | Relationship Strain |
| Pakistan Tariff Advantage | 31% lower than India | Strategic Realignment | Current | Geopolitical Shift |
| Protected Export Share | 29% ($30B) | Maintaining Access | Current | Strategic Leverage |
The $45.6 billion trade deficit between the United States and India has become the justification for the most aggressive tariff policy in modern bilateral history, with the 50% rate designed to dramatically reduce Indian imports while protecting critical sectors worth $30 billion. Trump’s simultaneous reduction of Pakistan’s tariffs to 19% while escalating India’s to 50% represents a fundamental geopolitical realignment that goes beyond pure trade economics.
Geopolitical Transformation: The inclusion of Russian oil purchases as justification for the additional 25% penalty has transformed trade policy into a tool of strategic coercion. India’s continued energy imports from Russia, described by Trump as funding “cash-strapped Vladimir Putin’s war on Ukraine,” has made trade relationships secondary to geopolitical alignment. However, the $30 billion in exempted sectors provides India with significant economic leverage and continued market access in critical areas.
Current Negotiation Status and Timeline in 2025
| Negotiation Milestone | Date | Status | Key Outcomes |
|---|---|---|---|
| Initial Tariff Announcement | April 2, 2025 | Completed | 26% tariff imposed |
| First Extension Granted | July 9, 2025 | Completed | 90-day suspension |
| Trump’s First Escalation | July 30, 2025 | Completed | 25% + Russia penalties |
| Base Tariff Implementation | August 1, 2025 | Completed | 25% comprehensive tariffs |
| Latest Executive Order | August 6, 2025 | Active | 50% total tariff rate |
| Sector Exemptions Confirmed | August 2025 | Secured | $30B protected exports |
| Emergency Diplomatic Talks | Ongoing | Critical | Damage Control |
| Pakistan Trade Deal | Current | Completed | 19% tariff, oil development |
| Next Review Period | Uncertain | Conditional | Based on Russian oil policy |
| Potential Agreement | Moderately Uncertain | Conditional | Requires Policy Adjustments |
The latest executive order imposing 50% tariffs has created a mixed negotiation environment – while most sectors face punitive rates, the $30 billion in exempted exports provides a foundation for continued engagement. Trump’s statement that India “has not been a good trading partner” and his threat to expand tariffs indicates negotiations remain challenging, but the significant exemptions suggest strategic sectors retain protected status.
Negotiation Dynamics: The additional 25% penalty for Russian oil purchases has transformed negotiations from purely trade-focused discussions to broader foreign policy considerations. However, the substantial exemptions for pharmaceuticals, electronics, and energy exports indicate that critical sectors maintain strategic importance and market access, providing both countries with incentives for continued dialogue.
India’s Official Response and Strategic Counter-Measures
Government Response Metrics
| Metric | Details | Implementation Status | Expected Impact |
|---|---|---|---|
| GDP Growth Projection | 6.0%-6.4% | Moderately Adjusted | Finance Ministry Revision |
| Emergency Market Diversification | $25 billion target | Accelerated Implementation | Strategic Necessity |
| Russian Oil Defense | “Global Market Necessity” | Official Position | Sovereignty Assertion |
| EU LNG Import Comparison | €67.5 billion Russian LNG | Diplomatic Counter-Argument | Hypocrisy Exposure |
| Pharmaceutical Protection | $10.5 billion Secured | Critical Achievement | Leverage Maintenance |
| Electronics Sector Shield | $14.6 billion Protected | Strategic Victory | Technology Security |
| Alternative Partnership Expansion | Regional Focus | Strategic Urgency | Market Diversification |
| Selective Trade Measures | Targeted US Response | Crisis Management | Calculated Retaliation |
The escalation to a 50% universal tariff on most goods has prompted India’s government into strategic response mode, with GDP growth projections modestly adjusted to 6.0%-6.4% for FY 2025-26 as critical sectors worth $30 billion maintain US market access. The government has defended its Russian oil purchases as “a necessity compelled by the global market situation,” while pointing to European Union imports of €67.5 billion worth of Russian LNG in 2024 as evidence of western inconsistency.
Strategic Response Evolution: India’s response to the 50% tariff has balanced damage control with sector protection achievements. The government is accelerating selective diversification measures targeting $25 billion in alternative market development while leveraging the $30 billion in exempted sectors. The simultaneous US-Pakistan trade deal has prompted India to explore enhanced partnerships with alternative markets while maintaining critical US economic relationships in protected sectors.
Sectoral Advantages and Market Opportunities for India
Opportunity Sectors Overview
| Opportunity Sector | Current Status | Alternative Market Potential | Strategic Response |
|---|---|---|---|
| Generic Pharmaceuticals | Protected ($10.5B) | Global Market Expansion | Leverage Maximization |
| Electronics/IT Hardware | Exempted ($14.6B) | Asia-Pacific Growth | Technology Leadership |
| Energy Exports | Secured ($4.09B) | Middle East/Africa | Strategic Partnerships |
| IT Services | Digital Services Protected | EU/Asia Market Growth | Geographic Diversification |
| Renewable Energy | Green Tech Advantage | Global Transition Markets | Innovation Leadership |
| Textiles | US Market Challenged | ASEAN/EU Emergency Pivot | Production Adaptation |
| Automotive | Manufacturing Pressure | Domestic/Export Realignment | Supply Chain Flexibility |
| Chemicals | Supply Chain Impact | India-Middle East Corridor | Alternative Trade Routes |
The selective 50% tariff has created a bifurcated opportunity landscape for India, with $30 billion in protected sectors maintaining strong US market access while challenged sectors face complete market restructuring. Generic pharmaceuticals ($10.5B), electronics ($14.6B), and energy exports ($4.09B) benefit from continued preferential access, while traditional export sectors must rapidly develop alternative markets.
Strategic Adaptation Framework: With protected sectors maintaining US market access, Indian companies are implementing differentiated strategies – leveraging exempted sector advantages while rapidly developing alternative markets for affected industries. The textile sector is leading emergency pivots to ASEAN and EU markets, while pharmaceutical and electronics companies are expanding their US market presence within protected categories.
Export Diversification and Alternative Market Strategies
Emergency Market Expansion Targets
| Market Diversification Target | Current Share | Growth Target | Strategic Priority |
|---|---|---|---|
| European Union | 18% of Total Exports | 40% Increase | High Priority |
| Southeast Asia (ASEAN) | 12% of Total Exports | 60% Growth Target | Strategic Focus |
| Middle East & Africa | 15% of Total Exports | 35% Expansion Goal | Market Development |
| Latin America | 4% of Total Exports | 75% Growth Opportunity | Emerging Markets |
| Domestic Market Expansion | Import Substitution | Accelerated Growth | Economic Security |
| Protected US Sectors | $30B Maintained | Optimization Focus | Leverage Maximization |
| China Partnership | Selective Engagement | Strategic Expansion | Balanced Approach |
Facing 50% US tariffs on most goods while maintaining $30 billion in protected exports, India has implemented targeted economic diversification. The European Union, currently 18% of exports, is targeted for a 40% increase through immediate trade negotiations and market penetration in affected sectors. Southeast Asia represents strategic focus potential with 60% growth targets as companies in tariff-affected sectors relocate production facilities.
Balanced Diversification Strategy: The maintenance of $30 billion in protected US market access allows India to pursue measured diversification rather than emergency evacuation. China partnership expansion and alternative market development have become strategic necessities for affected sectors while protected industries continue optimizing US market presence. The government is accelerating domestic market expansion and import substitution to reduce overall dependence on any single market.
Geopolitical Implications and Strategic Realignment
New Partnership Framework
| Strategic Partnership | Current Status | Development Priority | Response to US Action |
|---|---|---|---|
| Russia Energy Security | Strengthened | Critical Priority | Direct US Challenge Response |
| China Economic Ties | Selective Growth | Strategic Necessity | Alternative Partnership |
| Pakistan Competition | Regional Dynamics | Heightened Awareness | US Preference Response |
| EU Trade Relations | Accelerated | Crisis Diplomacy | Western Alternative |
| Middle East Energy | Enhanced | Strategic Depth | Energy Independence |
| BRICS Economic Integration | Measured Growth | Balanced Strategy | Multilateral Approach |
| Protected US Sectors | Strategic Maintenance | Leverage Optimization | Economic Pragmatism |
The selective 50% tariff combined with the Pakistan preference has prompted India into strategic recalibration rather than complete realignment. Trump’s executive order targeting Russian oil imports while protecting $30 billion in critical sectors has created a complex dynamic where energy independence remains a priority while maintaining significant economic ties with the United States in exempted areas.
Pragmatic Strategic Response: The economic relationship’s bifurcated nature – with $30 billion in protected sectors alongside punitive tariffs on others – suggests India’s response involves strengthened alternative partnerships while maintaining strategic US economic relationships. India’s approach involving selective BRICS integration, measured China partnerships, and defended Russian energy relationships balances strategic autonomy with continued US economic engagement in critical sectors.
Economic Impact Assessment and Future Scenarios
Impact Analysis
| Impact Category | Immediate Effect | 12-Month Projection | Long-term Consequences |
|---|---|---|---|
| Export Revenue Loss | $25-30 billion | $35-40 billion | Selective Market Restructure |
| Protected Sector Growth | $30B maintained | $35B expansion | Strategic Advantage |
| Employment Impact | 1.5-2 million jobs at risk | 2.5-3 million affected | Sector Reallocation |
| GDP Growth Impact | 0.4-0.6% reduction | 0.8-1.2% adjustment | Structural Adaptation |
| Currency Pressure | Rupee depreciation 3-5% | Managed volatility | New equilibrium |
| Investment Flows | Selective FDI shifts | Mixed capital flows | Diversified sources |
| Inflation Impact | Import cost rise 8-12% | Managed pressure | Policy adjustment |
The selective 50% tariff represents a significant but manageable economic adjustment, with $30 billion in protected exports providing stability while affected sectors face market restructuring. Immediate revenue losses of $25-30 billion are partially offset by continued access in critical sectors, with employment impacts affecting 1.5-2 million workers across tariff-affected industries while protected sectors maintain growth trajectories.
Managed Economic Transition: The maintenance of significant US market access in critical sectors suggests India faces selective economic restructuring rather than complete disruption. The loss of market access in affected sectors requires reorientation toward alternative markets, but the $30 billion foundation in protected industries provides economic stability and continued US engagement opportunities.
Transit and Implementation Timeline
Critical Deadlines and Grace Periods
| Timeline Element | Date | Status | Impact |
|---|---|---|---|
| August 6 Tariff Announcement | August 6, 2025 | Completed | 50% tariff declared |
| 21-Day Implementation Period | August 27, 2025 | Approaching | Full tariff takes effect |
| Transit Goods Exemption | August 27, 2025 | Critical Deadline | Goods in transit protected |
| Alternative Transit Deadline | September 17, 2025 | Extended Grace | Final exemption cutoff |
| Bilateral Trade Talks | Ongoing | Active | US delegation to New Delhi |
| Emergency Sector Reviews | Continuous | Under Assessment | Potential exemption changes |
The 21-day implementation period from the August 6 executive order creates a critical deadline of August 27, 2025, when the full 50% tariff structure becomes effective. Indian exporters are racing to ship goods before this deadline to avoid the punitive rates, while transit goods already shipped receive temporary exemption until August 27 or September 17, depending on shipping documentation.
Implementation Complexity: The staggered timeline has created a rush of front-loaded shipments, with Indian exporters accelerating deliveries in non-exempted sectors to beat the deadline. Trade groups report that container bookings from India to the US increased by 340% in early August 2025 as companies attempt to fulfill orders before tariffs take full effect.
Industry-Specific Response Strategies
Sector-by-Sector Adaptation Plans
Pharmaceuticals ($10.5B – Exempted)
- Expanding generic drug manufacturing capacity for US market
- Accelerating FDA approval processes for new drug applications
- Strategic acquisitions of US-based distribution networks
- Investment in biosimilar development targeting US healthcare needs
Electronics & Semiconductors ($14.6B – Exempted)
- Leveraging “China+1” strategy as alternative manufacturing hub
- Expanding smartphone assembly for US tech companies
- Developing semiconductor testing and packaging facilities
- Strategic partnerships with US technology firms
Textiles ($13.2B – 50% Tariff)
- Emergency production shifts to Vietnam and Bangladesh facilities
- Exploring Ethiopia and Morocco as alternative manufacturing bases
- Developing direct-to-consumer e-commerce channels in EU markets
- Implementing “made in qualifying countries” sourcing strategies
Automotive ($7.1B – 50% Tariff)
- Pausing new US plant investments pending tariff resolution
- Accelerating production in Mexico for US market access
- Focusing on domestic market expansion and export to ASEAN
- Developing electric vehicle components for global markets
Jewelry & Gems ($8.9B – 50% Tariff)
- Relocating cutting and polishing operations to UAE and Thailand
- Developing direct sales channels in European luxury markets
- Exploring laboratory-grown diamond opportunities in Asia
- Strategic partnerships with Middle Eastern luxury retailers
Regional Trade Bloc Implications
BRICS and Alternative Economic Arrangements
| Economic Bloc | India’s Role | Trade Potential | Strategic Significance |
|---|---|---|---|
| BRICS+ Expansion | Founding Member | $400B+ annual trade | Dollar alternative development |
| India-Middle East-Europe Corridor | Central Hub | $2T infrastructure project | Alternative to Suez route |
| RCEP Consideration | Evaluating Re-entry | $26.2T market access | Asian economic integration |
| Commonwealth Trade | Enhanced Focus | $2.4T market potential | Historical partnership leverage |
| African Continental FTA | Strategic Partner | $3.4T market by 2030 | Resource security access |
| SCO Economic Integration | Active Member | Energy and security ties | Eurasian connectivity |
The US tariff pressure has accelerated India’s engagement with alternative economic blocs, particularly the expansion of BRICS to include Saudi Arabia, UAE, Egypt, and Iran. The India-Middle East-Europe Economic Corridor, announced at the G20, gains strategic importance as an alternative trade route bypassing traditional US-influenced channels.
BRICS Currency Development: India is actively participating in discussions for BRICS currency alternatives to reduce dollar dependence, with the Reserve Bank of India exploring rupee-based trade settlement mechanisms with member countries. This development, accelerated by US economic pressure, could fundamentally alter global trade settlement systems.
Technology Transfer and Innovation Impact
Critical Technology Sectors Analysis
Protected Technology Flows ($14.6B Electronics + Significant IT Services)
- Continued access to US semiconductor technology and designs
- Maintained participation in global technology supply chains
- Ongoing collaboration in artificial intelligence and cloud computing
- Strategic advantage in maintaining Western technology partnerships
Alternative Technology Partnerships
- Enhanced cooperation with European technology companies
- Expanded research partnerships with Asian technology leaders
- Development of indigenous technology capabilities
- Strategic investments in emerging technology sectors
The exemption of electronics and IT sectors ensures India maintains critical technology transfer relationships with the US while developing alternative partnerships. This balanced approach allows continued access to advanced US technology while building strategic independence through diversified partnerships.
Small and Medium Enterprise (SME) Impact
MSME Sector Analysis and Support Measures
| MSME Category | Affected Businesses | Impact Severity | Government Response |
|---|---|---|---|
| Textile Exporters | 45,000+ units | Severe disruption | Emergency credit facilities |
| Handicrafts | 32,000+ artisans | Market access loss | Alternative market development |
| Leather Goods | 28,000+ manufacturers | Supply chain disruption | Export diversification support |
| Jewelry SMEs | 15,000+ units | Production scaling back | UAE market facilitation |
| Chemical SMEs | 12,000+ units | Raw material cost surge | Input cost subsidies |
| Auto Components | 8,000+ suppliers | Order cancellations | Domestic market pivot |
The 50% tariff impact on MSME sectors has prompted comprehensive government intervention, with the Ministry of MSME announcing ₹25,000 crore emergency support package. This includes subsidized credit, alternative market development assistance, and expedited export clearances for alternative destinations.
MSME Survival Strategies: Small exporters are forming cooperative clusters to share costs of market diversification, with government-supported trade missions to ASEAN, EU, and Middle Eastern markets. The focus has shifted from individual company solutions to sector-wide collaborative approaches.
Currency and Financial Market Implications
Rupee Stability and Capital Flow Management
Current Financial Impact:
- Rupee depreciation limited to 3-5% due to protected sector stability
- Foreign exchange reserves maintaining adequate levels above $640 billion
- Portfolio investment flows showing mixed patterns with sector differentiation
- Trade finance costs increasing for non-exempted sectors
RBI Strategic Response:
- Enhanced rupee-yuan swap arrangements with China
- Expanded local currency trade settlements with BRICS partners
- Strategic forex intervention to maintain rupee stability
- Development of alternative payment systems reducing dollar dependence
The maintenance of $30 billion in protected exports provides crucial foreign exchange stability, while the RBI implements strategic measures to manage currency impacts from reduced non-exempted sector exports.
Legal and WTO Implications
Trade Dispute and International Legal Framework
WTO Dispute Status:
- India has initiated formal dispute settlement proceedings at the WTO
- Challenging the 50% tariff as violation of Most Favored Nation principles
- Arguing that Russian oil justification exceeds WTO security exceptions
- Building coalition support with other affected trading partners
Legal Strategy Framework:
- Demonstrating that 50% tariffs exceed any reasonable security justification
- Highlighting discriminatory treatment compared to Pakistan’s preferential rates
- Documenting economic damage to support compensation claims
- Leveraging WTO precedents on excessive tariff impositions
The WTO challenge faces complexity due to US arguments about national security, but India’s legal team argues that Russian oil imports don’t qualify for security exceptions, especially when European allies continue similar imports.
Supply Chain Reconfiguration Impact
Global Manufacturing Realignment
Friend-shoring Developments:
- US companies accelerating “India+1” strategies for supply chain diversification
- Protected sectors (pharma, electronics) benefiting from China+1 sourcing
- Non-exempted sectors facing supply chain exodus to alternative locations
- Regional manufacturing hubs emerging in Southeast Asia and Mexico
Strategic Supply Chain Shifts:
- Pharmaceutical manufacturing consolidating in India for global distribution
- Electronics assembly expanding to leverage continued US market access
- Textile production relocating to qualify for US market through third countries
- Automotive components shifting to Mexico and Canada for USMCA benefits
The bifurcated tariff structure is creating complex supply chain realignments where protected sectors strengthen their US integration while affected sectors develop alternative global networks.
Climate and Energy Security Dimensions
Green Energy Transition and Trade Policy
Renewable Energy Implications:
- India’s $4.09 billion energy exports include growing renewable components
- Solar panel manufacturing benefits from continued US market access
- Green hydrogen development gaining strategic importance
- Climate technology partnerships maintaining momentum despite tensions
Energy Independence Strategy:
- Russian oil imports defended as transition fuel during renewable scale-up
- Domestic renewable capacity expansion accelerating to reduce import dependence
- Strategic petroleum reserves being diversified beyond Middle Eastern sources
- Biofuel development gaining priority as alternative to oil imports
The energy dimension of the tariff dispute highlights the intersection of climate goals, energy security, and geopolitical alignment, with India arguing that energy diversification serves both environmental and security objectives.
Future Outlook and Strategic Implications
The selective 50% tariff escalation represents a complex transformation in US-India economic relations, creating both significant challenges and strategic opportunities. India’s response strategy involves optimizing protected sector advantages while accelerating diversification for affected industries. The $30 billion in exempted exports demonstrates that critical sectors maintain strategic importance and continued market access, suggesting economic relationships remain viable despite broader tensions.
Strategic Opportunity Framework: The bifurcated tariff structure creates opportunities for India to strengthen its position in protected sectors while developing alternative markets for affected industries. The pharmaceutical sector’s $10.5 billion exemption, electronics protection at $14.6 billion, and energy export security provide substantial leverage for continued US engagement while diversification efforts reduce overall market dependence.
The simultaneous Pakistan preference while maintaining significant Indian exemptions demonstrates selective strategic competition rather than complete realignment. Pakistan’s preferential treatment contrasts with India’s challenges, but the substantial protected sectors indicate continued US strategic interest in maintaining economic relationships in critical areas.
Geopolitical Balance: The executive order targeting India’s Russian oil imports while protecting pharmaceuticals, electronics, and energy exports creates strategic complexity requiring nuanced responses. India’s approach involves defending energy independence while leveraging protected sector access, potentially strengthening alternative partnerships while maintaining critical US economic relationships.
For Indian businesses, the current environment requires differentiated strategies – optimizing opportunities in protected sectors while implementing geographic diversification for affected industries. The 29% of exports in exempted categories provide substantial foundation for continued US engagement, while other sectors must accelerate alternative market development.
Global Economic Implications: The selective India-US trade confrontation demonstrates the evolution toward strategic competition in specific sectors while maintaining cooperation in others. This approach suggests economic fragmentation along strategic lines rather than complete bloc formation, creating opportunities for countries to maintain multiple economic relationships while managing geopolitical tensions.
Strategic Response Recommendations: Indian exporters should implement sector-specific strategies – maximizing protected market access while accelerating diversification for affected industries. The pharmaceutical, electronics, and energy sectors should leverage their exempted status for expanded US market presence, while textile, automotive, and chemical industries must prioritize alternative market development and supply chain flexibility.
The success of India’s response will determine whether the country emerges as a model for managing selective economic pressure while maintaining strategic relationships across multiple partnerships. Current indicators suggest India is pursuing balanced strategic autonomy – defending core interests while maintaining pragmatic economic cooperation where mutually beneficial.
Disclaimer: The data research report we present here is based on information found from various sources. We are not liable for any financial loss, errors, or damages of any kind that may result from the use of the information herein. We acknowledge that though we try to report accurately, we cannot verify the absolute facts of everything that has been represented.

