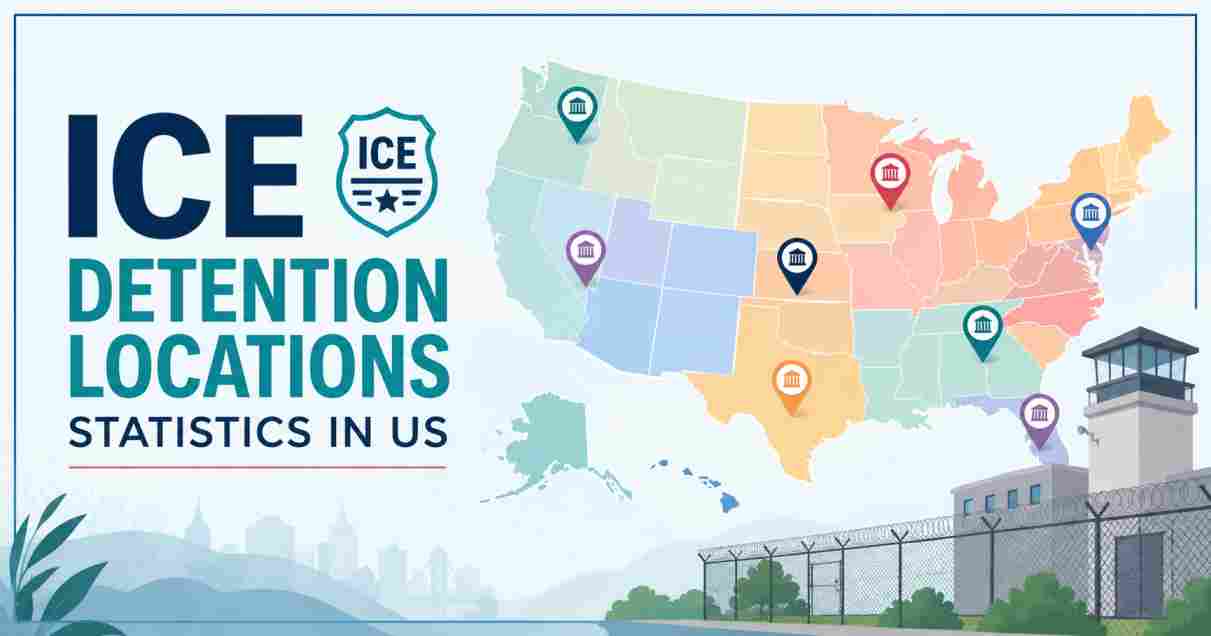
ICE Detention Locations in 2026
The geography of ICE detention in 2026 tells a story that goes far beyond any single facility or headline number. Across the United States, Immigration and Customs Enforcement (ICE) now operates one of the most geographically expansive civil detention networks in US history — spanning all 50 states, Guam, Puerto Rico, the Northern Mariana Islands, and even Guantanamo Bay, Cuba. In February 2026 alone, ICE held people in 456 facilities nationwide, yet the agency publicly acknowledged using only 220 of them on its official website — a transparency gap that researchers and oversight bodies have flagged as a growing problem. From the swamplands of the Florida Everglades to military installations in El Paso, Texas, from county jails in rural Louisiana to newly purchased commercial warehouses in Arizona, Georgia, and Pennsylvania, the location map of US immigration detention has been redrawn at extraordinary speed.
Understanding where ICE detention facilities are located in 2026 is not a matter of abstract policy — it directly determines whether a detained person can access a lawyer, stay near family, receive proper medical care, and meaningfully fight their case before an immigration judge. The Trump administration’s rapid geographic expansion of detention, backed by $45 billion in federal funding through the “One Big Beautiful Bill Act,” has pushed ICE into states and communities that have never housed immigration detention before, while simultaneously deepening the concentration of detainees in already-established hubs across Texas, Louisiana, Georgia, and Florida. This article brings together the latest confirmed ICE detention location statistics for 2026, drawing exclusively on government data sources and verified research.
Interesting Facts: ICE Detention Locations in the US 2026
LOCATION HIGHLIGHTS — ICE DETENTION NETWORK 2026
═══════════════════════════════════════════════════════════════════════

  States with active facilities (Feb 2026)  ████████████████████████  50 + territories
  Total active facilities (Feb 2026)         ████████████████████████  456
  Facilities ICE acknowledged publicly       ████████████             220
  Hidden hold/staging facilities             ████████                 160
  Texas — most facilities per state          ████████████████████████  61
  Florida — 2nd most facilities              ██████████████████       38
  California — 3rd most                      ████████████             23
  Virginia — 4th most                        ████████████             23
  Largest single facility (avg daily pop.)   ████████████████████████  2,952 (Camp East Montana)

═══════════════════════════════════════════════════════════════════════
| Fact | Detail |
|---|---|
| Total active facilities in February 2026 | 456 facilities (excluding medical facilities), per Vera Institute analysis of ICE data |
| Facilities ICE acknowledged on its website | Only 220 facilities — ICE obscures more than half its actual detention network |
| Hidden “hold/staging” facilities | 160 hold/staging facilities in use in February 2026 that ICE largely excludes from its public statistics |
| Geographic reach | ICE detained people in all 50 US states, plus Guam, Guantanamo Bay (Cuba), Northern Mariana Islands, and Puerto Rico in February 2026 |
| Texas — most facilities by state | 61 active facilities in Texas in February 2026 — the most of any state |
| Florida — second most facilities | 38 active facilities in Florida — second-highest in the nation |
| California and Virginia | Both had 23 active facilities each in February 2026 |
| Largest facility (FY 2026 average daily pop.) | Camp East Montana (Fort Bliss, El Paso, TX) — averaging 2,952 detainees per day (FY 2026 YTD) |
| First facility ever to top 73,400 in a day | Peak single-day detention record: 73,400+ people on a single day in mid-January 2026 (Vera Institute) |
| Top 5 states by number of detainees | Texas (17,908), Louisiana (8,115), California (5,807), Florida (5,281), Georgia (4,383) |
| Southern US detention concentration | Five states — Texas, Florida, Louisiana, Arizona, and Georgia — account for over 60% of all ICE detention book-ins |
| Texas book-ins since January 2025 | Over 200,000 book-ins across 115 Texas facilities between January 2025 and mid-October 2025 |
| Louisiana staging facility dominance | 45% of all 93,105 Louisiana book-ins came from the Alexandria Staging Facility alone |
| Guantanamo Bay detention | ICE used at least two facilities at Guantanamo Bay — Migrant Ops Center Main AV622 and JTF Camp Six |
| Warehouses purchased for detention | At least 7 large commercial warehouses purchased in AZ, GA, MD, PA, and TX — some exceeding 1 million sq ft |
| Alligator Alcatraz — Florida Everglades | Opened July 2025 in Ochopee, FL; held 1,300–1,800 per day from Nov 2025 through mid-March 2026; designed for up to 3,000 detainees |
| Mega-center planned for El Paso (new) | New facility near Clint/Socorro, TX planned to hold up to 8,500 people — would become the largest ICE facility ever |
| Facilities active for all 17 years (FY09–FY26) | Only 59 facilities (4%) of the 1,490 ever used by ICE were active for the entire 17-year period studied |
| New facilities since FY 2024 | At least 103 additional facilities opened since fiscal year 2024, per ICE’s own data |
Source: Vera Institute of Justice ICE Detention Trends Dashboard (vera.org, April 2026), TRAC Reports (tracreports.org, April 2026), ICE official detention facility list (ice.gov, March 2026), NPR, American Immigration Council, El Paso Matters
The location data above reveals a detention system that is simultaneously vast and deliberately opaque. The gap between the 456 facilities independently documented by the Vera Institute and the 220 facilities ICE acknowledges on its own website is not a minor discrepancy — it represents an entire parallel layer of 160 hold and staging facilities that ICE uses but actively excludes from the statistics it publishes for public accountability. These facilities — often county jails, temporary holding sites, field office rooms, or airport staging areas — detain real people but fall beneath the threshold of transparency that oversight bodies, advocates, and the public rely on.
The geographic concentration of ICE detention locations in the South is also deeply intentional. Over 60% of all ICE detention book-ins flow through just five southern states — Texas, Florida, Louisiana, Arizona, and Georgia — placing detained individuals far from major legal aid organizations in northern and coastal cities, and far from the families and communities they were arrested in. This is not an accident of geography: it reflects ICE’s deliberate reliance on regions where private prison operators have existing infrastructure, where local governments have been more willing to sign detention contracts, and where remote locations create natural barriers to legal access, oversight, and public scrutiny.
ICE Detention Locations by State in the US 2026
STATES WITH MOST ACTIVE ICE DETENTION FACILITIES — February 2026
══════════════════════════════════════════════════════════════════════
  Texas        ████████████████████████████████████████████████████  61
  Florida      ███████████████████████████████                       38
  California   ███████████████████                                   23
  Virginia     ███████████████████                                   23
  Louisiana    ████████                                              ~9–11
══════════════════════════════════════════════════════════════════════| State | Active Facilities (Feb 2026) | ICE Detainees Held (FY 2026, as of Apr 2026) |
|---|---|---|
| Texas | 61 | 17,908 |
| Florida | 38 | 5,281 |
| California | 23 | 5,807 |
| Virginia | 23 | Not separately reported |
| Louisiana | ~9–11 | 8,115 |
| Georgia | Not separately reported | 4,383 |
| Mississippi | Not separately reported | Part of New Orleans AOR |
| All other states + territories | Combined remainder | Combined remainder |
| TOTAL (all jurisdictions) | 456 active | ~60,311 (Apr 4, 2026) |
Source: Vera Institute of Justice, ICE Detention Trends Dashboard (April 10, 2026); TRAC Reports Immigration Quick Facts (tracreports.org, April 2, 2026)
Texas leads the country in both the number of active ICE detention facilities and the total number of detainees by a substantial margin. With 61 active facilities in February 2026 and 17,908 detainees as of April 2026, Texas is effectively the spine of the national ICE detention network — hosting everything from massive dedicated processing centers to county jails and newly opened military-base tent camps. Florida follows with 38 facilities, though its detainee count is lower than Louisiana, reflecting the fact that many Florida facilities are smaller county jails and staging sites rather than large-population processing centers. California and Virginia each had 23 facilities in February 2026 — a number that reflects California’s large immigrant population and Virginia’s role as a holding hub for the mid-Atlantic region near Washington, D.C.
Louisiana’s position is particularly striking. With only around 9–11 dedicated ICE processing centers, the state holds 8,115 detainees — the second-highest total nationally — because its facilities are large and purpose-built for ICE use. Louisiana has been the first non-border state to aggressively expand immigration detention capacity since 2019, and its remote, rural facilities serve as de facto national transfer hubs, receiving detainees from all over the country. Georgia holds 4,383 detainees and is on the verge of a major expansion, with the Folkston ICE Processing Center approved to nearly triple from 1,100 to ~3,000 beds under a June 2026 agreement, and a proposed mega-center in Social Circle, Georgia that would hold up to 8,000–10,000 people once complete.
Largest ICE Detention Facility Locations in the US 2026
LARGEST ICE DETENTION FACILITIES BY AVERAGE DAILY POPULATION — FY 2026
══════════════════════════════════════════════════════════════════════
  Camp East Montana (El Paso, TX)           ████████████████████████  2,952
  Adams County Corr. Ctr (Natchez, MS)      ████████████████████      2,184
  Stewart Det. Center (Lumpkin, GA)         ████████████████████      2,001
  Alligator Alcatraz (Ochopee, FL)          ████████████████          ~1,300–1,800
  South TX Det. Complex (Pearsall, TX)      ████████████████          1,741
  Adelanto ICE Proc. Ctr. (Adelanto, CA)    ████████████████          1,733
  Winn Corr. Center (Winnfield, LA)         ███████████               ~large
  Anson (Anson, TX — MTC)                   ███████████               1,044
  California City (CA — CoreCivic)          ███████████               1,036
══════════════════════════════════════════════════════════════════════
| Facility Name | Location (City, State) | Avg. Daily Pop. / Notes | Operator |
|---|---|---|---|
| Camp East Montana | El Paso (Fort Bliss), TX | ~2,952/day (FY 2026 YTD) | Acquisition Logistics LLC |
| Adams County Correctional Center | Natchez, MS | 2,184/day | Private |
| Stewart Detention Center | Lumpkin, GA | 2,001/day | Private (GEO Group) |
| Florida Soft-Sided Facility-South (“Alligator Alcatraz”) | Ochopee, FL (Everglades) | 1,300–1,800/day (Nov 2025–Mar 2026); ~1,400 as of early April 2026 | Florida FDEM / DHS |
| South Texas ICE Processing Center | Pearsall, TX | 1,741/day | GEO Group |
| Adelanto ICE Processing Center | Adelanto, CA | 1,733/day | Private |
| Winn Correctional Center | Winnfield, LA | Among highest in LA | LaSalle Corrections |
| Anson Detention Facility | Anson, TX | 1,044/day | Management & Training Corp. |
| California City Imm. Processing Center | California City, CA | 1,036/day | CoreCivic |
| Montgomery ICE Processing Center | Conroe, TX | 1,227 (FY 2026 YTD) | GEO Group |
Source: TRAC Reports (tracreports.org, April 2026); Vera Institute of Justice (vera.org, April 2026); ICE FY 2026 Detention Stats (ice.gov); Wikipedia ICE facility pages citing ICE official data
Camp East Montana at Fort Bliss, El Paso, Texas, stands as the single largest ICE detention facility location in FY 2026 by average daily population — holding close to 3,000 detainees per day under a contract worth approximately $1.2 billion with a company called Acquisition Logistics LLC, a firm with no prior prison management experience. The facility opened in August 2025 as a tent encampment on active US military land and has been at the center of severe controversy, including three detainee deaths in 44 days, one of which was ruled a homicide by the El Paso County Medical Examiner. Plans are already underway to expand the facility to house up to 5,000 people by September 2027, and a separate new mega-facility near Clint/Socorro, TX is in development targeting 8,500 people — which would make it the largest ICE detention facility in US history.
The Adams County Correctional Center in Natchez, Mississippi (2,184/day) and the Stewart Detention Center in Lumpkin, Georgia (2,001/day) both crossed the 2,000-per-day threshold in March 2026. The Florida Soft-Sided Facility-South — widely known as “Alligator Alcatraz” — in the Ochopee, Florida Everglades operated with 1,300–1,800 detainees per day from November 2025 through mid-March 2026, with a maximum capacity of 3,000 and a projected expansion to 5,000 beds. As of May 2026, Florida is expected to wind down the facility by early summer following mounting legal challenges, allegations of inhumane conditions, and escalating operational costs estimated at $450 million per year. Three private operators — GEO Group, CoreCivic, and LaSalle Corrections — operate the overwhelming majority of large-population ICE detention locations across the country.
ICE Detention Location Expansion: New Facilities in the US 2026
NEW & PLANNED ICE DETENTION INFRASTRUCTURE LOCATIONS — 2026
══════════════════════════════════════════════════════════════════════
  New facilities since FY 2024              ████████████████████████  103+
  Warehouses purchased (AZ,GA,MD,PA,TX)     █████████                 7+
  Mega-centers planned (7,500–10,000 beds)  ████████                  8 sites
  Regional processing sites planned         ████████████████          16 sites
  States where new facilities opened        ████████                  FL, LA, IN + more
  Potential military base sites identified  ████████████              10+
══════════════════════════════════════════════════════════════════════
| Expansion Location / Type | Details | Status (as of May 2026) |
|---|---|---|
| Camp East Montana — Fort Bliss, El Paso, TX | Tent encampment on active military land; current avg. ~2,952/day; expanding to 5,000 by 2027 | Operational |
| New El Paso-area mega warehouse | Near Clint/Socorro, TX; planned for up to 8,500 detainees; DHS purchased warehouses for $123 million | Under development |
| Social Circle, GA mega-center | One of 8 planned mega-centers; would roughly double the town’s population of ~5,000 | Planned |
| Folkston ICE Processing Center expansion, GA | Expanding from 1,100 to ~3,000 beds; ~$50 million county agreement approved June 2026 | Approved |
| Alligator Alcatraz — Ochopee, FL | Opened July 2025; 3,000 capacity; potential wind-down by early summer 2026 | Operational / Closing |
| Alexandria Staging Facility, LA | Accounts for 45% of all Louisiana book-ins; unique airstrip-adjacent facility for rapid deportations | Operational |
| DHS warehouse purchases (AZ, GA, MD, PA, TX) | At least 7 large warehouses, some over 1 million sq ft; being retrofitted for detention | Purchased / In retrofit |
| Joint Base McGuire-Dix-Lakehurst, NJ | Identified as potential military site holding facility | Planned/reported |
| Niagara Falls Air Reserve Station, NY | Identified as potential military site near Buffalo | Planned/reported |
| Hill Air Force Base, UT | Identified in DHS memo as potential site | Planned/reported |
| Homestead Air Reserve Base, FL (near Miami) | Identified in DHS memo as potential site | Planned/reported |
| Guantanamo Bay, Cuba | ICE documented using at least 2 facilities — Migrant Ops Center Main AV622 and JTF Camp Six | Operational |
| State-run facility — Indiana | New state-run immigration detention facility opened in 2025 | Operational |
| State-run facilities — Nebraska | New state-run immigration detention facility in 2025, inspired by Alligator Alcatraz model | Operational |
Source: ICE internal memo (Feb 13, 2026), American Immigration Council (March 2026), NBC News (Feb 5, 2026), El Paso Matters (Feb 6–7, 2026), Vera Institute (April 2026), Newsweek, DHS, immpolicytracking.org
The geography of new ICE detention locations in 2026 reflects a fundamental restructuring of how the United States holds immigration detainees. ICE has effectively abandoned its earlier plan to use soft-sided tent camps as a quick-build solution — a strategy that produced only Camp East Montana before being replaced by a warehouse-based model. The February 13, 2026 internal ICE memo describes an infrastructure plan built around a “Hub and Spoke Model”: eight mega-centers holding 7,500–10,000 people each serve as national hubs, fed by 16 smaller regional processing sites holding 500–1,500 people for short stays of three to seven days. The mega-center plan calls for all eight to be operational by November 30, 2026 — an extraordinarily compressed construction timeline for facilities of this scale.
Beyond these planned facilities, ICE has taken immediate steps by purchasing at least 7 large commercial warehouses across Arizona, Georgia, Maryland, Pennsylvania, and Texas, with some exceeding 1 million square feet — making them more than twice the size of existing ICE detention facilities. Several military bases have been identified in DHS planning documents as potential future detention locations, continuing a pattern begun with Fort Bliss. What is particularly notable about the 2026 ICE detention location map is that it now extends into states that historically had little to no ICE detention presence — including Indiana, Nebraska, and potentially New Jersey, New York, and Utah — reflecting the administration’s explicit goal of building a detention infrastructure capable of handling 100,000+ detainees simultaneously for the long term.
ICE Detention Locations: Private vs. Government-Run in the US 2026
FACILITY OPERATOR TYPE — MARCH 2026 (MEGA-FACILITIES 1,000+ DAILY)
══════════════════════════════════════════════════════════════════════
  For-profit operated (1,000+ daily)    ████████████████████████████████  19 of 20
  Government-operated (1,000+ daily)    █                                  1 of 20
  % of 1,000+ facilities: for-profit    ████████████████████████████████  95%
══════════════════════════════════════════════════════════════════════
| Operator Category | Data Point | Detail |
|---|---|---|
| Mega-facility operator type (March 2026) | 19 out of 20 facilities with 1,000+ daily detainees | Operated by for-profit companies |
| GEO Group | Largest private ICE detention contractor | Operates South Texas ICE Processing Center (Pearsall), Stewart (Lumpkin, GA), Montgomery (Conroe, TX), and others |
| CoreCivic | Second-largest private contractor | Operates California City, CA and others |
| LaSalle Corrections | Key Louisiana operator | Operates Winn Correctional Center (Winnfield, LA) and others |
| Acquisition Logistics LLC | Operates Camp East Montana, TX | ~$1.2 billion contract; no prior prison management experience |
| Planned private share of new mega-centers | ~90% privately owned | Per DHS planning documents for the 8 planned mega-centers |
| Alligator Alcatraz operator | Florida Division of Emergency Management (FDEM) + DHS | State-run, unique model inspired other states |
| County jails with ICE contracts | Large share of 456 total facilities | Most of the 160 hidden hold/staging sites are county-operated jails |
| Facilities that exceeded contractual capacity (FY 2025) | 84 out of 181 authorized facilities | At least 45 facilities exceeded capacity on a single night (April 13, 2025) |
Source: Vera Institute (April 2026); TRAC Reports (tracreports.org); American Immigration Council; NBC News; Wikipedia ICE facility pages citing DHS/ICE official data
The overwhelming dominance of for-profit prison corporations in the ICE detention location network in 2026 is one of the defining structural features of the system. In March 2026, 19 out of 20 mega-facilities holding more than 1,000 people per day were operated by private companies — a 95% rate that has only intensified under the current administration’s rapid expansion push. Three companies — GEO Group, CoreCivic, and LaSalle Corrections — effectively control the backbone of large-scale immigration detention in the US, with GEO Group operating some of the highest-population facilities in the nation including the South Texas ICE Processing Center in Pearsall and Stewart Detention Center in Lumpkin, Georgia. The planned new mega-centers are expected to be approximately 90% privately operated according to DHS planning documents, cementing the private prison industry’s central role in the US immigration enforcement architecture for years to come.
The consequences of this private-operator model for detainees are well-documented. 84 out of 181 authorized facilities exceeded their contractual capacity on at least one day between October 2024 and mid-April 2025, according to TRAC Reports. The $1.2 billion contract awarded to Acquisition Logistics LLC for Camp East Montana — a company with no prior correctional management experience — is emblematic of the corners-cut approach to rapidly expanding detention capacity. Multiple DHS Office of Inspector General inspections at private facilities have documented unsanitary conditions, inadequate medical care, mold, insect infestations, inoperable toilets, and violations of ICE’s own detention standards. Yet the financial incentives for private contractors have never been stronger: with $45 billion in federal detention funding flowing through FY 2029, GEO Group reported second-quarter revenues of $636.2 million and CoreCivic posted $538.2 million in the same period.
ICE ERO Field Office Locations in the US 2026
ICE ERO — 25 FIELD OFFICE LOCATIONS ACROSS THE US (2026)
══════════════════════════════════════════════════════════════════════
  WEST          San Francisco | San Diego | Los Angeles | Phoenix
                Seattle | West Valley City (UT) | Centennial (CO)

  SOUTHWEST     El Paso | Dallas | Houston | Harlingen | San Antonio

  SOUTH         New Orleans | Atlanta | Plantation (FL)

  MIDWEST       Chicago | Detroit | Fort Snelling (MN)

  EAST          New York | Newark | Philadelphia | Buffalo
                Burlington (VT) | Baltimore | Chantilly (VA/DC)
══════════════════════════════════════════════════════════════════════
| Region | ICE ERO Field Office Location (AOR) | Key States Covered |
|---|---|---|
| West | San Francisco, CA | Northern CA, NV, HI, Guam, Northern Mariana Islands |
| West | Los Angeles, CA | Southern CA |
| West | San Diego, CA | Southern CA border region |
| West | Seattle, WA | WA, OR, AK |
| West | Phoenix, AZ | AZ |
| West | West Valley City, UT | UT, ID, MT, WY, CO (partial), NV (partial) |
| West / Central | Centennial, CO | CO, KS, NE, ND, SD, WY |
| Southwest | El Paso, TX | West TX, NM |
| Southwest | Dallas, TX | North TX, OK |
| Southwest | Houston, TX | Central TX |
| Southwest | San Antonio, TX | South-Central TX |
| Southwest | Harlingen, TX | South TX border region (added FY 2022) |
| South | New Orleans, LA | LA, MS, AL, AR, TN |
| South | Atlanta, GA | GA, NC, SC |
| South | Plantation, FL | FL |
| Midwest | Chicago, IL | IL, IN, WI, MN (partial), MO (partial) |
| Midwest | Detroit, MI | MI, OH, KY |
| Midwest | Fort Snelling, MN | MN, ND, SD, NE, KS, IA, MO |
| East | New York, NY | NYC metro, Long Island |
| East | Newark, NJ | NJ, DE |
| East | Philadelphia, PA | PA, WV |
| East | Buffalo, NY | Upstate NY, Buffalo region |
| East | Burlington, VT | VT, NH, ME, MA, RI, CT |
| East | Baltimore, MD | MD, VA (partial) |
| East | Chantilly, VA | DC metro, VA, some MD |
Source: DHS Office of Homeland Security Statistics (ohss.dhs.gov), ICE ERO official page (ice.gov/ero), ICE Field Offices page (ice.gov/contact/field-offices), Deportation Data Project (deportationdata.org)
ICE’s Enforcement and Removal Operations (ERO) is structured around 25 field offices — each called an Area of Responsibility (AOR) — that collectively cover every inch of US territory. Each field office is headed by a Field Office Director who oversees all immigration arrests, detentions, and removals within their geographic jurisdiction, and each office coordinates the use of multiple detention facilities in its region. The concentration of field offices in Texas alone — with offices in El Paso, Dallas, Houston, San Antonio, and Harlingen (a fifth office added in FY 2022 to address surging border crossings) — reflects the disproportionate enforcement load carried by the Lone Star State. The New Orleans AOR is particularly notable for its jurisdictional reach: it covers Louisiana, Mississippi, Alabama, Arkansas, and Tennessee — five states anchored by ICE’s most remote and most criticized detention facilities.
The Chantilly, Virginia AOR — which covers the DC metropolitan area — has drawn attention in 2025–2026 for using its field office as an impromptu holding space. Despite having no beds for detainees, the Chantilly office held 40 to 90 detainees in a single room for multiple days during August and September 2025, well beyond the three-day limit ICE’s own policies allow. The addition of the Harlingen, TX AOR in FY 2022 marked the first restructuring of the 25-office national map in years, reflecting the agency’s evolving enforcement geography. As the Trump administration’s enforcement footprint expands nationally — including into states covered by the Burlington, Fort Snelling, and Centennial offices that historically saw low detention activity — the operational demands on all 25 ICE field office locations are increasing simultaneously.
ICE Detention Locations: ATD Program Monitoring by Region in the US 2026
ICE ALTERNATIVES TO DETENTION (ATD) MONITORING — TOP FIELD OFFICES
April 4, 2026  (Total ATD enrollment: 180,701)
══════════════════════════════════════════════════════════════════════
  San Francisco AOR   ████████████████████████████████████████  20,500
  Los Angeles AOR     ████████████████████████████████████      18,746
  Miami AOR           ████████████████████████████████████      18,528
  Chicago AOR         ███████████████████████████████████       18,136
  New York AOR        ██████████████████████                    10,677
══════════════════════════════════════════════════════════════════════
| ICE Field Office (AOR) | ATD Enrollees Monitored (Apr 4, 2026) | Notes |
|---|---|---|
| San Francisco | 20,500 | #1 nationally — leads all AORs |
| Los Angeles | 18,746 | #2 nationally |
| Miami | 18,528 | #3 nationally |
| Chicago | 18,136 | #4 nationally; historically high ankle monitor use |
| New York | 10,677 | #5 nationally |
| All other AORs | ~94,114 combined | Across remaining 20 field offices |
| TOTAL ATD nationally | 180,701 | More than 2.6x the physical detention population |
| GPS ankle monitors in use (Feb 2026) | 42,115 | Up from ~24,000 mid-2025; ICE shifted away from SmartLINK app |
| People on SmartLINK app | Declining | ICE memo (June 2025) ordered shift to ankle monitors for all ATD enrollees |
Source: TRAC Reports Immigration Quick Facts (tracreports.org, April 4, 2026), ICE FY 2026 biweekly detention reports, Medill on the Hill (March 2026)
The geographic distribution of ICE’s Alternatives to Detention (ATD) program in 2026 mirrors a different map than physical detention — one anchored in major coastal and urban metros rather than in the rural South. San Francisco leads the nation with 20,500 people on electronic monitoring as of April 4, 2026, followed closely by Los Angeles (18,746), Miami (18,528), and Chicago (18,136). Together, just these four cities account for approximately 42% of all 180,701 ATD enrollees nationally — reflecting the large, established immigrant communities in these metros where people are fighting their cases while remaining in their communities. The ATD program in 2026 monitors more than 2.6 times the number of people in physical ICE detention, making it by far the largest single layer of ICE’s enforcement infrastructure by raw numbers.
The location of GPS ankle monitor usage is particularly telling. The Chicago AOR has historically had among the highest ankle monitor rates — at more than four times the national average before the 2025 surge — and the nationwide shift toward ankle monitors following the June 2025 internal ICE directive has only amplified these disparities. With 42,115 people on ankle monitors nationally as of February 2026 — up from roughly 24,000 just months earlier — ICE has effectively built a secondary detention infrastructure in communities across the country. Unlike physical detention locations which are concentrated in the South, ATD monitoring is concentrated in major metros, making the full picture of US immigration enforcement location data one that touches every region of the country in different but equally consequential ways.
Disclaimer: The data research report we present here is based on information found from various sources. We are not liable for any financial loss, errors, or damages of any kind that may result from the use of the information herein. We acknowledge that though we try to report accurately, we cannot verify the absolute facts of everything that has been represented.