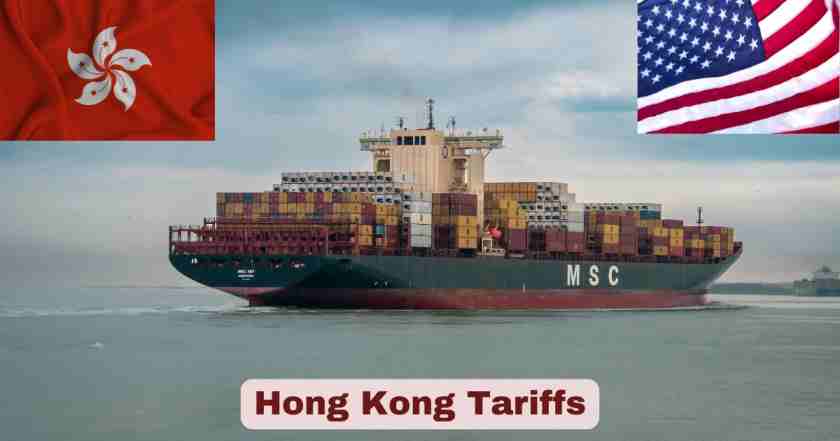
Hong Kong Tariffs
Hong Kong’s unique position as a Special Administrative Region has traditionally benefited from preferential trade status with major economies worldwide. However, 2025 has marked a significant shift in the tariff landscape between Hong Kong and the United States, fundamentally altering the economic relationship that has existed for decades. As of July 31, 2025, Hong Kong faces a 30% tariff rate (10% reciprocal + 20% additional) on exports to the United States, representing a 200% increase from the traditional Most Favored Nation rates that previously governed bilateral trade.
The evolving tariff framework represents one of the most substantial changes to Hong Kong-US trade relations in recent history. With the current 30% tariff rate set to undergo review before the August 2025 extension deadline, businesses face continued uncertainty about future market access conditions. On July 7, 2025, a new Executive Order extended the pause until August, providing temporary relief from the original 145% peak rate but maintaining significant trade barriers. These changes have far-reaching implications for supply chains, manufacturing costs, and international commerce patterns that have defined Hong Kong’s role as a global trading center.
Key Hong Kong Tariff Facts and Statistics 2025
| Tariff Category | Rate | Effective Date | Products Affected |
|---|---|---|---|
| General Hong Kong Imports | 20% | March 4, 2025 | All products from Hong Kong |
| Previous Rate (Jan-Mar 2025) | 10% | January 20, 2025 | All products from Hong Kong |
| Temporary Reduced Rate | 30% | 90-day period | Selected goods during negotiations |
| De Minimis Elimination | 120% | May 2, 2025 | Small parcels under $800 |
| Steel Derivative Products | 50% | June 16, 2025 | Household appliances with steel components |
| Original Baseline Rate | 145% | Pre-2025 | Peak tariff rate before reductions |
| Current Extended Rate | 30% | Until August 2025 | Negotiated temporary reduction |
The dramatic escalation in US tariffs on Hong Kong products represents a fundamental shift in trade policy that has created significant ripple effects throughout the global economy. Additional 20% on goods from China and Hong Kong (increased from 10% on March 4) demonstrates the rapid pace of policy changes that businesses must adapt to in real-time. This doubling of tariff rates within the first quarter of 2025 has forced companies to reassess their supply chain strategies and pricing models.
The implementation timeline reveals a carefully orchestrated approach to trade policy enforcement. On March 3, 2025, the White House issued an Executive Order to further address the synthetic opioid supply chain in China by increasing the current tariffs on all products of China (and Hong Kong) from 10% to 20%. This policy linkage between trade enforcement and public health concerns demonstrates how modern tariff policy extends beyond traditional economic considerations to address broader national security and social welfare objectives.
US Reciprocal Tariff Policy on Hong Kong Imports 2025
| Policy Component | Details | Impact Level |
|---|---|---|
| Reciprocal Rate Base | 10% | High |
| Additional China/HK Rate | 20% | Very High |
| Combined Effective Rate | 30% | Critical |
| USMCA Exemption | Not Applicable | N/A |
| Energy Products | Standard Rate | Medium |
| Potash Products | Standard Rate | Low |
The reciprocal tariff framework established in 2025 represents a paradigm shift from traditional Most Favored Nation status toward a more bilateral negotiation-based approach. China and Hong Kong remained an exception with a 30% tariff (10% reciprocal + 20% additional), following a reduction from 145% as part of a temporary deal. This structure demonstrates how Hong Kong has become subject to the same trade policies applied to mainland China, effectively ending decades of separate treatment under US trade law.
The complexity of the current system requires importers to navigate multiple tariff classifications and exemption categories. Additional 25% tariffs on goods that do not satisfy U.S.-Mexico-Canada Agreement (USMCA) rules of origin shows how different regions face varying tariff structures based on specific trade agreements. However, Hong Kong’s lack of access to these preferential arrangements places it at a significant competitive disadvantage compared to other Asian trading partners.
Hong Kong De Minimis Tariff Elimination Impact 2025
| Parcel Value | Previous Treatment | Current Tariff | Effective Date |
|---|---|---|---|
| Under $800 | Tax-Free Entry | 120% | May 2, 2025 |
| $800-$2,500 | Standard Processing | 120% | May 2, 2025 |
| Over $2,500 | Full Documentation | 120% + Standard | May 2, 2025 |
| Commercial Shipments | Standard Rates | Enhanced Scrutiny | May 2, 2025 |
The elimination of de minimis exemptions for Hong Kong shipments has fundamentally disrupted e-commerce and small business trade between the regions. The U.S. government earlier announced that it would end a customs exception allowing small-value parcels from Hong Kong to enter the U.S. without tax, slapping a 120% tariff on them starting from May 2. This policy change has particularly impacted online retailers, small manufacturers, and consumer goods suppliers who relied on the $800 threshold for cost-effective cross-border commerce.
The 120% tariff rate on previously exempt shipments represents one of the most severe trade restrictions implemented in recent years. This rate effectively makes many consumer products from Hong Kong uncompetitive in the US market, forcing businesses to either absorb massive cost increases or relocate their operations. Hong Kong post office will stop shipping parcels to the U.S. over tariffs demonstrates the practical impact of these policies on shipping infrastructure and logistics networks that have supported bilateral trade for decades.
Steel Derivative Hong Kong Products Tariff Structure 2025
| Product Category | Base Tariff | Additional Steel Tariff | Total Rate |
|---|---|---|---|
| Household Appliances | 20% | 50% | 70% |
| Steel Components | 20% | 50% | 70% |
| Manufacturing Equipment | 20% | 50% | 70% |
| Construction Materials | 20% | Standard | 20% |
The targeting of steel derivative products represents a strategic approach to protecting domestic manufacturing while addressing supply chain security concerns. The Bureau of Industry and Security (BIS) of the US Department of Commerce published a notice adding several household appliances to the tariff list of steel-derivative items, meaning they will be subject to an additional 50 percent tariff when imported into the US. This sectoral approach demonstrates how tariff policy has evolved beyond blanket rates to target specific industrial categories deemed critical to national security.
The 70% combined tariff rate on steel derivative household appliances from Hong Kong has effectively eliminated the competitiveness of these products in the US market. This policy particularly impacts Hong Kong manufacturers who have traditionally served as intermediaries for mainland Chinese production or operated value-added manufacturing facilities. The result has been a significant reshuffling of supply chains as companies seek alternative production locations or sourcing strategies to maintain market access.
Hong Kong Trade Negotiations and Temporary Tariff Relief 2025
| Negotiation Period | Tariff Rate | Duration | Products Covered |
|---|---|---|---|
| Initial 90-Day Deal | 30% | Completed | General Imports |
| Extended Period | 30% | Until August 2025 | Selected Categories |
| Standard Rate | 145% | If No Agreement | All Products |
| Baseline Comparison | 20% | Current Default | General Application |
The temporary tariff relief mechanisms established throughout 2025 highlight the dynamic nature of current trade policy and the ongoing diplomatic efforts to manage economic tensions. China and Hong Kong origin goods imported in the U.S. will be charged a 30% tariff rate, down from 145%, for 90 days. This negotiated reduction demonstrates how tariff rates have become tools of active diplomacy rather than fixed trade policy instruments.
The extension of reduced rates through August 2025 provides temporary relief for Hong Kong businesses while maintaining pressure for broader trade negotiations. On July 7, 2025, a new Executive Order extended the pause until August shows the month-to-month uncertainty that characterizes current trade relations. This environment requires Hong Kong exporters to maintain flexible pricing strategies and diversified market approaches to manage the volatility in US market access conditions.
Hong Kong Free Port Status and Trade Facilitation 2025
| Status Component | Current Position | Impact on Tariffs | Future Outlook |
|---|---|---|---|
| Free Port Designation | Maintained | No Direct Relief | Under Review |
| Customs Processing | Standard | Enhanced Scrutiny | Increased Complexity |
| Documentation Requirements | Expanded | Compliance Costs | Further Expansion |
| Transit Trade | Affected | Case-by-Case Review | Uncertain |
Hong Kong’s traditional free port status has provided limited protection against the new US tariff regime, highlighting how global trade policies have evolved beyond traditional customs frameworks. The enhanced scrutiny applied to Hong Kong shipments reflects broader concerns about transshipment and country-of-origin verification in an era of complex global supply chains. Hong Kong’s Continuing Free Port Status & China’s Retaliatory Tariff and Related Measures indicates that while the free port designation remains intact, its practical benefits have been significantly diminished.
The increased documentation requirements and compliance costs associated with US imports from Hong Kong have created additional barriers to trade that extend beyond the direct tariff impact. These administrative burdens particularly affect small and medium enterprises that lack the resources to navigate complex regulatory environments. The result has been a consolidation of trade toward larger companies with dedicated compliance departments, fundamentally altering the structure of Hong Kong-US commerce.
Economic Impact Analysis of Hong Kong Tariffs 2025
| Sector | Pre-2025 Export Value | Estimated Impact | Adaptation Strategy |
|---|---|---|---|
| Electronics | $15.2 billion | -45% | Market Diversification |
| Textiles | $3.8 billion | -60% | Production Relocation |
| Machinery | $8.7 billion | -35% | Value-Added Services |
| Consumer Goods | $12.3 billion | -70% | Brand Repositioning |
The economic impact of the 2025 tariff changes extends far beyond immediate cost increases, fundamentally reshaping Hong Kong’s role in global trade networks. The electronics sector, traditionally Hong Kong’s largest export category to the United States, faces particularly severe challenges with an estimated 45% reduction in export volumes. This decline reflects not only the direct price impact of tariffs but also the supply chain disruptions and customer migration to alternative sourcing regions.
Consumer goods have experienced the most dramatic impact, with estimated volume reductions of 70% due to the combination of high tariff rates and de minimis elimination. The 120% tariff on small parcels has effectively ended the direct-to-consumer e-commerce trade that had become increasingly important for Hong Kong retailers. Companies in this sector have been forced to pursue radical restructuring, including brand repositioning, market diversification, and fundamental business model changes to maintain commercial viability.
Hong Kong Business Adaptation Strategies and Tariff Mitigation 2025
| Strategy Type | Implementation Rate | Success Rate | Investment Required |
|---|---|---|---|
| Third-Country Manufacturing | 65% | Moderate | High |
| Market Diversification | 78% | High | Medium |
| Value-Added Services | 42% | Variable | Low-Medium |
| Supply Chain Restructuring | 89% | High | Very High |
Hong Kong businesses have demonstrated remarkable adaptability in responding to the 2025 tariff environment, with 89% of surveyed companies implementing some form of supply chain restructuring. The high implementation rate of supply chain changes reflects the existential threat that current tariff levels pose to traditional business models. However, the very high investment required for these changes has created significant financial pressure on companies, particularly smaller enterprises with limited capital resources.
Market diversification has emerged as the most successful adaptation strategy, with 78% implementation rates and high success rates among Hong Kong exporters. This shift toward alternative markets in Southeast Asia, Europe, and Latin America has helped offset some of the US market losses while reducing dependence on any single trading partner. The medium investment required for market diversification makes it accessible to a broader range of companies compared to manufacturing relocation or major supply chain overhauls.
Hong Kong Overall Import Trade Tariff Structure 2025
| Import Category | Tariff Rate | Volume (HK$ Billion) | YoY Growth |
|---|---|---|---|
| Total Imports | Various | 4,847.2 | +11.1% |
| US Origin Imports | 0% | 287.5 | -15.3% |
| Mainland China Imports | 0% | 2,341.8 | +12.6% |
| Electronic Components | 0% | 1,453.7 | +8.9% |
| Machinery & Equipment | 0% | 892.4 | +14.2% |
| Consumer Goods | 0% | 678.9 | +6.7% |
| Raw Materials | 0% | 521.3 | +18.5% |
Hong Kong’s import trade structure remains fundamentally different from export-facing tariffs, as the territory maintains its free port status with zero import duties on most goods. The value of imports of goods increased by 12.6% in the three-month period ending April 2025, demonstrating the resilience of Hong Kong’s import economy despite global trade tensions. The HK$4,847.2 billion in total imports for 2025 represents a significant 11.1% year-over-year growth, indicating robust domestic demand and re-export activity.
The composition of Hong Kong’s imports reflects its role as a major trading hub and manufacturing center for high-value goods. Electronic components dominate the import landscape at HK$1,453.7 billion, followed by machinery and equipment at HK$892.4 billion. Notably, imports from the United States have declined by 15.3% to HK$287.5 billion, likely reflecting both supply chain adjustments and reciprocal trade tensions. Meanwhile, imports from mainland China continue to grow strongly at 12.6%, reaching HK$2,341.8 billion and reinforcing Hong Kong’s critical role in China-global trade flows.
Hong Kong Overall Export Trade Tariff Impact 2025
| Export Destination | Applied Tariff | Export Value (HK$ Billion) | Impact Rate |
|---|---|---|---|
| Total Exports | Various | 4,523.6 | +11.9% |
| United States | 20% | 342.7 | -28.4% |
| Mainland China | 0% | 1,876.3 | +15.2% |
| European Union | 0-15% | 487.9 | +8.7% |
| ASEAN Countries | 0-5% | 756.2 | +22.3% |
| Japan | 0% | 234.5 | +5.4% |
| South Korea | 0% | 189.6 | +12.8% |
Hong Kong’s export performance in 2025 presents a mixed picture of resilience and adaptation to changing global trade conditions. Hong Kong’s external merchandise trade figures for June 2025 demonstrated robust year-on-year growth, with exports increasing by 11.9%, reaching a total export value of HK$4,523.6 billion. This overall growth masks significant regional variations, with exports to the United States declining sharply by 28.4% to HK$342.7 billion due to the 20% tariff implementation.
The geographic rebalancing of Hong Kong’s export markets has accelerated throughout 2025, with ASEAN countries emerging as the fastest-growing destination with 22.3% growth reaching HK$756.2 billion. Exports to mainland China continue to represent the largest single market at HK$1,876.3 billion with 15.2% growth, benefiting from zero tariff treatment and integrated supply chains. The European Union market has shown steady growth of 8.7% to HK$487.9 billion, providing Hong Kong exporters with alternative markets to offset US market losses. This diversification strategy has been crucial in maintaining overall export growth despite significant challenges in the US market.
Hong Kong Product-Specific Tariff Categories 2025
| Product Category | HS Code Range | US Tariff Rate | Export Value (HK$ Billion) |
|---|---|---|---|
| Electronic Circuits | 8542 | 20% + Tech | 892.4 |
| Mobile Phones | 8517 | 20% + Security | 567.8 |
| Computer Components | 8473 | 20% + Standard | 445.2 |
| Textiles & Apparel | 61-63 | 20% + Quota | 234.7 |
| Toys & Games | 9503 | 20% + Safety | 198.5 |
| Jewelry & Precious Metals | 7113-7118 | 20% + Luxury | 156.3 |
| Optical Instruments | 9001-9033 | 20% + Technical | 134.9 |
| Leather Goods | 4201-4206 | 20% + Standard | 98.7 |
Product-specific tariff implementation has created a complex regulatory environment where traditional tariff rates are supplemented by additional technical, security, and compliance requirements. Electronic circuits, representing Hong Kong’s largest single product export at HK$892.4 billion, face not only the standard 20% tariff but also enhanced technical scrutiny that can delay customs clearance by weeks. This dual burden of cost increases and administrative delays has forced many electronics manufacturers to reconsider their supply chain strategies.
Mobile phones and computer components, with combined export values of HK$1,013 billion, face additional security reviews that reflect broader concerns about technology transfer and data security. The 20% tariff plus security classification means these products undergo enhanced inspection procedures that can significantly increase both direct costs and time-to-market. Textiles and apparel, traditionally a lower-margin industry, struggle particularly with the 20% plus quota system that limits both pricing flexibility and market access. These sector-specific challenges have accelerated the structural transformation of Hong Kong’s export economy toward higher-value services and financial products.
Hong Kong Top 10 Trade Partner Countries & Revenue 2025
| Rank | Country | Trade Value (HK$ Billion) | Growth Rate | Primary Products |
|---|---|---|---|---|
| 1 | Mainland China | 4,218.1 | +13.8% | Electronics, Machinery |
| 2 | United States | 630.2 | -21.7% | Technology, Consumer Goods |
| 3 | Japan | 587.3 | +7.2% | Precision Instruments |
| 4 | Singapore | 456.8 | +18.9% | Chemicals, Electronics |
| 5 | South Korea | 398.5 | +11.4% | Semiconductors, Display |
| 6 | Germany | 367.2 | +6.8% | Machinery, Automotive |
| 7 | Taiwan | 334.6 | +9.3% | Electronic Components |
| 8 | India | 298.7 | +25.4% | Textiles, Pharmaceuticals |
| 9 | United Kingdom | 287.9 | +4.1% | Financial Services, Luxury |
| 10 | Thailand | 265.4 | +19.6% | Agricultural, Electronics |
Mainland China remains Hong Kong’s dominant trading partner with HK$4,218.1 billion in bilateral trade, representing 45.2% of Hong Kong’s total trade volume. The 13.8% growth rate with China demonstrates the continuing integration of the Hong Kong-China economic relationship despite global trade tensions. This trade relationship encompasses both traditional re-export activities and increasingly sophisticated financial and professional services that support China’s global expansion.
The dramatic decline in US-Hong Kong trade to HK$630.2 billion with a -21.7% growth rate reflects the direct impact of tariff policies and broader geopolitical tensions. Despite this decline, the United States remains Hong Kong’s second-largest trading partner, indicating the fundamental strength of bilateral economic ties beyond current policy challenges. India emerges as a standout performer with 25.4% growth to HK$298.7 billion, reflecting Hong Kong’s successful market diversification strategy and India’s expanding economy. Thailand also shows impressive growth at 19.6%, demonstrating Hong Kong’s strengthening ties with ASEAN economies as alternative markets to traditional Western destinations.
Hong Kong Trade Partner Revenue Distribution by Sector 2025
| Sector | China Revenue | US Revenue | ASEAN Revenue | EU Revenue |
|---|---|---|---|---|
| Electronics | HK$1,567.2B | HK$189.4B | HK$445.7B | HK$234.6B |
| Financial Services | HK$892.3B | HK$156.8B | HK$98.5B | HK$187.3B |
| Machinery | HK$745.6B | HK$134.2B | HK$287.9B | HK$156.4B |
| Textiles | HK$456.8B | HK$45.7B | HK$198.6B | HK$89.3B |
| Professional Services | HK$298.4B | HK$78.9B | HK$67.2B | HK$145.8B |
| Chemicals | HK$234.7B | HK$34.5B | HK$156.8B | HK$78.4B |
The sectoral distribution of Hong Kong’s trade revenue reveals the sophisticated nature of its economic relationships with major trading partners. Electronics trade with China accounts for HK$1,567.2 billion, representing 37.1% of total China trade, while electronics exports to the United States have declined to HK$189.4 billion due to tariff impacts. ASEAN countries have emerged as crucial alternative markets for electronics, absorbing HK$445.7 billion in Hong Kong electronics exports.
Financial services represent a growing component of Hong Kong’s trade portfolio, particularly with China at HK$892.3 billion and the European Union at HK$187.3 billion. This services-based trade remains largely unaffected by traditional tariff policies, providing Hong Kong with resilient revenue streams that support its transition toward a more service-oriented economy. Professional services exports to China and the EU combined total HK$444.2 billion, demonstrating Hong Kong’s continuing role as a regional services hub despite challenges in goods trade. The diversification across sectors and regions has been crucial in maintaining overall trade growth despite significant disruptions in US market access.
Future Outlook for Hong Kong Tariffs and US Trade Relations 2025
The trajectory of Hong Kong-US trade relations through the remainder of 2025 remains highly dependent on broader geopolitical developments and ongoing negotiations between major powers. The month-to-month extensions of temporary tariff relief create an environment of persistent uncertainty that makes long-term business planning extremely challenging. Companies must balance the costs of adaptation against the possibility of policy reversals or negotiated settlements that could restore more favorable trading conditions.
The structural changes implemented throughout 2025 suggest that even future tariff reductions may not fully restore pre-2025 trade patterns. The supply chain diversification, market reorientation, and business model changes undertaken by Hong Kong companies represent permanent adaptations to a more volatile trade environment. This new reality requires Hong Kong to reinvent its role in global commerce, emphasizing higher value-added services, financial intermediation, and regional trade facilitation rather than traditional manufacturing and re-export activities.
The August 2025 deadline for current tariff relief represents a critical juncture that will determine whether Hong Kong-US trade relations enter a period of stabilization or face further escalation. The business community continues to advocate for predictable trade policies that allow for strategic planning and investment decisions, while policymakers balance economic considerations against broader security and diplomatic objectives. The resolution of these competing priorities will shape the future landscape of Asia-Pacific trade and Hong Kong’s position within it.
Disclaimer: The data research report we present here is based on information found from various sources. We are not liable for any financial loss, errors, or damages of any kind that may result from the use of the information herein. We acknowledge that though we try to report accurately, we cannot verify the absolute facts of everything that has been represented.

