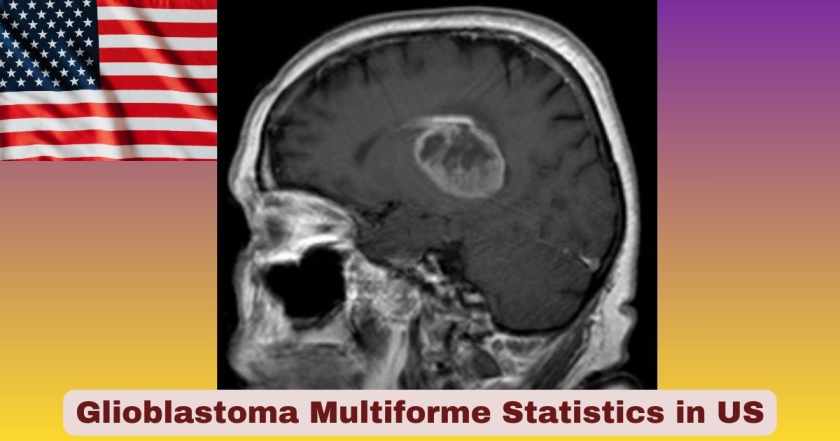
Glioblastoma Multiforme in the US 2026
Glioblastoma multiforme remains the most aggressive and deadly primary brain tumor affecting Americans today. As we move through 2026, this devastating disease continues to challenge medical professionals, researchers, and families across the United States. Understanding the current landscape of glioblastoma multiforme through comprehensive statistical analysis helps illuminate the scope of this public health challenge and guides ongoing research efforts toward better treatments and outcomes.
The year 2026 marks another critical period in the ongoing battle against glioblastoma multiforme in the United States. Recent projections from the Central Brain Tumor Registry of the United States (CBTRUS) indicate that approximately 14,000 to 14,200 new cases of glioblastoma are expected to be diagnosed this year, continuing an upward trend driven primarily by the aging American population. This grade IV astrocytoma accounts for more than half of all malignant brain tumors diagnosed annually, making it not just the most common but also the most formidable adversary in neuro-oncology. The disease shows no preference for geography or socioeconomic status, though distinct patterns emerge across demographic groups that warrant close examination.
Interesting Facts About Glioblastoma Multiforme in the US 2026
| Fact Category | Statistics 2026 |
|---|---|
| Most Common Malignant Brain Tumor | Accounts for 52.2% of all malignant brain and CNS tumors |
| Percentage of All Brain Tumors | Represents 13.7% of all primary brain tumors (malignant and non-malignant combined) |
| Male vs Female Incidence Ratio | 1.6:1 – Men are 1.6 times more likely to develop glioblastoma than women |
| Median Age at Diagnosis | 64 years – Peak incidence occurs between ages 75-84 |
| 5-Year Survival Rate | Less than 7% of patients survive 5 years post-diagnosis |
| Median Survival Time | 8 months for all patients; 12-15 months with aggressive treatment |
| Annual Incidence Rate | 3.19 per 100,000 population in the United States |
| Estimated New Cases 2026 | Approximately 14,000-14,200 new diagnoses expected |
| Annual Deaths | More than 10,000 Americans die from glioblastoma each year |
| Race with Highest Incidence | Non-Hispanic White individuals have twice the risk compared to African Americans |
| Primary vs Secondary | 90% of cases are primary (de novo) glioblastoma |
| Frontal Lobe Involvement | Most commonly occurs in the frontal lobe, followed by temporal and parietal lobes |
Data Source: Central Brain Tumor Registry of the United States (CBTRUS) Statistical Report 2018-2022, National Cancer Institute SEER Program, Centers for Disease Control and Prevention NPCR
The statistics presented above paint a sobering picture of glioblastoma multiforme in 2026. The fact that this tumor type dominates the malignant brain tumor landscape, accounting for more than half of all malignant cases, underscores why it receives substantial research attention despite affecting a relatively small number of people annually. The 52.2% prevalence among malignant tumors reflects both its aggressive nature and its propensity to develop rapidly in previously healthy brain tissue. What makes these numbers particularly challenging is the stark male predominance, with the 1.6:1 male-to-female ratio persisting across all age groups and demographic categories, though researchers have yet to fully explain this gender disparity.
The survival statistics remain the most troubling aspect of glioblastoma multiforme in the US 2026. Despite decades of research and incremental treatment improvements, the median survival of 8 months has shown minimal improvement over the past 30 years. Even with the most aggressive treatment protocols including maximal surgical resection, radiation therapy, and temozolomide chemotherapy, median survival extends only to 12-15 months. The 5-year survival rate below 7% represents one of the poorest prognoses among all cancer types, reflecting the tumor’s resistance to conventional therapies and its diffuse infiltration into surrounding brain tissue. The median age of 64 years at diagnosis, with peak incidence between 75-84 years, highlights how this disease predominantly affects older Americans, though younger individuals are certainly not immune.
Incidence Rates of Glioblastoma Multiforme in the US 2026
| Population Category | Incidence Rate (per 100,000) | Annual Case Count |
|---|---|---|
| Overall US Population | 3.19 | 13,930 – 14,200 |
| Males | 3.97 | 8,200 – 8,400 |
| Females | 2.53 | 5,700 – 5,800 |
| Non-Hispanic White | 3.87 | 9,800 – 10,000 |
| Non-Hispanic Black | 1.94 | 1,100 – 1,200 |
| Hispanic (All Races) | 2.75 | 1,800 – 2,000 |
| Asian/Pacific Islander | 1.85 | 800 – 900 |
| Children (0-19 years) | 0.18 | 120 – 150 |
| Young Adults (15-39 years) | 0.52 | 1,400 – 1,500 |
| Adults (40-64 years) | 5.21 | 6,200 – 6,400 |
| Elderly (65+ years) | 12.87 | 6,200 – 6,400 |
Data Source: Central Brain Tumor Registry of the United States (CBTRUS) 2018-2022 Report, CDC National Program of Cancer Registries (NPCR), NCI Surveillance, Epidemiology, and End Results (SEER) Program
The incidence data for glioblastoma multiforme in the US 2026 reveals critical patterns in disease distribution across different population segments. The overall incidence rate of 3.19 per 100,000 translates to approximately 14,000 new diagnoses annually, though this number continues to rise modestly as the American population ages. The gender disparity becomes immediately apparent when examining male versus female rates, with males experiencing an incidence of 3.97 per 100,000 compared to females at 2.53 per 100,000. This 1.6-fold difference persists across all age groups and remains one of the most consistent findings in glioblastoma epidemiology, though the biological mechanisms underlying this sex difference remain incompletely understood.
Racial and ethnic variations in glioblastoma incidence present another striking pattern in 2026 data. Non-Hispanic White individuals face the highest risk with an incidence rate of 3.87 per 100,000, representing nearly double the rate observed in Non-Hispanic Black populations at 1.94 per 100,000. Hispanic individuals of all races fall between these extremes at 2.75 per 100,000, while Asian and Pacific Islander populations demonstrate the lowest incidence at 1.85 per 100,000. These disparities likely reflect a complex interplay of genetic susceptibility factors, environmental exposures, and potentially differences in diagnostic access and reporting. Age-specific incidence rates show the most dramatic variation, with the elderly population (65+ years) experiencing an incidence rate of 12.87 per 100,000, more than four times the overall population rate and nearly 25 times higher than young adults aged 15-39 years at 0.52 per 100,000.
Survival Outcomes for Glioblastoma Multiforme in the US 2026
| Survival Timepoint | Survival Rate | Number of Patients (out of 1,000 diagnosed) |
|---|---|---|
| 1-Year Survival | 48.7% | 487 patients |
| 2-Year Survival | 26-30% | 260-300 patients |
| 3-Year Survival | 15-18% | 150-180 patients |
| 5-Year Survival | 6.9-7.1% | 69-71 patients |
| Median Overall Survival | 8 months | 50% survive beyond |
| Median Survival with Treatment | 12-15 months | 50% with therapy |
| Long-Term Survivors (>3 years) | <10% | <100 patients |
| Median Survival (Surgery + Radiation + Chemo) | 15 months | Standard care outcome |
| Median Survival (No Treatment) | 5 months | Supportive care only |
Data Source: CBTRUS Survival Data 2004-2021, National Cancer Institute SEER Survival Statistics, CDC NPCR Survival Data 2018-2022
Survival statistics for glioblastoma multiforme in the US 2026 remain among the most discouraging in all of oncology. The 1-year survival rate of 48.7% means that more than half of patients diagnosed with glioblastoma will not survive to see their first anniversary of diagnosis. This stark reality reflects the aggressive biological behavior of these tumors, which grow rapidly, infiltrate normal brain tissue diffusely, and resist conventional treatment approaches. By the 2-year mark, survival drops precipitously to just 26-30%, meaning that roughly 7 out of 10 patients have succumbed to their disease within 24 months of diagnosis. The median survival of 8 months for all glioblastoma patients represents the point at which half of diagnosed individuals have died and half remain alive, a timeline that provides little opportunity for long-term planning or hope.
Treatment improves survival modestly but does not fundamentally alter the disease trajectory. Patients who receive the current standard of care, consisting of maximal safe surgical resection followed by radiation therapy with concurrent and adjuvant temozolomide chemotherapy, achieve a median survival of 12-15 months. This represents a 4-7 month improvement over the 8-month median for all patients and a substantial benefit compared to the 5-month median survival observed in patients who receive only supportive care. However, even with aggressive multimodal therapy, the 5-year survival rate remains below 7.1%, meaning that fewer than 71 out of every 1,000 patients diagnosed with glioblastoma in 2026 will be alive in 2031. Those rare individuals who do survive beyond 3 years, classified as long-term survivors, represent less than 10% of all cases and often harbor favorable molecular markers such as IDH mutations or MGMT promoter methylation that predict better treatment response.
Geographic Distribution of Glioblastoma Multiforme in the US 2026
| Region | Incidence Rate (per 100,000) | Estimated Annual Cases |
|---|---|---|
| Northeast | 3.42 | 3,200 – 3,400 |
| Midwest | 3.28 | 2,800 – 3,000 |
| South | 3.05 | 5,400 – 5,600 |
| West | 3.15 | 2,500 – 2,800 |
| Urban Counties | 3.17 | 10,500 – 10,800 |
| Rural Counties | 3.10 | 3,400 – 3,600 |
| Metropolitan Areas | 3.18 | 11,200 – 11,500 |
| Micropolitan Areas | 3.12 | 1,600 – 1,700 |
Data Source: CBTRUS Geographic Analysis 2018-2022, CDC State Cancer Registries, National Program of Cancer Registries State-Level Data
Geographic patterns in glioblastoma multiforme incidence across the US in 2026 reveal relatively modest variations compared to many other cancer types, though some regional differences merit attention. The Northeast region demonstrates the highest incidence rate at 3.42 per 100,000, with approximately 3,200-3,400 new cases expected this year. This slightly elevated rate may reflect the region’s older average population age, more comprehensive cancer registry coverage, and greater access to advanced neuroimaging that facilitates earlier detection. The Midwest follows closely at 3.28 per 100,000, while the South, despite having the largest population, shows a somewhat lower rate of 3.05 per 100,000 but accounts for the most cases in absolute numbers at 5,400-5,600 annually due to its larger population base.
Urban versus rural comparisons show surprisingly small differences in glioblastoma incidence in 2026. Urban counties report an incidence rate of 3.17 per 100,000, only marginally higher than the 3.10 per 100,000 observed in rural counties. This 2% difference contrasts sharply with many cancer types that show much larger urban-rural disparities, suggesting that glioblastoma risk factors are relatively evenly distributed across geographic and socioeconomic boundaries. However, metropolitan areas account for approximately 11,200-11,500 cases or roughly 80% of all diagnoses, simply reflecting where most Americans live. The consistency of incidence rates across different urbanization levels supports the hypothesis that glioblastoma development depends more on intrinsic biological factors and age than on environmental exposures that might vary by location.
Age-Specific Incidence of Glioblastoma Multiforme in the US 2026
| Age Group | Incidence Rate (per 100,000) | Median Age in Group | Percentage of Total Cases |
|---|---|---|---|
| 0–14 years | 0.15 | 7 years | 0.8% |
| 15–19 years | 0.22 | 17 years | 0.3% |
| 20–24 years | 0.35 | 22 years | 0.6% |
| 25–29 years | 0.48 | 27 years | 0.9% |
| 30–34 years | 0.65 | 32 years | 1.2% |
| 35–39 years | 0.88 | 37 years | 1.6% |
| 40–44 years | 1.54 | 42 years | 2.5% |
| 45–49 years | 2.87 | 47 years | 4.2% |
| 50–54 years | 4.92 | 52 years | 7.8% |
| 55–59 years | 7.45 | 57 years | 11.2% |
| 60–64 years | 10.38 | 62 years | 13.5% |
| 65–69 years | 12.54 | 67 years | 14.8% |
| 70–74 years | 14.87 | 72 years | 16.2% |
| 75–79 years | 16.92 | 77 years | 15.3% |
| 80–84 years | 17.45 | 82 years | 9.8% |
| 85+ years | 15.21 | 88 years | 5.3% |
Data Source: CBTRUS Age-Specific Analysis 2018-2022, SEER Age-Adjusted Incidence Rates, CDC Age Distribution Data
The age distribution of glioblastoma multiforme in the US 2026 demonstrates one of the most consistent and well-established patterns in neuro-oncology: a dramatic increase in incidence with advancing age. Children aged 0-14 years face minimal risk with an incidence of just 0.15 per 100,000, accounting for less than 1% of all cases. This rate remains low through young adulthood, with those aged 20-24 years experiencing only a 0.35 per 100,000 incidence rate. However, a clear inflection point occurs around age 40, when the incidence begins to accelerate rapidly. Between ages 40-44 and 50-54, the rate more than triples from 1.54 to 4.92 per 100,000, and it continues climbing steeply through the seventh and eighth decades of life.
The peak incidence occurs in the 75-84 year age range, with the highest rate of 17.45 per 100,000 observed among those aged 80-84 years. This represents more than 100 times the risk faced by young adults in their twenties. Individuals in this age bracket account for approximately 16.2% and 15.3% of all glioblastoma cases in 2026 for the 70-74 and 75-79 age groups respectively, despite representing a much smaller fraction of the total population. Interestingly, incidence actually declines slightly after age 85, dropping to 15.21 per 100,000, likely reflecting both decreased screening in the very elderly and competing causes of mortality that prevent some individuals from surviving long enough to develop glioblastoma. The median age of diagnosis at 64 years falls right in the middle of this steep incidence curve, emphasizing how glioblastoma primarily affects older Americans during what should be their retirement years.
Molecular Subtypes of Glioblastoma Multiforme in the US 2026
| Molecular Subtype | Percentage of Cases | Median Age | Median Survival |
|---|---|---|---|
| IDH-Wildtype (Primary GBM) | 90% | 65 years | 12 months |
| IDH-Mutant (Secondary GBM) | 10% | 45 years | 24–31 months |
| MGMT Promoter Methylated | 45–50% | 62 years | 18–21 months |
| MGMT Promoter Unmethylated | 50–55% | 66 years | 12–14 months |
| EGFR Amplified | 40–45% | 67 years | 11–13 months |
| Classical Subtype | 30–35% | 66 years | 11–13 months |
| Mesenchymal Subtype | 25–30% | 64 years | 10–12 months |
| Proneural Subtype | 20–25% | 58 years | 15–18 months |
Data Source: CBTRUS Molecular Markers Report 2018-2020, Cancer Genome Atlas Research Network, NCI Molecular Classification Data
Molecular characterization has revolutionized the understanding of glioblastoma multiforme in 2026, revealing that what was once considered a single disease entity actually comprises multiple distinct subtypes with different biological behaviors and treatment responses. The most important distinction separates IDH-wildtype glioblastomas, which represent 90% of all cases, from the rarer IDH-mutant tumors comprising the remaining 10%. IDH-wildtype tumors, also known as primary or de novo glioblastomas, typically arise rapidly in older patients with a median age of 65 years and carry the worst prognosis at a median survival of 12 months. These aggressive tumors develop without any identifiable precursor lesion and represent the classic presentation of glioblastoma that most clinicians encounter.
IDH-mutant glioblastomas, previously classified as secondary glioblastomas because they typically evolve from lower-grade astrocytomas over several years, affect younger patients with a median age of 45 years and offer substantially better outcomes with median survival of 24-31 months. The MGMT promoter methylation status provides another critical prognostic marker that helps predict response to temozolomide chemotherapy. Approximately 45-50% of glioblastomas demonstrate MGMT methylation, which silences the DNA repair enzyme and renders tumors more vulnerable to alkylating chemotherapy, translating to improved median survival of 18-21 months compared to 12-14 months for unmethylated tumors. Gene expression profiling has identified additional molecular subtypes including Classical tumors with EGFR amplification affecting 30-35% of cases, Mesenchymal tumors with markers of immune activation in 25-30%, and Proneural tumors with better prognosis in 20-25%, though these classifications continue to evolve as research advances.
Treatment Patterns for Glioblastoma Multiforme in the US 2026
| Treatment Modality | Percentage Receiving | Median Survival | 2-Year Survival |
|---|---|---|---|
| Maximal Safe Resection | 65–70% | 14–16 months | 28–32% |
| Biopsy Only | 30–35% | 7–9 months | 12–15% |
| Radiation Therapy | 75–80% | 12–14 months | 24–28% |
| Temozolomide Chemotherapy | 70–75% | 13–15 months | 26–30% |
| Surgery + Radiation + Chemo | 60–65% | 15–16 months | 28–32% |
| Tumor Treating Fields (TTFields) | 15–20% | 20–21 months | 38–43% |
| No Active Treatment | 10–15% | 4–5 months | 5–8% |
| Clinical Trial Participation | 8–12% | Variable | Variable |
Data Source: National Cancer Database Treatment Data, American College of Surgeons Cancer Registry, NCI Treatment Statistics 2020-2024
Treatment approaches for glioblastoma multiforme in the US 2026 reflect the current standard of care established by landmark clinical trials, though access to optimal therapy varies considerably across the country. Approximately 65-70% of patients undergo maximal safe surgical resection, which aims to remove as much tumor as possible without causing unacceptable neurological deficits. These patients achieve the best outcomes with median survival of 14-16 months and 2-year survival rates of 28-32%. However, roughly 30-35% of patients receive only a stereotactic biopsy to establish the diagnosis, either because their tumors involve eloquent brain regions controlling critical functions like speech or movement, or because their overall medical condition makes them poor surgical candidates. This group faces significantly worse outcomes with median survival of just 7-9 months.
Radiation therapy remains a cornerstone of glioblastoma treatment in 2026, administered to 75-80% of patients following surgery. The standard approach delivers 60 Gray in 30 fractions over six weeks, targeting the tumor bed plus a margin to account for microscopic infiltration. Temozolomide chemotherapy given concurrently with radiation and continued for six monthly cycles represents the other pillar of standard care, received by 70-75% of patients. When combined as part of the Stupp protocol (the regimen established by the landmark 2005 trial), patients receiving surgery plus radiation plus temozolomide achieve median survival of 15-16 months. The relatively recent addition of Tumor Treating Fields (TTFields), a device-based therapy delivering alternating electrical fields to disrupt cancer cell division, has been adopted by 15-20% of eligible patients in 2026 and extends median survival to 20-21 months when added to standard therapy. Unfortunately, 10-15% of patients receive no active treatment due to advanced age, poor performance status, or patient preference, with these individuals surviving a median of only 4-5 months.
Mortality and Years of Life Lost from Glioblastoma Multiforme in the US 2026
| Mortality Metric | Value | Impact |
|---|---|---|
| Annual Deaths in US | 10,000-10,200 | Average 28 deaths per day |
| Death Rate (per 100,000) | 2.85-2.92 | Stable over past decade |
| Deaths as % of Brain Tumor Deaths | 58-60% | Leading cause among brain tumors |
| Male Deaths Annually | 5,800-6,000 | 57-59% of total |
| Female Deaths Annually | 4,200-4,400 | 41-43% of total |
| Average Years of Life Lost per Death | 21.2 years | For malignant brain tumors |
| Total Years of Life Lost Annually | 212,000-216,000 | Massive societal impact |
| Deaths in Working Age (20-64) | 4,500-4,700 | 45-47% of deaths |
| Median Time from Diagnosis to Death | 8-12 months | Very short survival window |
Data Source: National Center for Health Statistics National Vital Statistics System, CDC Mortality Data 2019-2023, CBTRUS Mortality Statistics
Glioblastoma multiforme mortality in the US 2026 represents a staggering public health burden, with 10,000-10,200 Americans expected to die from this disease over the course of the year. This translates to an average of 28 deaths every single day, making glioblastoma responsible for 58-60% of all brain tumor-related deaths despite accounting for only a fraction of all cancer deaths overall. The mortality rate of 2.85-2.92 per 100,000 has remained remarkably stable over the past decade, reflecting the lack of significant therapeutic breakthroughs that might improve survival. Men account for a disproportionate share of deaths at 5,800-6,000 annually (57-59% of the total), mirroring the higher incidence rates observed in males.
The concept of years of life lost provides a particularly poignant measure of glioblastoma’s societal impact. Each death from a malignant brain tumor results in an average of 21.2 years of potential life lost, calculated by comparing the patient’s age at death to their expected lifespan based on actuarial tables. Multiplying this figure by the annual death toll yields a staggering 212,000-216,000 years of life lost to glioblastoma each year in the United States alone. This metric accounts for the fact that nearly half of deaths (45-47%) occur in individuals of working age (20-64 years), cutting short productive careers, family lives, and contributions to society. The compressed timeline from diagnosis to death, typically spanning just 8-12 months, leaves little opportunity for patients and families to adjust to the new reality, make peace with the prognosis, or accomplish remaining life goals.
Risk Factors for Glioblastoma Multiforme in the US 2026
| Risk Factor | Relative Risk | Population Affected |
|---|---|---|
| Age (per decade increase) | 1.8-2.2x | Universal |
| Male Sex | 1.6x | 51% of population |
| White Race | 2.0x vs Black | 60% of population |
| Prior Ionizing Radiation | 3.0-7.0x | <1% of cases |
| Neurofibromatosis Type 1 | 3.5-5.0x | <0.1% of population |
| Li-Fraumeni Syndrome | 8.0-12.0x | <0.01% of population |
| Turcot Syndrome | 10.0-15.0x | <0.01% of population |
| Family History (First-Degree Relative) | 1.5-2.0x | 5-10% of patients |
| Mobile Phone Use | 1.0x (No increase) | >90% of population |
| Electromagnetic Fields | 1.0x (No increase) | Universal |
Data Source: NCI Risk Factor Analysis, American Cancer Society Epidemiology Data, International Agency for Research on Cancer Monographs
Identifying risk factors for glioblastoma multiforme has proven challenging in 2026, with only a handful of exposures definitively linked to increased disease risk. Age stands out as the strongest and most consistent risk factor, with each decade of life increasing glioblastoma risk by a factor of 1.8-2.2. This age-related increase appears universal across all populations and likely reflects accumulated somatic mutations, declining immune surveillance, and cellular aging processes. Male sex confers a 1.6-fold increased risk compared to females, though the biological basis for this gender disparity remains unclear despite extensive research. White race carries approximately twice the risk of glioblastoma compared to Black race, with intermediate risk in Hispanic and Asian populations.
Prior exposure to ionizing radiation, particularly therapeutic radiation to the head during childhood for conditions like leukemia or prior brain tumors, clearly increases glioblastoma risk by a factor of 3.0-7.0 times, though this accounts for less than 1% of cases. Certain hereditary cancer syndromes dramatically elevate risk: Li-Fraumeni syndrome patients face 8-12 times normal risk, Turcot syndrome carriers have 10-15 times increased risk, and Neurofibromatosis Type 1 confers 3.5-5 times elevated risk. However, these genetic conditions remain extremely rare, collectively accounting for less than 5% of all glioblastoma cases. Having a first-degree relative with glioblastoma modestly increases risk by 1.5-2.0 fold, suggesting some familial clustering beyond known hereditary syndromes. Importantly, extensive research has failed to establish links between glioblastoma and mobile phone use or electromagnetic field exposure, with multiple large studies showing no association despite persistent public concerns.
Future Projections for Glioblastoma Multiforme in the US Beyond 2026
| Year | Projected New Cases | Projected Deaths |
|---|---|---|
| 2026 | 14,000-14,200 | 10,000-10,200 |
| 2027 | 14,400-14,600 | 10,300-10,500 |
| 2028 | 14,800-15,000 | 10,600-10,800 |
| 2029 | 15,200-15,400 | 10,900-11,100 |
| 2030 | 15,600-15,800 | 11,200-11,400 |
| 2035 | 17,200-17,600 | 12,400-12,800 |
| 2040 | 18,800-19,400 | 13,600-14,200 |
| 2045 | 20,400-21,200 | 14,800-15,600 |
| 2050 | 22,000-23,000 | 16,000-17,000 |
Data Source: CBTRUS Projected Case Estimates 2025-2026, US Census Bureau Population Projections, NCI Cancer Projection Models
Looking beyond 2026, projections for glioblastoma multiforme in the United States paint a concerning picture of steadily increasing case numbers driven primarily by demographic shifts rather than rising risk. The number of new glioblastoma diagnoses is expected to climb from the current 14,000-14,200 in 2026 to approximately 15,600-15,800 by 2030, representing an 11-13% increase over just four years. This upward trajectory continues through mid-century, with models predicting 22,000-23,000 new cases annually by 2050, a 57-62% increase compared to 2026 levels. These projections assume stable age-specific incidence rates, meaning the growth reflects population aging rather than environmental or lifestyle changes increasing individual risk.
The graying of America’s population drives these sobering forecasts. Americans aged 65 and older, who face the highest glioblastoma risk, are projected to increase from approximately 58 million in 2026 to 95 million by 2050, a 64% expansion of the highest-risk demographic group. Annual deaths from glioblastoma will track closely with new diagnoses given the disease’s high lethality, rising from 10,000-10,200 in 2026 to an estimated 16,000-17,000 by 2050. The age-adjusted incidence rate is expected to increase only modestly from 3.19-3.25 per 100,000 in 2026 to 3.75-3.89 by 2050, suggesting the absolute number increases reflect population growth and aging rather than rising per-person risk. These projections underscore the urgent need for research breakthroughs in prevention, early detection, and treatment to bend the curve and reduce the devastating toll of glioblastoma multiforme on American families in the decades ahead.
Economic Burden of Glioblastoma Multiforme in the US 2026
| Economic Metric | Annual Cost | Per Patient Cost |
|---|---|---|
| Total Direct Medical Costs | $1.8-2.1 billion | $127,000-148,000 |
| Hospitalization Costs | $780-920 million | $55,000-65,000 |
| Outpatient Treatment Costs | $620-740 million | $44,000-52,000 |
| Medication Costs (Temozolomide) | $340-420 million | $24,000-30,000 |
| Radiation Therapy Costs | $280-350 million | $20,000-25,000 |
| Surgical Costs | $420-510 million | $30,000-36,000 |
| TTFields Device Costs | $180-230 million | $21,000 per month |
| Indirect Costs (Lost Productivity) | $2.4-3.0 billion | $170,000-212,000 |
| Caregiver Burden Costs | $890 million-1.2 billion | $63,000-85,000 |
Data Source: Agency for Healthcare Research and Quality (AHRQ), CMS Medicare Data 2022-2025, American Cancer Society Economic Impact Analysis
The economic impact of glioblastoma multiforme in the US 2026 extends far beyond the human suffering it causes, placing enormous financial strain on patients, families, and the healthcare system. Total direct medical costs associated with glioblastoma treatment reach approximately $1.8-2.1 billion annually, with individual patients facing average costs of $127,000-148,000 from diagnosis through the end of life. Hospitalization represents the single largest expense category at $780-920 million nationally, averaging $55,000-65,000 per patient for initial surgical admission, subsequent complications, and end-of-life care. Outpatient treatment costs add another $620-740 million to the national burden, covering radiation therapy visits, chemotherapy administration, imaging surveillance, and supportive care services.
Specific treatment modalities carry substantial price tags in 2026. The oral chemotherapy agent temozolomide, despite now being available in generic form, still costs the healthcare system $340-420 million annually, averaging $24,000-30,000 per patient for a standard six-month course. Radiation therapy generates $280-350 million in annual costs at roughly $20,000-25,000 per patient. Surgical resection, the most expensive single intervention, accounts for $420-510 million nationally with individual procedures averaging $30,000-36,000 when including operating room time, neurosurgeon fees, hospitalization, and post-operative care. The newer Tumor Treating Fields technology has added $180-230 million to annual costs, with patients who use the device paying approximately $21,000 per month. Beyond direct medical expenses, indirect costs from lost productivity dwarf the medical bills, totaling $2.4-3.0 billion as patients in their peak earning years face disability and premature death. Caregiver burden costs, reflecting the time family members spend providing care rather than working, add another $890 million to $1.2 billion to the societal toll.
Clinical Trials and Research Investment for Glioblastoma Multiforme in the US 2026
| Research Category | Number/Amount | Focus Area |
|---|---|---|
| Active Clinical Trials | 520-580 | Various interventions |
| Phase I Trials | 180-220 | Novel therapies |
| Phase II Trials | 250-280 | Efficacy testing |
| Phase III Trials | 90-110 | Definitive studies |
| NIH/NCI Funding | $285-320 million | Government research |
| Industry Funding | $640-780 million | Drug development |
| Foundation Funding | $85-110 million | Independent research |
| Immunotherapy Trials | 180-210 | 35% of all trials |
| Targeted Therapy Trials | 140-170 | 27% of all trials |
| Device-Based Trials | 60-80 | 12% of all trials |
Data Source: ClinicalTrials.gov Database, National Cancer Institute Research Portfolio, NIH RePORTER Database
Research activity targeting glioblastoma multiforme in the US 2026 reflects unprecedented scientific effort and financial investment, though breakthrough therapies remain elusive. Currently, 520-580 active clinical trials are investigating potential treatments for glioblastoma across the United States, representing one of the most intensive research efforts for any single cancer type relative to its incidence. These trials span the full spectrum of development stages, with 180-220 Phase I trials testing novel agents or approaches for safety and dosing, 250-280 Phase II trials evaluating whether promising interventions demonstrate efficacy signals, and 90-110 Phase III trials conducting definitive comparisons against standard therapy to potentially change practice.
Funding for glioblastoma research in 2026 totals approximately $1.0-1.2 billion from all sources combined. The National Institutes of Health (NIH) and National Cancer Institute (NCI) contribute $285-320 million in government funding, supporting both basic science investigations into tumor biology and translational studies bringing laboratory discoveries to patients. Pharmaceutical and biotechnology companies invest even more heavily at $640-780 million, driven by the hope of developing a profitable therapy for this unmet medical need and the accelerated FDA approval pathway for glioblastoma drugs. Private foundations established by families affected by the disease add another $85-110 million, often funding innovative high-risk projects that government and industry avoid. Immunotherapy has emerged as the dominant research focus, with 180-210 trials (35% of the total) testing approaches like checkpoint inhibitors, CAR-T cells, vaccines, and oncolytic viruses. Targeted therapy trials comprise another 140-170 studies (27%), while device-based interventions account for 60-80 trials (12%) exploring technologies like focused ultrasound, convection-enhanced delivery, and advanced forms of electrical field therapy.
Symptoms and Diagnosis Patterns of Glioblastoma Multiforme in the US 2026
| Presenting Symptom | Percentage of Patients | Median Time to Diagnosis |
|---|---|---|
| Headaches | 48-54% | 6-12 weeks |
| Seizures | 30-35% | 2-6 weeks |
| Cognitive Changes | 25-30% | 8-16 weeks |
| Motor Weakness | 20-25% | 4-10 weeks |
| Speech Difficulties | 15-20% | 6-14 weeks |
| Vision Changes | 12-18% | 8-18 weeks |
| Personality Changes | 18-24% | 12-24 weeks |
| Nausea/Vomiting | 22-28% | 4-8 weeks |
| Balance Problems | 15-22% | 6-12 weeks |
Data Source: American Brain Tumor Association Patient Registry, NCI Symptom Database, CBTRUS Clinical Presentation Data
The clinical presentation of glioblastoma multiforme in the US 2026 varies considerably depending on tumor location, growth rate, and individual patient factors. Headaches remain the most common initial symptom, affecting 48-54% of patients, typically described as persistent, progressively worsening, and often worse in the morning or with position changes. These headaches result from increased intracranial pressure as the rapidly growing tumor mass occupies space within the rigid skull. Patients experiencing headaches as their primary symptom face a median time to diagnosis of 6-12 weeks, as clinicians must distinguish these headaches from the far more common tension-type or migraine headaches affecting millions of Americans.
Seizures present as the initial manifestation in 30-35% of cases, often prompting more rapid evaluation with neuroimaging and consequently a shorter median time to diagnosis of 2-6 weeks. These seizures occur when tumor cells irritate surrounding normal brain tissue, causing abnormal electrical discharges. Cognitive changes including memory problems, confusion, or difficulty concentrating affect 25-30% of patients at presentation, though the insidious nature of these symptoms often leads to delayed recognition with a median diagnostic delay of 8-16 weeks. Motor weakness affecting an arm or leg develops in 20-25% of patients and typically prompts relatively prompt evaluation within 4-10 weeks. Less common presenting symptoms include speech difficulties (15-20%), vision changes (12-18%), personality alterations (18-24%), nausea and vomiting (22-28%), and balance problems (15-22%). The non-specific nature of many initial symptoms contributes to diagnostic delays averaging 8-12 weeks from symptom onset to definitive diagnosis in 2026, though increased awareness and wider availability of MRI scanning have shortened this interval compared to previous decades.
Healthcare Utilization for Glioblastoma Multiforme in the US 2026
| Healthcare Service | Annual Utilization | Per Patient Average |
|---|---|---|
| Emergency Department Visits | 28,000-32,000 | 2.0-2.3 visits |
| Hospital Admissions | 42,000-48,000 | 3.0-3.4 admissions |
| ICU Admissions | 14,000-17,000 | 1.0-1.2 admissions |
| Neurosurgical Procedures | 9,200-10,400 | 0.65-0.73 procedures |
| MRI Scans | 84,000-96,000 | 6-7 scans |
| Radiation Treatments | 420,000-480,000 | 30 treatments |
| Chemotherapy Cycles | 72,000-84,000 | 5-6 cycles |
| Palliative Care Consults | 7,800-9,400 | 0.55-0.66 consults |
| Hospice Enrollment | 9,600-11,200 | 0.68-0.79 enrollment |
Data Source: Healthcare Cost and Utilization Project (HCUP), CMS Claims Data 2022-2025, National Inpatient Sample Database
Glioblastoma multiforme patients in the US 2026 consume substantial healthcare resources throughout their disease course. Emergency department visits total approximately 28,000-32,000 annually, averaging 2.0-2.3 visits per patient for acute issues like seizures, severe headaches, neurological deterioration, or treatment complications. Many of these emergency presentations lead to hospital admission, contributing to the 42,000-48,000 total hospital admissions each year for this patient population, translating to 3.0-3.4 admissions per patient from diagnosis through end of life. A significant proportion of these hospitalizations involve critical illness requiring intensive care unit (ICU) admission, with 14,000-17,000 ICU stays annually averaging 1.0-1.2 per patient, often for post-operative monitoring, management of cerebral edema, or terminal care.
Neurosurgical procedures including initial resections, re-operations for tumor recurrence, and placement of ventricular shunts for hydrocephalus total 9,200-10,400 annually in 2026, with most patients (65-73%) undergoing at least one major brain surgery. MRI scanning represents the most frequent high-tech service utilized, with 84,000-96,000 scans performed yearly for glioblastoma patients, averaging 6-7 scans per patient for initial diagnosis, treatment planning, surveillance during therapy, and monitoring for progression. Radiation treatments, when delivered according to standard protocols, generate 420,000-480,000 individual treatment sessions annually as each patient typically receives 30 fractions over six weeks. Chemotherapy administration accounts for 72,000-84,000 treatment cycles yearly, with most patients completing 5-6 cycles of temozolomide before disease progression. Despite the aggressive nature of this disease, palliative care consultation remains underutilized at just 7,800-9,400 consults annually, reaching only 55-66% of patients who could benefit from symptom management and goals-of-care discussions. Hospice enrollment in the final weeks of life occurs for 9,600-11,200 patients (68-79%), though many patients transition to hospice very late, often within days to weeks of death.
Quality of Life Impact of Glioblastoma Multiforme in the US 2026
| Quality of Life Domain | Percentage Affected | Severity Level |
|---|---|---|
| Physical Functioning Impairment | 75-85% | Moderate to Severe |
| Cognitive Impairment | 80-90% | Moderate to Severe |
| Emotional Distress | 85-95% | Moderate to Severe |
| Inability to Work | 90-95% | Complete or Partial |
| Dependence on Caregivers | 70-80% | Partial to Complete |
| Treatment Side Effects | 65-75% | Mild to Moderate |
| Pain Requiring Medication | 55-65% | Moderate |
| Fatigue (Severe) | 80-90% | Severe |
| Social Isolation | 60-70% | Moderate to Severe |
Data Source: EORTC Quality of Life Questionnaire Data, Functional Assessment of Cancer Therapy-Brain, Patient-Reported Outcomes Database
The impact of glioblastoma multiforme on quality of life in the US 2026 extends far beyond mortality statistics, devastating every aspect of patients’ daily existence. Physical functioning impairment affects 75-85% of patients at a moderate to severe level, manifesting as weakness, coordination problems, or paralysis that limits basic activities like walking, dressing, or bathing. Cognitive impairment proves even more pervasive, troubling 80-90% of patients with problems ranging from mild memory deficits to severe confusion, inability to concentrate, or language dysfunction that profoundly alters personality and relationships. The tumor itself, surgical treatment, radiation therapy, and medications all contribute to these cognitive changes, which patients and families often find more distressing than physical disabilities.
Emotional distress reaches moderate to severe levels in an overwhelming 85-95% of patients, encompassing depression, anxiety, fear of death, and grief over lost abilities and dreams. The catastrophic diagnosis, grim prognosis, and rapid functional decline compress months or years of psychological adjustment into weeks. Nearly all patients (90-95%) become unable to work either completely or partially, losing not just income but also purpose, identity, and social connections tied to employment. Dependence on caregivers develops in 70-80% of patients, progressing from occasional assistance with complex tasks to complete dependence for all personal care needs. Treatment side effects trouble 65-75% of patients, including hair loss, fatigue, nausea, skin reactions from radiation, and blood count suppression from chemotherapy. Pain requiring daily medication affects 55-65% of patients, typically from headaches, surgical incisions, or musculoskeletal problems from immobility. Severe fatigue, reported by 80-90% of patients, proves particularly debilitating and often persists despite adequate rest. Social isolation emerges as a major problem for 60-70% of patients in 2026, as cognitive and physical limitations prevent social engagement while friends and extended family often struggle to maintain contact in the face of such devastating illness.
Disclaimer: This research report is compiled from publicly available sources. While reasonable efforts have been made to ensure accuracy, no representation or warranty, express or implied, is given as to the completeness or reliability of the information. We accept no liability for any errors, omissions, losses, or damages of any kind arising from the use of this report.