In today’s data-driven marketing landscape, understanding user behavior and campaign performance is paramount. With the advent of Google Analytics 4 (GA4) and its seamless integration with Looker Studio (formerly Google Data Studio), marketers have powerful tools at their disposal to visualize and interpret data effectively.
Let’s see the top five GA4 Looker Studio dashboards that every marketer should consider utilizing to enhance their analytical capabilities and drive informed decisions.
1. All-in-One Marketing Performance Dashboard
Overview:
This comprehensive dashboard amalgamates data from GA4, Google Ads, and Google Search Console, providing a holistic view of your marketing efforts. It streamlines the analysis process by consolidating key metrics into a single interface.
Key Features:
- Traffic Analysis: Monitor user sessions, bounce rates, and engagement metrics.
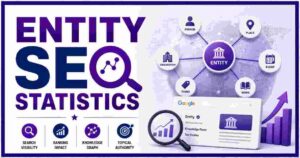
- SEO Insights: Track keyword rankings, click-through rates, and impressions from Search Console.
- PPC Performance: Evaluate ad spend, conversions, and ROI from Google Ads.
- Customizable Filters: Segment data by device, geography, or user demographics.
Benefits:
By centralizing data, this dashboard eliminates the need to toggle between platforms, saving time and reducing the risk of data discrepancies. It’s particularly beneficial for marketers overseeing multi-channel campaigns.
Example Use Case:
A digital marketing agency managing various clients can utilize this dashboard to present consolidated reports, showcasing the interplay between organic and paid strategies.
2. E-commerce Conversion Funnel Dashboard
Overview:
Tailored for online retailers, this dashboard visualizes the customer journey from initial site visit to purchase, highlighting potential drop-off points and opportunities for optimization.
Key Features:
- Funnel Visualization: Track user progression through stages like product view, add to cart, checkout initiation, and purchase.
- Revenue Metrics: Analyze average order value, total revenue, and conversion rates.
- Product Performance: Identify top-selling products and categories.
- Cart Abandonment Rates: Understand where users exit the purchasing process.
Benefits:
By pinpointing stages with high abandonment rates, marketers can implement targeted strategies to improve user experience and increase conversions.
Example Use Case:
An e-commerce manager notices a significant drop-off at the checkout stage. By analyzing the dashboard, they identify a cumbersome payment process and streamline it, leading to improved conversion rates.
3. Content Engagement and SEO Dashboard
Overview:
This dashboard focuses on content performance, merging data from GA4 and Google Search Console to provide insights into user engagement and organic search visibility.
Key Features:
- Page Performance: Monitor metrics like time on page, bounce rate, and scroll depth.
- Keyword Analysis: Track organic keywords driving traffic and their respective rankings.
- Backlink Overview: Assess the impact of inbound links on content performance.
- User Demographics: Understand the audience engaging with specific content pieces.
Benefits:
Content marketers can gauge the effectiveness of their strategies, identify high-performing topics, and uncover areas needing improvement.
Example Use Case:
A content strategist observes that blog posts optimized for specific long-tail keywords have higher engagement rates. This insight informs future content planning and SEO efforts.
4. Multi-Channel Attribution Dashboard
Overview:
Understanding the customer journey across various touchpoints is crucial. This dashboard provides insights into how different channels contribute to conversions, aiding in budget allocation and strategy refinement.
Key Features:
- Attribution Models: Compare first-click, last-click, and linear attribution to understand channel impact.
- Channel Performance: Evaluate metrics across email, social media, paid search, and organic traffic.
- Conversion Paths: Visualize common user paths leading to conversions.
- Time Lag Analysis: Determine the average time between initial interaction and conversion.
Benefits:
Marketers can identify undervalued channels and adjust strategies to ensure optimal resource distribution.
Example Use Case:
A marketing team discovers that while social media has a low last-click conversion rate, it’s instrumental in initiating user journeys. Recognizing its role, they allocate more budget to social campaigns.
5. Real-Time Website Monitoring Dashboard
Overview:
For campaigns requiring immediate feedback, this dashboard offers real-time data on website activity, enabling swift responses to user behavior.
Key Features:
- Live User Count: Monitor the number of active users on the site.
- Traffic Sources: Identify where current visitors are coming from.
- Top Active Pages: See which pages are being viewed most frequently.
- Event Tracking: Observe real-time interactions like clicks, downloads, or form submissions.
Benefits:
Real-time insights allow for prompt adjustments to campaigns, website elements, or content based on user activity.
Example Use Case:
During a product launch, a company uses this dashboard to monitor traffic spikes and user engagement, allowing them to address any issues instantly and optimize the user experience.