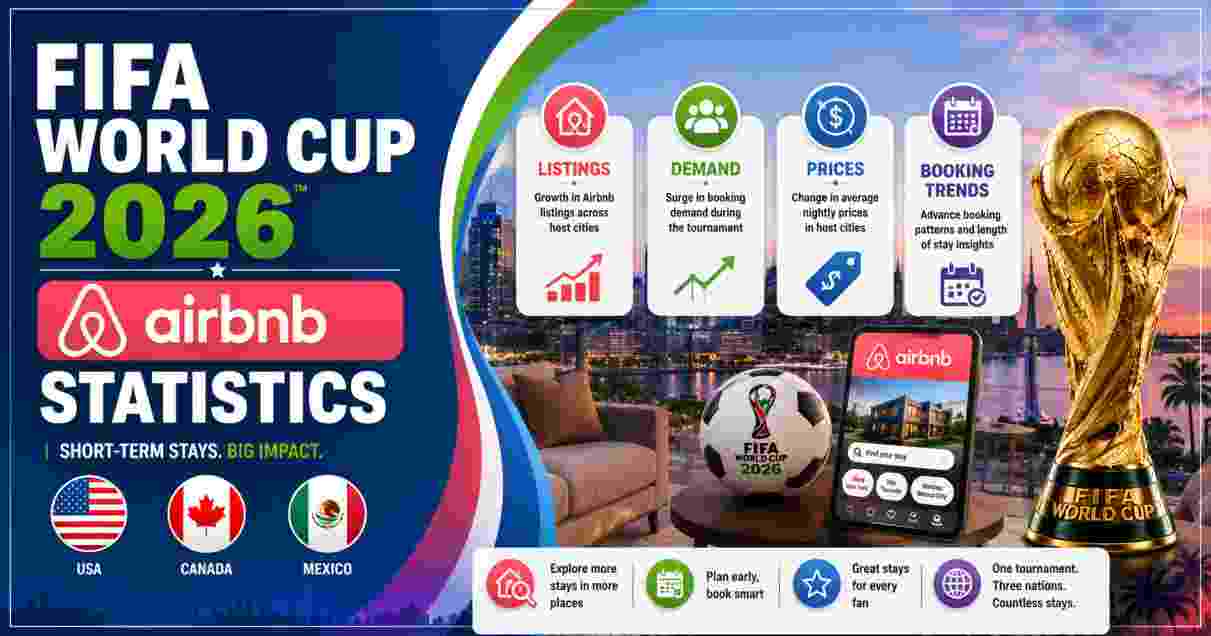
FIFA World Cup 2026 Airbnb Statistics
The FIFA World Cup 2026 has not just rewritten the records for the world’s most popular sporting event — it has rewritten the record books for the world’s most popular home-sharing platform. Airbnb confirmed in May 2026 that the FIFA World Cup 2026 is the biggest hosting event in company history, surpassing the 2024 Paris Olympic and Paralympic Games. The numbers are substantial: over 382,000 Airbnb guests are expected to travel for the tournament across 16 host cities in the US, Canada, and Mexico — including more than 150,000 from the United States alone. Searches for host city stays were already up 80% year-over-year before kick-off. Around 1 in 6 guests booking tournament stays is a first-time Airbnb user, and over 100,000 homes have listed in host cities for the first time since outreach began in October 2025. According to a Deloitte economic analysis commissioned by Airbnb, World Cup stays are projected to contribute $3.6 billion to host city economies, with hosts across 16 cities earning up to $210 million collectively.
The broader accommodation story is more complex than those headline projections suggest. Nearly 80% of hotels across the 11 US World Cup host cities reported bookings below initial forecasts a month before kick-off, per an American Hotel & Lodging Association (AHLA) survey of 200+ properties. Contributing factors include visa difficulties, a strong US dollar, geopolitical headwinds, and high ticket prices dampening attendance appetite. In those same cities, AirROI pacing data showed STR fill rates surging 100–187% above baseline during match weeks. The accommodation divergence between hotels and Airbnb at this World Cup reflects a structural realignment in how sports travellers choose to stay — groups and families increasingly prefer a home near the stadium over multiple hotel rooms at comparable or higher cost.
Interesting Facts: FIFA World Cup 2026 Airbnb Statistics
| Fact | Figure |
|---|---|
| Airbnb World Cup 2026 designation | Biggest hosting event in Airbnb history |
| Previous biggest Airbnb event | 2024 Paris Olympic and Paralympic Games |
| Total expected Airbnb guests during tournament | 382,000+ |
| US guests expected on Airbnb | 150,000+ |
| Airbnb searches in host cities (vs same period last year) | Up 80% |
| New homes listed in host cities since October 2025 | 100,000+ |
| First-time Airbnb users among tournament guests | ~1 in 6 |
| Projected total host earnings — US cities (Deloitte) | $156 million |
| Average host earnings across US host cities (Deloitte) | $4,000 per host |
| Average nightly rate across US host cities (Deloitte) | $262 per night |
| Projected Airbnb contribution to host city economies | $3.6 billion |
| Total STR-related guest spending, US host cities (Deloitte) | $865 million |
| Average nightly rate surge vs typical summer travel | +90% |
| Listings under $500/night as of late February 2026 | ~80% of available listings |
| New host incentive — US and Mexico cities | $750 per new entire-home host |
| New host incentive — Canadian cities | $1,000 CAD (~$730 USD) |
| Incentive deadline | July 31, 2026 |
| Group stage match-day ADR premium (AirROI) | 40–65% above baseline |
| Hotels reporting below-forecast occupancy (AHLA survey) | ~80% of 200+ surveyed |
| FIFA hotel cancellations — Philadelphia alone | 2,000 reservations |
| FIFA hotel cancellations — Vancouver | 15,000 nights |
| State Dept estimate of international visitors to US | Up to 10 million |
Source: Airbnb Press Releases — “FIFA World Cup 2026 Set to Be Airbnb’s Biggest-Ever Event” (May 7, 2026); “Airbnb Launches Host Earnings Calculator for FIFA World Cup 2026” (April 15, 2026); “Airbnb Is Offering $750 to New Hosts” (February 19, 2026); Deloitte Economic Analysis commissioned by Airbnb, 2026; AirROI World Cup 2026 Airbnb Host Earnings Report (May 2026); American Hotel & Lodging Association survey, reported May 2026; AirDNA World Cup demand data; Newsweek, June 2026
The contrast between $3.6 billion in projected Airbnb economic contribution and the $865 million in direct STR guest spending requires brief clarification. The larger figure is the full economic multiplier — accommodation spend flowing through to restaurants, transport, entertainment, and retail. The $865 million is direct accommodation spend at US short-term rentals only. Both come from the same Deloitte study commissioned by Airbnb, modelled from the 2022 World Cup, the 2024 Paris Olympics, and 2026 forward-booking signals. The study projected $212 million in total Airbnb host earnings — a figure AirROI believes will be exceeded given stronger-than-projected booking rates in Boston and Kansas City.
The 1 in 6 first-time Airbnb users among tournament guests is one of the more commercially significant figures Airbnb has disclosed. The World Cup is not only monetising existing customers — it is structurally expanding the user base among international football fans who previously defaulted to hotels, with long-term acquisition value beyond the tournament window. The 100,000 new host listings since October 2025 are the supply-side mirror: residents who likely would never have listed on Airbnb, drawn in by demand signals and the $750 new host incentive — Airbnb’s largest new host incentive programme ever launched.
Airbnb Host Earnings by US City in 2026
Projected Average Host Earnings by US City (Deloitte / AirROI, 2026)
======================================================================
New York–NJ  |████████████████████████████████████████████████████| $5,700
Boston       |█████████████████████████████████████████████████   | $5,200
Los Angeles  |█████████████████████████████████████████████████   | $5,100+
Miami        |████████████████████████████████████████████████    | $5,000+
Dallas       |██████████████████████████████████████              | $4,400
Seattle      |████████████████████████████████████                | ~$4,000
Atlanta      |███████████████████████████████████                 | ~$3,800
Kansas City  |███████████████████████████████                     | $3,500 (est. to exceed)
Houston      |██████████████████████████                          | ~$2,800
Philadelphia |████████████████████████                            | $1,900
------------------------------------------------------------
National avg: $4,000 per host  |  Source: Deloitte / AirROI / Airbnb, 2026
| US Host City | Avg Host Earnings (Deloitte) | Avg Nightly Rate | Matches Hosted |
|---|---|---|---|
| New York – New Jersey | $5,700 | $268/night | 8 (incl. Final) |
| Boston | $5,200 | $339/night (highest) | 6 |
| Los Angeles | $5,100+ | $305/night | 7 |
| Miami | $5,000+ | — | 7 |
| Dallas | $4,400 | $363/match day | 9 (most matches) |
| Seattle | ~$4,000 | $303/night | 6 |
| Atlanta | ~$3,800 | — | 8 (incl. Semifinal) |
| Kansas City | $3,500 | $508/match-day ADR | 6 |
| Houston | ~$2,800 | — | 7 |
| Philadelphia | $1,900 | — | 6 |
| US National Average | $4,000 | $262/night avg | — |
Source: Deloitte Economic Analysis commissioned by Airbnb, 2026; AirROI “World Cup 2026 Airbnb Host Earnings: How Much Hosts Can Make in Every Host City,” May 7, 2026; Airbnb Host Earnings Calculator Press Release, April 15, 2026
New York–New Jersey leads all US cities at $5,700 in projected average host earnings, driven by its eight-match schedule that includes both semifinals and the World Cup Final at MetLife Stadium in East Rutherford on July 19. But the per-night rate leader is actually Boston at $339/night — the highest of any US host city — where AirROI pacing data showed 63% fill rates and a $453 average daily rate during match weeks, already the most advanced booking profile outside of New York. Boston’s average Airbnb nightly rate on June 13, the date of the US men’s national team’s opening match, hit $483 — roughly $200 above the same date in 2025, according to the Boston Globe.
Kansas City presents the clearest market anomaly. Deloitte projected $3,500 in average host earnings, but match-day ADRs hit $508 with fill rates at 49% and climbing — driven by just 1,640 active STR listings for six World Cup matches. Scarcity plus demand produces faster rate growth than tournament models predict. Dallas hosts the most matches at nine but lower per-host earnings than Boston, New York, or LA, because its larger STR supply base dilutes per-property revenue even as total city income is substantial.
Airbnb Search Demand and Booking Patterns in 2026
Airbnb Search and Booking Demand Signals — World Cup 2026
==========================================================
Host city search increase (YoY)    |████████████████████████████| +80%
Group stage demand surge (AirDNA)  |████████████████████████████████████| +200%+
Match-day ADR premium (AirROI)     |████████████████████         | 40–65% above baseline
STR fill rate vs baseline (match weeks)|████████████████████████████████| +100–187%
Boston fill rate (leading market)  |███████████████████████████████████| 63%
Kansas City fill rate               |███████████████████████████████████| 55–62%
------------------------------------------------------------
Source: Airbnb Press Release May 2026; AirDNA; AirROI May 2026; Deloitte
| Demand Metric | Data |
|---|---|
| Airbnb searches in host cities (YoY increase) | +80% |
| Group stage demand surge above year-ago levels (AirDNA) | +200%+ |
| Match-day ADR premium over baseline (AirROI) | 40–65% |
| Knockout round ADR premium recommended | 20–30% above group stage |
| STR fill rate increase vs baseline, match weeks | +100–187% |
| Boston fill rate — leading US market | 63% (AirROI) |
| Kansas City fill rate | 55–62% |
| Dallas fill rate | 37–43% |
| Miami fill rate | 28–37% |
| Houston fill rate | 27–35% |
| New York City fill rate | Below-average demand (NYC Local Law 18 effect) |
| AirDNA last-minute bookings trend | Increasing — common for this competition |
Source: AirROI “World Cup 2026 Hotels vs. Airbnb: Where Demand Is Actually Going,” May 13, 2026; AirDNA World Cup 2026 demand snapshots; Airbnb Press Release, May 7, 2026; Newsweek, “Map Shows Cities Seeing Biggest Booking Boost From FIFA World Cup,” June 2026
The 80% year-over-year search increase confirmed in Airbnb’s May 2026 press release signals transformative rather than incremental demand. AirDNA found group stage bookings surging more than 200% above year-ago levels at the same booking window — a spike well above the search growth rate, indicating high search-to-conversion ratios. AirROI’s pacing data showed STR fill rates 100–187% above baseline during match weeks — properties that typically run at 30% occupancy in late June hitting 60–90% on match days.
New York City is the demand surge exception. Its Local Law 18 — restricting STRs to host-present properties, effectively banning most entire-home Airbnb listings — has redirected World Cup demand into Newark and Jersey City, where hosts project the highest US metro average at $5,700. The NYC restriction also explains why Airbnb’s $750 incentive explicitly excludes New York City while covering every other US, Canadian, and Mexican host city. AirDNA noted last-minute bookings have become increasingly common — attributed to high ticket price uncertainty and travel planning complexity across three host nations pushing decisions closer to match dates.
FIFA Hotel Cancellations and Airbnb’s Accommodation Gap in 2026
FIFA Hotel Reservation Cancellations — Selected Cities
=======================================================
Philadelphia  |████████████████████████████████████████| 2,000 hotel rooms cancelled
Vancouver     |████████████████████████████████████████████████████| 15,000 nights cancelled
Some cities   |████████████████████████████████████████████████████| Up to 70% of reserved inventory
------------------------------------------------------------
Hotels tracking below forecasts: ~80% of 200+ US properties surveyed (AHLA, May 2026)
STR fill rate increase vs baseline during match weeks: +100–187% (AirROI)
| Hotel vs STR Dynamics | Data |
|---|---|
| Hotels reporting below-forecast occupancy (AHLA survey) | ~80% of 200+ properties |
| FIFA hotel cancellations — Philadelphia | 2,000 reservations |
| FIFA hotel cancellations — Vancouver | 15,000 nights |
| FIFA hotel cancellations — some cities | Up to 70% of reserved inventory |
| Reasons cited for hotel underperformance | Visa difficulties, strong US dollar, geopolitical headwinds, high ticket prices |
| STR demand response to hotel gap (AirROI) | +100–187% fill rate vs baseline in match weeks |
| Kansas City hotels described tournament as | “Non-event” |
| Kansas City STR fill rate | 62% |
| Philadelphia active STR licences for ~149,000 visitors | Just 426 licensed STR properties |
| Dallas RevPAR vs same window last year | Nearly 500x higher |
Source: AirROI “World Cup 2026 Hotels vs. Airbnb,” May 13, 2026; American Hotel & Lodging Association survey, May 2026; StaySTRA “World Cup 2026 Is the Biggest STR Revenue Event in a Generation,” March 2026; Philadelphia Inquirer, June 10, 2026
One of the most striking features of the 2026 market is the divergence between hotel and STR performance in the same cities. While hotels underperform, AirROI shows STR fill rates 100–187% above baseline during match weeks. In Kansas City, where hotel operators called the tournament a “non-event”, STR fill rates hit 62%. That divergence is partly FIFA’s own doing: the organisation cancelled thousands of hotel reservations — 2,000 in Philadelphia, 15,000 nights in Vancouver, up to 70% in some cities — citing geopolitical factors, visa uncertainties, and shifting demand. Those cancellations created the accommodation gap that short-term rentals filled.
Philadelphia illustrates the supply challenge most starkly. The city expects roughly 149,000 visitors across six matches but has just 426 active STR licences — the tightest supply-demand mismatch of any US host city (StaySTRA, March 2026). Philadelphia’s restrictive STR licensing has constrained legal supply at the moment of historically elevated demand, pushing fans to book further out, pay above-market rates, or not attend. In Dallas, where STR licensing is far more permissive, RevPAR across short-term rentals ran nearly 500 times higher than the same booking window in 2025 — capturing both the depth of demand and what the World Cup delivers to markets structurally positioned to absorb it.
Airbnb Nightly Rates and Pricing Trends in 2026
Airbnb Nightly Rate Surge vs Typical Summer (World Cup Period, 2026)
=====================================================================
Average surge vs typical summer    |█████████████████████████████████████████████| +90%
Boston match-day rate (June 13)    |████████████████████████████████████████████| $483/night
Kansas City match-day ADR          |████████████████████████████████████████████| $508/night
Boston avg tournament rate         |███████████████████████████████████████████ | $453 (AirROI)
Dallas match-day ADR               |█████████████████████████████████████       | $363/night
LA available ADR                   |█████████████████████████████████████       | $354/night
NYC/NJ per night (Deloitte basis)  |█████████████████████████████████████████   | $268/night
National avg rate (Deloitte)       |████████████████████████████████████        | $262/night
------------------------------------------------------------
~80% of available listings priced under $500/night as of late February 2026 (Airbnb)
| Pricing Metric | Data |
|---|---|
| Average nightly rate surge vs typical summer | +90% |
| Boston average nightly rate for tournament (AirROI) | $453 (63% fill rate) |
| Boston rate on June 13 (US opener day) | $483/night |
| Boston June 13 rate vs same day in 2025 | +$200 |
| Kansas City match-day ADR (AirROI pacing) | $508 |
| Dallas match-day ADR | $363 |
| LA tournament average nightly rate | $305 |
| Seattle tournament average nightly rate | $303 |
| New York–NJ Deloitte average nightly rate | $268 |
| National average nightly rate (Deloitte) | $262 |
| Listings under $500/night (as of late Feb 2026) | ~80% of available inventory |
| Renters’ projected weekly earnings (Reeku estimate) | $2,700/week |
Source: AirROI May 2026; Deloitte Economic Analysis 2026 (via Airbnb); Proper Insure “Airbnb Laws & Income for the 2026 World Cup,” May 7, 2026; Boston Globe / Inman, April 29, 2026; Airbnb Press Release, May 7, 2026
The 90% average nightly rate surge versus typical summer travel — from Deloitte’s analysis — is the defining pricing statistic of the tournament’s STR market. For hosts, a near-doubling of rates versus a typical late-June period compresses weeks of summer earnings into a handful of match-day nights. Boston’s $483 rate on June 13 — the US team’s opening match day at Gillette Stadium — was $200 above the same date last year, a 71% single-day increase that illustrates match-specific demand spikes in practice.
Kansas City’s match-day ADR of $508 is the highest of any US host city — despite being the most affordable tournament market at baseline. That inversion is entirely a scarcity effect: 1,640 active STR listings serving six World Cup matches and large fan groups creates extreme per-property pricing regardless of the city’s typical cost level. Airbnb’s own communications addressed the concern directly, noting that around 80% of available listings were under $500/night as of late February 2026 — positioning the platform as more affordable than premium hotels, while acknowledging the gap between that framing and the match-day rates firms like AirROI were tracking.
Airbnb’s Official FIFA Partnership and Host Incentives in 2026
Airbnb World Cup 2026 Partnership & Incentive Programme
========================================================
Official designation        | FIFA World Cup 2026 Tournament Supporter
New host incentive (US/MX)  | $750 per new entire-home host
New host incentive (Canada) | $1,000 CAD (~$730 USD) per new host
Incentive deadline          | July 31, 2026
Cities excluded             | New York City (NYC Local Law 18)
Host Earnings Calculator    | First event-specific calculator in Airbnb history
Free tickets feature        | Select listings include match tickets with booking
------------------------------------------------------------
Over 100,000 new homes listed in host cities since October 2025
Source: Airbnb Press Releases, February–June 2026
| Partnership & Incentive Metric | Data |
|---|---|
| Airbnb’s official FIFA status | Official FIFA World Cup 2026 Tournament Supporter |
| New host incentive — US and Mexico | $750 per new entire-home host |
| New host incentive — Canada (Toronto/Vancouver) | $1,000 CAD (~$730 USD) |
| Incentive eligibility | New hosts or no active listing since Feb 1, 2026 |
| Incentive deadline | July 31, 2026 |
| Cities excluded from incentive | New York City |
| Kansas City temporary event permit cost | $50 |
| Houston STR permit cost | $275 per year |
| Miami STR permit cost | $300+ |
| Host Earnings Calculator launch | April 15, 2026 — first event-specific calculator |
| Free match ticket listings launched | June 10, 2026 |
| Focaldata survey — residents saying extra income would help financially | ~90% |
| Top uses for extra host income cited | Pay down debt (40%), living expenses (35%), home improvements (33%) |
Source: Airbnb Press Releases — “Airbnb Is Offering $750” (February 19, 2026); “Host Earnings Calculator” (April 15, 2026); “Biggest-Ever Event” (May 7, 2026); “Free Tickets with Bookings” (June 10, 2026); StaySTRA “Airbnb Is Paying New Hosts $750,” April 27, 2026; Newsweek, June 2026
Airbnb’s status as Official FIFA World Cup 2026 Tournament Supporter is the first time the platform has held formal sponsor status at a World Cup. The partnership provides co-branding rights, FIFA data access, and the ability to integrate tournament content — including the June 10, 2026 free ticket listings — into the booking experience. The $750 new host incentive was structured specifically to address the supply gap created by FIFA hotel cancellations and high ticket prices. It requires a new entire-home listing (not shared rooms), falls within a geographic eligibility zone around each stadium, and excludes New York City due to Local Law 18.
A Focaldata survey commissioned alongside the Calculator found that nearly 90% of host city residents said extra income from hosting would positively impact their financial situation, with top uses being debt repayment (40%), living expenses (35%), and home improvements (33%). This profile — first-time hosts motivated by financial need rather than hospitality enthusiasm — is a distinct demographic from the typical Airbnb superhost and reflects how unusual this demand event is. The June 10, 2026 free match ticket listings — where select Airbnb properties bundled a World Cup ticket with the booking — added a further commercial layer, letting hosts command premium pricing by offering ticket access that many fans had failed to obtain through FIFA’s own controversial ticketing system.
Disclaimer: The data research report we present here is based on information found from various sources. We are not liable for any financial loss, errors, or damages of any kind that may result from the use of the information herein. We acknowledge that though we try to report accurately, we cannot verify the absolute facts of everything that has been represented.