Data Center Water Usage in America 2026
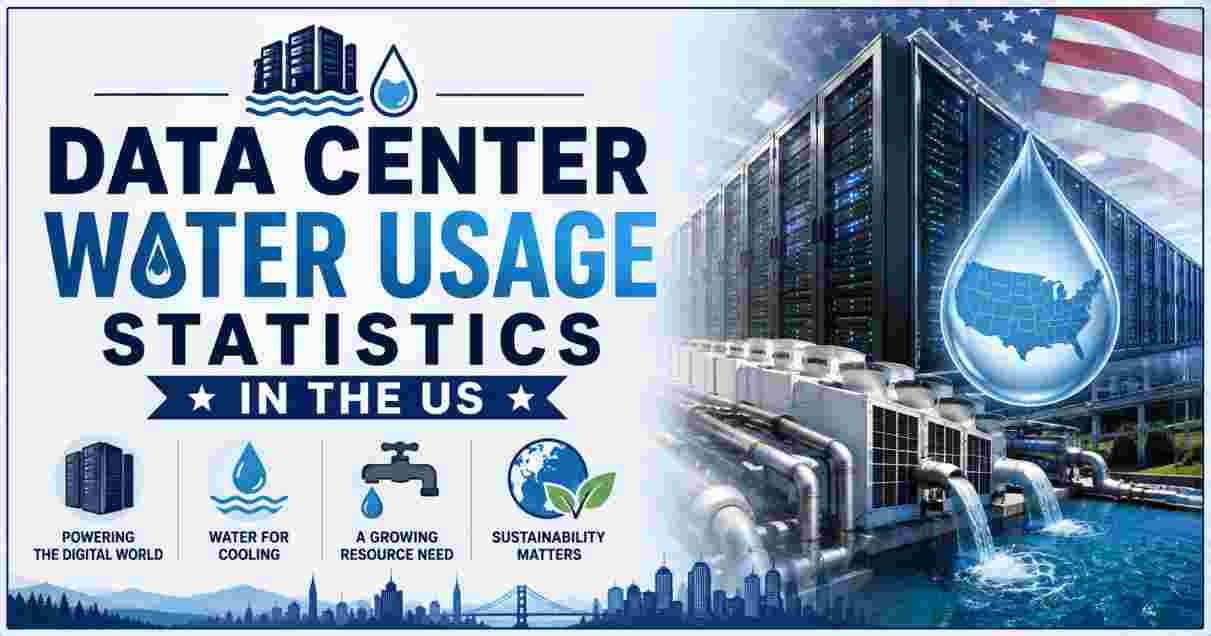
Data center water usage has become one of the most closely scrutinized infrastructure issues in the United States as the artificial intelligence boom drives an unprecedented buildout of computing capacity nationwide. Just days ago, on July 31, 2026, the Congressional Research Service (CRS) released a comprehensive new report — prepared for members and committees of Congress — examining exactly what is known, and what remains unknown, about how much water America’s data centers actually consume, where that water comes from, and who regulates it. The report lands at a pivotal moment: more than 200 state bills addressing data centers were introduced across all 50 states in 2025 alone, with legislative activity continuing to accelerate into 2026 as communities from Arizona to Maine grapple with the water demands of a rapidly expanding industry.
This report compiles the latest verified U.S. government data — sourced directly from the Congressional Research Service, the Lawrence Berkeley National Laboratory (LBNL) under U.S. Department of Energy funding, the U.S. Environmental Protection Agency (EPA), and the U.S. Geological Survey (USGS) — covering direct and indirect data center water consumption, the sources that supply it, and the regulatory gaps federal researchers have identified as of this week. As of today, an important update has landed: the CRS confirms that data centers now account for roughly 2% of total U.S. water consumption nationally, but that this modest-sounding figure masks enormous local variation, since 97% of data centers’ onsite water needs are supplied by public municipal water systems that also serve nearby homes, farms, and businesses.
Interesting Data Center Water Usage Facts and Latest Statistics in the US 2026
| Data Center Water Fact Category | Latest Verified Figure |
|---|---|
| U.S. Data Centers’ Share of Total National Water Consumption | ~2% (CRS, July 31, 2026) |
| Direct Water Use by U.S. Data Centers (2023) | 17.4 billion gallons |
| Direct Water Use by U.S. Data Centers (2014, for comparison) | 5.6 billion gallons |
| Indirect Water Use via Electricity Generation (2023) | 211 billion gallons |
| Share of Onsite Water Supplied by Public Utilities (2025) | ~97% |
| Daily Water Use of a 100-Megawatt Data Center | Equivalent to ~2,600 households |
| Data Centers Identified in Central Arizona (2026 ASU Study) | 66 facilities |
| Projected U.S. Direct Water Use by 2028 | 38–73 billion gallons |
Data source: Congressional Research Service report R49057, July 31, 2026; Lawrence Berkeley National Laboratory 2024 United States Data Center Energy Usage Report (LBNL-2001637)
These figures reveal an industry whose water footprint is expanding rapidly even as federal researchers acknowledge major gaps in the underlying data. The Congressional Research Service’s July 31, 2026 report confirms that U.S. data centers directly consumed approximately 17.4 billion gallons of water in 2023, more than triple the 5.6 billion gallons consumed in 2014, a trajectory driven largely by the computing demands of artificial intelligence training and inference. That direct, on-site figure is dwarfed by the 211 billion gallons consumed indirectly in 2023 through the electricity-generation process that powers these facilities, according to the Department of Energy-funded Lawrence Berkeley National Laboratory — a figure roughly twelve times larger than direct cooling water use, yet one that virtually never appears in corporate sustainability disclosures.
The 97% figure for public-utility water supply is particularly significant because it means the overwhelming majority of data center water competes directly with the same municipal systems that supply drinking water to households, hospitals, and local businesses. A single 100-megawatt data center, the CRS notes citing International Energy Agency estimates, can directly consume as much water each day as roughly 2,600 households — a scale that explains why individual facility siting decisions, rather than national totals, have become the primary flashpoint in communities from Marana, Arizona to Imperial County, California, where local water fights are already playing out in 2026.
Source: Congressional Research Service; Lawrence Berkeley National Laboratory; U.S. Department of Energy
National Data Center Water Consumption Statistics in the US 2026
2014 Direct Consumption.......... 5.6B gal   ████
2023 Direct Consumption.......... 17.4B gal  █████████
2028 Projected (Low Estimate)..... 38B gal    █████████████████
2028 Projected (High Estimate).... 73B gal   ██████████████████████
| Metric | Government-Verified Figure |
|---|---|
| Direct Water Consumption, 2014 | 5.6 billion gallons |
| Direct Water Consumption, 2023 | 17.4 billion gallons |
| Indirect Water Consumption via Electricity, 2023 | 211 billion gallons |
| Combined Direct + Indirect Consumption, 2023 | ~228 billion gallons |
| Projected Direct Consumption, 2028 (Low–High Range) | 38–73 billion gallons |
| Share of Total U.S. Water Consumption (Direct Only) | ~2% |
Data source: Lawrence Berkeley National Laboratory 2024 United States Data Center Energy Usage Report (LBNL-2001637), prepared under U.S. Department of Energy Contract DE-AC02-05CH11231; Congressional Research Service report R49057
The 2024 United States Data Center Energy Usage Report, produced by Lawrence Berkeley National Laboratory under a congressional mandate written into the Energy Act of 2020, remains the single most authoritative federal estimate of national data center water consumption. Direct water use — the water physically evaporated or discharged on-site for cooling — more than tripled from 5.6 billion gallons in 2014 to 17.4 billion gallons in 2023, and LBNL researchers project this figure could double or even quadruple by 2028, reaching somewhere between 38 and 73 billion gallons depending on how quickly AI-driven capacity expansion continues and which cooling technologies new facilities adopt.
The 211 billion gallons of indirect water consumption identified for 2023 stems from the water used at power plants to generate the electricity that data centers draw from the grid, and LBNL’s analysis found this indirect water burden is nearly twelve times larger than the direct cooling figure that most public discussion focuses on. Combining both categories puts total data center-attributable water consumption at roughly 228 billion gallons for 2023 — a figure that, even at that scale, the CRS confirms represents only about 2% of total U.S. water consumption nationally, underscoring why the debate over data center water has shifted from national aggregate numbers toward the specific local communities where individual facilities are sited.
Source: Lawrence Berkeley National Laboratory; U.S. Department of Energy
Data Center Water Sourcing and Municipal Supply Statistics in the US 2026
Public Water Utility Supply (2025)...... 97%  ██████████████████████████
Self-Supplied / Other Sources (2025)..... 3%  ██
| Water Sourcing Metric | CRS-Reported Figure |
|---|---|
| Share of Data Center Onsite Water From Public Utilities (2025) | ~97% |
| Share From Self-Supply, Reclaimed Water, or Direct Withdrawals | ~3% |
| Federal Agencies With Direct Water-Supply Contracts to Data Centers | None identified (as of July 2026) |
| Western States Where Bureau of Reclamation Owns Water Infrastructure | 17 states |
Data source: Congressional Research Service report R49057, July 31, 2026, citing U.S. Environmental Protection Agency and Bureau of Reclamation data
According to the Congressional Research Service’s newest analysis, an estimated 97% of U.S. data centers’ onsite water needs are supplied by public water systems — the same municipal utilities that treat and deliver drinking water to households and businesses — rather than through private wells, direct river withdrawals, or dedicated industrial supply contracts. This reliance on public infrastructure exists largely for practical reasons: municipal water has already been treated to consistent quality standards, while poorer-quality or untreated water sources can introduce minerals, scaling, or corrosion risks into sensitive cooling equipment. The remaining share comes from reclaimed wastewater, stormwater, or direct surface and groundwater withdrawals, options that depend heavily on local infrastructure such as dedicated non-potable “purple pipe” networks.
Critically, the CRS reports that as of its research in early July 2026, it had not identified any data center developer or operator that had entered into a direct water-supply agreement with either the Bureau of Reclamation or the U.S. Army Corps of Engineers — the two federal agencies that own and operate major water infrastructure across 17 western states. That does not mean federally developed water never reaches data centers; it frequently does so indirectly, as in Central Arizona, where municipal systems serving Phoenix, Scottsdale, and Mesa deliver Colorado River water through the Central Arizona Project to service areas that include data center customers, even though the facility operators themselves hold no direct federal water contract.
Source: Congressional Research Service; U.S. Bureau of Reclamation
State-Level Data Center Water Impact Statistics in the US 2026
Phoenix, AZ Data Centers.......... 25  █████████████████████
Tucson, AZ Data Centers............ 9  ██████████████
Mesa, AZ Data Centers............... 8 █████████████
Scottsdale, AZ Data Centers......... 5 ████████
| Regional Metric | CRS/ASU-Reported Figure |
|---|---|
| Total Central Arizona Data Centers Identified (2026 ASU Study) | 66 facilities |
| Phoenix-Area Data Centers | 25 |
| Tucson-Area Data Centers | 9 |
| Mesa-Area Data Centers | 8 |
| Scottsdale-Area Data Centers | 5 |
| States With Data Center Bans or Moratoriums Under Discussion (2026) | 20+ states |
| First State to Require Formal Water-Permitting for Large Data Centers | Minnesota (2025) |
Data source: Congressional Research Service report R49057, citing a 2026 Arizona State University study; state legislative tracking via ITIF, July 2026
The Congressional Research Service’s report gives particular attention to Arizona, citing a 2026 Arizona State University study that identified 66 data centers completed or under construction across Central Arizona, including facilities located within the service areas of municipal water suppliers for Phoenix (25 facilities), Tucson (9), Mesa (8), and Scottsdale (5). These cities draw significant portions of their water supplies from the federally managed Colorado River via the Central Arizona Project, meaning a substantial share of Arizona’s booming data center sector is, at least indirectly, dependent on a river system already under severe strain from decades of drought across the American Southwest, a dynamic explored further in coverage of why water scarcity is getting worse in the US.
Arizona is far from alone in confronting this tension. The town of Marana, Arizona adopted an ordinance in December 2024 explicitly barring its water department from providing potable water to any data center for cooling, humidity control, or similar operations — forcing a nearby proposed facility to rely on non-potable water from a local irrigation district instead. More broadly, more than 20 states were actively discussing data center bans or moratoriums as of mid-2026, and Minnesota became the first state in the country to establish a formal water-permitting requirement specifically for large data centers in 2025, a regulatory model other states are now actively studying as data center construction continues to accelerate nationwide.
Source: Congressional Research Service; Arizona State University; state legislative records
AI-Driven Data Center Water Demand Statistics in the US 2026
US Data Centers (Total Active, April 2026)........ 4,000+
Global Data Center Share Located in US............. 37%
Data Centers Built Since 2022 in Water-Stressed Regions.. Two-thirds
| AI and Growth Metric | Government/Federal-Linked Figure |
|---|---|
| Total Active U.S. Data Centers (April 2026) | 4,000+ facilities |
| U.S. Share of Global Data Center Total | 37% |
| Share of Data Centers Built Since 2022 in Water-Stressed Regions | ~66% |
| NDAA FY2026 Provision on Military Installation Data Centers | Requires water/electricity impact estimates |
| Direct Consumption of a Large Data Center vs. Small Town | Comparable to a town of 10,000 people, daily |
Data source: Data Center Map, as cited in MOST Policy Initiative science note; National Defense Authorization Act for Fiscal Year 2026; Congressional Research Service
The surge in artificial intelligence training and inference workloads is the primary force behind data center water demand growth documented in federal and federally cited research. As of April 2026, the United States hosted more than 4,000 active data centers, representing 37% of the world’s total — by far the largest national concentration on the planet — and government researchers note that roughly two-thirds of data centers built since 2022 are located in regions already classified as water-stressed. AI workloads intensify this dynamic specifically because training and running large models requires sustained, high-density computing that generates substantial heat, and the Congressional Research Service notes an important trade-off documented in its report: cooling systems that use less water, such as air-cooled chillers, generally consume more electricity instead, meaning water conservation and energy conservation goals do not always move in the same direction.
Congress has begun responding to this AI-driven growth with targeted legislative action. The National Defense Authorization Act for Fiscal Year 2026, already signed into law as of the CRS’s July 30, 2026 review, now requires the Department of Defense to produce estimates of additional electricity and water use, along with anticipated effects on surrounding communities, for any new data center construction or expansion on military installations — the first concrete federal water-reporting requirement tied specifically to data centers. Multiple additional bills, including the Data Center Tax Accountability and Disclosure Act of 2026 and the Advancing Water Reuse Act, remained under committee consideration as of late July 2026, aiming respectively to mandate public water-use reporting and to incentivize water-recycling investment through a 30% tax credit.
Source: Congressional Research Service; National Defense Authorization Act for Fiscal Year 2026; Data Center Map via MOST Policy Initiative
Data Center Water Reuse and Federal Policy Statistics in the US 2026
Bills Addressing Data Centers Introduced (2025, All States)........ 200+
Bills Enacted into Law (2025)........................................ 40+
Projects Delayed/Abandoned, Q1 2026 Alone (Value)................... $130B+
| Policy and Reuse Metric | Reported Figure |
|---|---|
| State Bills Addressing Data Centers Introduced (2025) | 200+ bills, all 50 states |
| Bills Enacted Into Law (2025) | 40+ |
| Value of Data Center Projects Delayed/Abandoned, Q1 2026 | $130+ billion |
| Advancing Water Reuse Act — Proposed Tax Credit | 30% investment tax credit |
| EPA Position on Recycled Water Permitting for Cooling | Unclear pathway, per CRS |
| Federal Agency With National Systematic Water-Use Assessment | None identified, per CRS |
Data source: Congressional Research Service report R49057; Information Technology and Innovation Foundation (ITIF), July 6, 2026; U.S. Environmental Protection Agency
Legislative activity around data center water use has accelerated dramatically at the state level, with more than 200 bills addressing data centers introduced across all 50 states in 2025, of which more than 40 were enacted into law — and that pace has continued into 2026, with bans or moratoriums under active discussion in more than 20 states. The financial stakes of this regulatory pushback are substantial: independent tracking cited alongside the CRS’s findings shows more than $130 billion in data center projects were delayed or abandoned in the first quarter of 2026 alone, already exceeding the total for all of 2025 combined, as local water and grid concerns increasingly translate into real construction and investment setbacks.
On the federal reuse and recycling front, the CRS report identifies water reuse — capturing wastewater, stormwater, saltwater, or graywater and treating it for beneficial use — as a genuine option for reducing new freshwater demand, and notes that many data center operators have expressed interest in switching to recycled water for cooling. However, the report also finds that these operators face an unclear federal permitting pathway for this specific use, since there is no single federal law or regulation governing water reuse; authority instead sits primarily with individual states, and requirements vary depending on the water source and intended use. Perhaps most tellingly, the CRS confirms that the federal government has not conducted a systematic nationwide assessment of data center water use, and that the U.S. Geological Survey, despite decades of collecting national, state, and county water-withdrawal data, has never maintained data centers as a separately tracked reporting category — a data gap that multiple pending congressional bills, including the Data Center Tax Accountability and Disclosure Act of 2026, are specifically designed to close. For readers interested in how AI infrastructure growth is reshaping other sectors of the American economy and workforce, the AI in healthcare statistics in the US offer additional context on how the same underlying AI computing demand driving data center water consumption is also transforming clinical and hospital operations nationwide, while broader environmental strain from data center expansion compounds existing challenges documented in reports on the most polluted cities in the US, where power-plant emissions tied to data center electricity demand contribute to regional air quality burdens alongside the water impacts detailed above.
Source: Congressional Research Service; Information Technology and Innovation Foundation; U.S. Environmental Protection Agency; U.S. Geological Survey
Data Center Cooling Technology and Climate Impact Statistics in the US 2026
Evaporative Cooling — Higher Water, Lower Energy........... ████████████████████████
Air-Cooled Chillers — Lower Water, Higher Energy........... ██████████████
Peak Summer/Hot-Weather Demand Multiplier................... Up to 3x baseline
| Cooling Technology Metric | CRS-Documented Figure |
|---|---|
| Cooling Systems Relying Primarily on Evaporation | Majority of large hyperscale facilities |
| Trade-Off: Air-Cooled Chillers vs. Evaporative Cooling | Air cooling uses more energy, less water |
| Peak Water Demand Timing | Concurrent with hot-weather peak demand from households, agriculture, and power generation |
| Facility-Specific Water Data Availability | Limited; often bundled into general utility customer totals |
Data source: Congressional Research Service report R49057, July 31, 2026
The type of cooling technology a data center uses fundamentally determines its water footprint, and the Congressional Research Service’s July 2026 report is careful to document the trade-offs involved rather than present water reduction as a costless solution. Most large-scale, high-density facilities rely on evaporative cooling, where water absorbs heat from servers and then evaporates into the atmosphere — an efficient and relatively low-energy method, but one that consumes substantial volumes of water in the process. Facilities that instead use air-cooled chillers consume little or no water on-site, but the CRS notes this comes at the cost of significantly higher electricity consumption, meaning a shift away from water-intensive cooling can simply shift the environmental burden toward the indirect water consumption embedded in additional power-plant generation documented in LBNL’s 211-billion-gallon indirect use estimate.
Geography and seasonality compound these trade-offs. The CRS report emphasizes that evaporative-cooling data centers generally require more water during the hottest parts of the day and the hottest months of the year — precisely the same periods when households, farms, power producers, and other water users are placing their own greatest demands on local supplies. This synchronized peak demand is a central reason why the significance of any single new data center depends heavily on local and regional circumstances — available water supplies, prevailing climate, seasonal conditions, and competing agricultural, industrial, and environmental needs — rather than on any single national average. The report explicitly declines to offer a blanket national verdict on whether data centers use “too much” water, concluding instead that impact is overwhelmingly a function of where a facility is built, how it is cooled, and where its water originates — a conclusion that places the practical burden of these decisions squarely on state water regulators, municipal utilities, and the local communities where America’s AI infrastructure boom continues to accelerate through the rest of 2026.
Disclaimer: The data research report we present here is based on information found from various sources. We are not liable for any financial loss, errors, or damages of any kind that may result from the use of the information herein. We acknowledge that though we try to report accurately, we cannot verify the absolute facts of everything that has been represented.