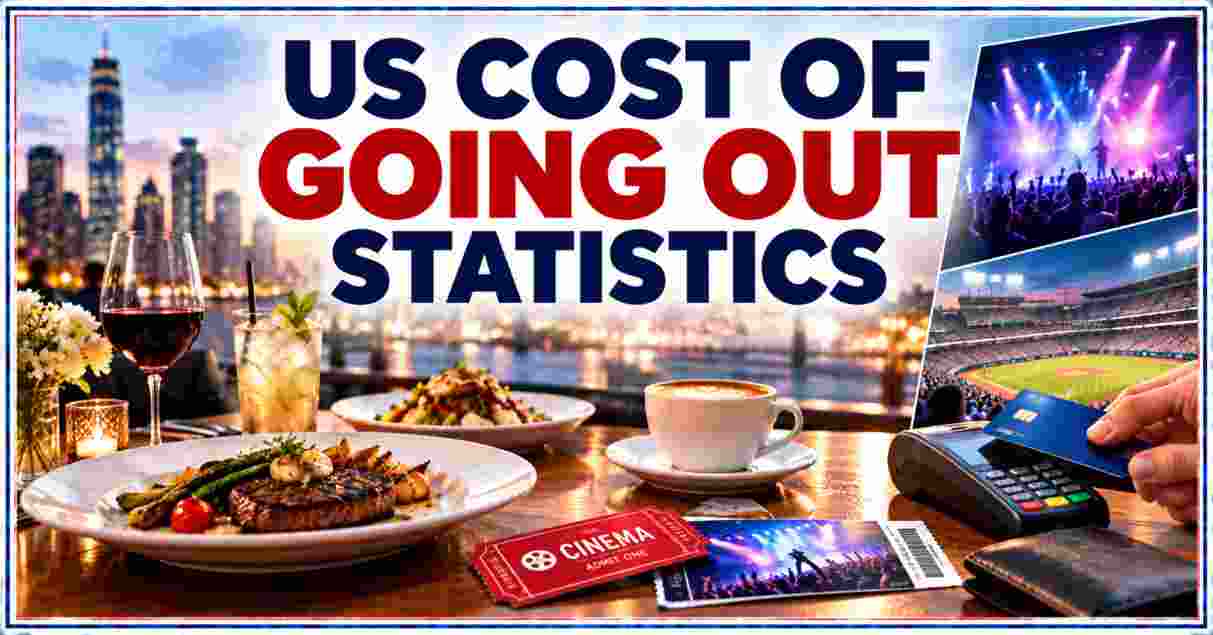
Since 2000, the cost of going out in the US has badly outpaced overall inflation: economy-wide prices rose 87%, concert tickets more than doubled, and sports tickets shot up 123%, while the price of staying home and using recreation equipment rose just 37% over the same period. By 2026, a Super Bowl ticket averages $6,636 and a top-tour concert ticket averages $122.15, pricing many routine nights out further out of reach for ordinary households.
Cost of Going Out in America 2026
Cost of Going Out Statistics in the US tracks how much Americans pay for restaurants, concerts, sporting events, movies, and other leisure activities outside the home, and how those prices compare to overall inflation over time. Unlike grocery prices or rent, which fall under well-established government tracking categories, the cost of “going out” spans several distinct Consumer Price Index (CPI) categories, food away from home, admissions to sporting and cultural events, and recreation more broadly, each of which the Bureau of Labor Statistics tracks separately but which together shape the total cost of a typical night on the town. Because entertainment pricing operates on dynamic, demand-based models far more aggressively than staple goods do, prices for live events in particular have decoupled from broader inflation in ways that grocery or utility prices generally have not.
The 2026 data shows this decoupling has become a defining feature of the American leisure economy rather than a temporary post-pandemic anomaly. From 2000 to 2026, economy-wide price levels rose 87%, a substantial increase in its own right, but concert ticket costs more than doubled and sports ticket costs rose 123% over the same 26-year span, both dramatically outpacing the broader trend. Movie tickets have tracked closer to overall inflation, though costs run far higher than average in major cities, while the price of recreation at home, including televisions and hobby materials, rose just 37% over the same quarter-century, less than half the overall inflation rate. Understanding Cost of Going Out Statistics in the US in 2026 means recognizing that leaving the house for entertainment has become one of the fastest-inflating categories in the household budget, even as staying in has grown comparatively cheaper.
Interesting Facts About Cost of Going Out in the US in 2026
| Fact | Detail |
|---|---|
| Economy-Wide Price Increase (2000-2026) | 87% |
| Concert Ticket Price Increase (2000-2026) | More than doubled (100%+) |
| Sports Ticket Price Increase (2000-2026) | 123% |
| Home Recreation Price Increase (2000-2026) | 37% |
| Average Top-Tour Concert Ticket (Mid-2026) | $122.15 |
| Average Super Bowl Ticket (2026) | $6,636, up 231.8% from 2015 |
| Average NBA Finals Ticket (2026) | $5,447, up 505.2% from 2015 |
| Average Movie Ticket (2026) | $12.75, up from $9.16 in 2019 |
The scale of divergence captured in Cost of Going Out Statistics in the US shows that not all leisure spending has inflated equally, and the gap between categories has only widened heading into 2026. Live events carry by far the steepest price growth: sports tickets have outpaced overall inflation by roughly 36 percentage points since 2000, and concert tickets have outpaced it by an even wider margin, more than doubling in price while the broader economy grew 87%. At the very top of the market, marquee sporting events have detached from ordinary pricing logic entirely, with Super Bowl tickets climbing 231.8% and NBA Finals tickets climbing an extraordinary 505.2% in just over a decade, driven by dynamic pricing, celebrity attendance, and intensifying media coverage rather than any comparable rise in the underlying cost of staging the games themselves.
Restaurant dining sits in a middle position within this pattern: the CPI for food away from home rose 3.5% in the year ending May 2026, a smaller jump than the sports and concert categories but still running ahead of the 2.7% increase for groceries over the same period. Movie tickets, meanwhile, have largely tracked with general inflation, rising from $9.16 in 2019 to $12.75 in 2026, though this masks significant regional variation, with major metro tickets running $14.50 to $16.50 and premium large-format screenings costing considerably more. Taken together, these figures show that Cost of Going Out Statistics in the US in 2026 reflect not one uniform trend but several very different inflation stories playing out simultaneously across the leisure economy.
Overall Cost of Going Out vs. Inflation Statistics 2026
Cumulative Price Change by Category (2000-2026)
Sports Tickets      ████████████████████████████████████████  +123%
Concert Tickets     ██████████████████████████████████████░░  +100%+
Economy-Wide (CPI)  ████████████████████████████░░░░░░░░░░░░  +87%
Movie Tickets        ███████████████████████████░░░░░░░░░░░░  ~Pace with inflation
Home Recreation      ████████████░░░░░░░░░░░░░░░░░░░░░░░░░░░░  +37%
                     0%       30%       60%       90%      120%
| Category | Price Increase (2000-2026) |
|---|---|
| Sports Tickets | +123% |
| Concert Tickets | More than doubled (100%+) |
| Economy-Wide Inflation | +87% |
| Movie Tickets | Roughly in line with overall inflation |
| Home Recreation (TVs, Hobby Materials) | +37% |
Source: Bureau of Labor Statistics Consumer Price Index data, analyzed via wire service reporting, September 2026
Over the 26 years from 2000 to 2026, economy-wide price levels in the US rose 87%, a substantial baseline against which entertainment categories have performed very differently. Sports tickets rose 123% over that same period, outpacing overall inflation by roughly 36 percentage points, while concert ticket costs more than doubled, an even steeper trajectory that has made live music one of the fastest-inflating leisure categories tracked by the Bureau of Labor Statistics. Movie tickets, by contrast, have stayed closer to the overall inflation pace, though sharp cost spikes in major cities and for premium formats mean the “average” ticket price obscures considerable variation in what moviegoers actually pay.
The starkest contrast in this data is the divergence between going out and staying in. Recreation at home, including televisions and hobby materials, rose just 37% over the same quarter-century, 50 percentage points below the overall inflation rate, meaning the relative cost of entertaining oneself at home has fallen sharply compared to going out. This growing price gap between in-home and out-of-home leisure activities helps explain why more households have shifted spending patterns toward streaming, home theater setups, and hobby purchases even as broader entertainment and dining budgets have come under pressure, a trend that has intensified rather than reversed through 2026.
Restaurant and Dining Out Cost Statistics 2026
Food Price Inflation, Year Ended May 2026
Food Away From Home   ██████████████████████████████████  +3.5%
All Food              ████████████████████████████░░░░░░  +3.1%
Food At Home          ████████████████████████░░░░░░░░░░  +2.7%
                      0%      1%      2%      3%      4%
| Metric | Value |
|---|---|
| Food Away From Home CPI, Year Ended May 2026 | +3.5% |
| Food At Home CPI, Year Ended May 2026 | +2.7% |
| Casual Dining Average Cost Per Person | $15-$30 |
| Overall CPI, 12 Months Ending August 2026 | +3.4% |
Source: US Bureau of Labor Statistics, Consumer Price Index, May and August 2026 releases
Restaurant prices have consistently outpaced grocery store prices in the current inflation cycle: the CPI for food away from home rose 3.5% in the year ending May 2026, compared to a 2.7% increase for food at home over the same period, continuing a pattern that has held for the past several years. Casual dining, excluding tips and drinks, averages $15 to $30 per person per meal nationally, with fine dining routinely running double or triple that amount, meaning a couple’s casual dinner out before tip or alcohol can easily exceed $60, and a fine dining outing can run well past $150.
This restaurant-specific inflation sits within a broader economic picture where overall CPI rose 3.4% over the 12 months ending August 2026, meaning food away from home has run only modestly ahead of general inflation rather than dramatically outpacing it in the way concert and sports tickets have. Even so, restaurant pricing carries outsized visibility for consumers because dining out is a frequent, recurring expense rather than an occasional big-ticket purchase, meaning even modest annual increases compound into a noticeably larger household expense over a full year of regular restaurant visits.
Restaurant Price Perception vs. Reality Statistics 2026
Guest Views on Restaurant Price Increases (2024 vs. 2026)
"Completely Justified" 2024   █████████████████░░░░░░░░░░░░░░  41%
"Completely Justified" 2026   ███████░░░░░░░░░░░░░░░░░░░░░░░░  18%
"Not Justified at All" 2024   ████░░░░░░░░░░░░░░░░░░░░░░░░░░░░  10%
"Not Justified at All" 2026   ██████████░░░░░░░░░░░░░░░░░░░░░░  25%
| Metric | 2024 | 2026 |
|---|---|---|
| Guests Saying Price Hikes “Completely Justified” | 41% | 18% |
| Guests Saying Increases “Not Justified at All” | 10% | 25% |
| Guests Dining Out Less Than Prior Year | 55% | 53% |
| Guests Wanting Advance Notice of Price Hikes | 70% | 69% |
Source: Data by Toast, restaurant guest pricing perception survey, July 2026 (compared to April 2024 wave)
A Toast survey of 850 US diners, first conducted in April 2024 and repeated in July 2026, found a sharp shift in how guests view restaurant pricing even though their actual dining habits have barely changed. In 2024, 41% of guests said restaurant price increases were “completely justified,” but by 2026 that figure had collapsed to just 18%, while the share calling increases “not justified at all” rose from 10% to 25%, nearly a reversal of sentiment in two years. Guests also increasingly overestimate the scale of price hikes: 54% guessed prices had risen 10-20% in 2026, up from 41% who guessed that range in 2024, showing that perception of restaurant inflation has outpaced the actual, more modest CPI increases described above.
Despite this hardening skepticism, actual behavior has remained remarkably stable: 53% of guests reported dining out less in 2026, essentially unchanged from 55% in 2024. Critically, among guests who are cutting back, 56% cited the overall cost of living as their main reason, compared to just 33% who blamed menu prices specifically, indicating that restaurants are absorbing consumer frustration disproportionate to their actual role in tightening household budgets. Guest demand for advance notice of price increases has also held steady, at 69% in 2026 versus 70% in 2024, a consistent, actionable expectation that Toast’s analysts suggest restaurants have yet to systematically address.
Concert Ticket Price Statistics 2026
Concert Ticket Prices, Mid-2026
Average Top-100 Tour Ticket   ████████████████████████░░░░░░  $122.15
2025 Average (Comparison)     ███████████████████████████░░░  $134.23
Stadium Average                ████████████████████████████████  $216.13
Independent Club Shows         ██░░░░░░░░░░░░░░░░░░░░░░░░░░░░░  $10-$30
                               $0        $80       $160      $240
| Metric | Value |
|---|---|
| Average Top-100 Tour Ticket (Mid-2026) | $122.15 |
| 2025 Comparison Average | $134.23 |
| Change, 2025 to Mid-2026 | -2.4% |
| Stadium Show Average | $216.13 |
| Independent Club Shows (Before Fees) | $10-$30 |
| Average Ticket Fee Load | ~29% of face value |
Source: Pollstar mid-year 2026 report; Live Nation Q2 2026 earnings
Pollstar’s mid-year 2026 report put the average ticket price for the top 100 North American tours at $122.15, actually a 2.4% decline from the $134.23 average recorded in 2025, suggesting some cooling at the very top of the concert market after years of rapid price growth. Stadium shows command a substantially higher average of $216.13, reflecting the premium venues and headline acts that dominate that tier, while independent club shows below the arena level typically run just $10 to $30 before fees, a reminder that the eye-catching top-tour averages do not represent the full spectrum of live music pricing available to fans.
Fees remain a persistent, largely invisible driver of what fans actually pay: ticket fees average close to 29% of face value, a load that industry analysts note “did not disappear in 2026,” even as headline advertised prices have moderated slightly. Live Nation’s own Q2 2026 earnings showed average get-in prices rising only in the low-to-mid single digits, trailing inflation over the past five years, meaning the base ticket price story is more moderate than the sports ticket story described elsewhere in this report, even though the total cost fans pay at checkout, once fees are included, often tells a less favorable story.
Movie Theater Cost Statistics 2026
Average US Movie Ticket Price (2019 vs. 2026)
2019                         ███████████████████░░░░░░░░░░░░░░░░░░░░  $9.16
2026                         ██████████████████████████░░░░░░░░░░░░░  $12.75
PLF (Premium Format), 2026 ██████████████████████████████████  $18.26
| Metric | Value |
|---|---|
| Average Movie Ticket (2019) | $9.16 |
| Average Movie Ticket (2026) | $12.75 |
| Premium Large-Format (PLF) Ticket (2026) | $18.26 |
| 2026 Summer Box Office | $4.76 billion, a record high |
Source: EntTelligence market research, via CNBC, September 2026; Cinema United
The average US movie ticket rose from $9.16 in 2019 to $12.75 in 2026, according to market research firm EntTelligence, an increase that has occurred even as the industry sells fewer tickets overall and offers fewer wide theatrical releases than before the pandemic. Premium large-format screenings, increasingly popular with Gen Z and millennial audiences, push the average considerably higher, to $18.26 per ticket, meaning the true cost of a night at the movies for many younger moviegoers now runs well above the industry-wide average. Despite these headwinds, the 2026 summer box office set a new all-time high of $4.76 billion in domestic ticket sales between May 1 and September 7, a record driven substantially by higher per-ticket prices rather than a corresponding rise in overall attendance.
This pattern, higher prices sustaining revenue records even as attendance and film output decline, illustrates a broader dynamic playing out across the entertainment industry in 2026: fewer, pricier premium experiences increasingly substitute for the high-volume, lower-cost model that once defined moviegoing. With only 68 wide releases so far in 2026, a 14% drop from the 79 wide releases recorded over the same period in 2019, theater chains have leaned further into premium formats and dynamic pricing to offset the smaller release slate, a strategy that has kept box office revenue climbing even as the traditional moviegoing habit continues to erode for a meaningful share of the population.
Major Sporting Event Ticket Price Statistics 2026
Average Ticket Price Growth, 2015 to 2026
NBA Finals                  ████████████████████████████████████  +505.2% ($900 → $5,447)
CFP National Championship ██████████████████████████████░░░░  +411% ($845 → $4,320)
Super Bowl                ███████████████████████░░░░░░░░░░░░  +231.8% ($2,000 → $6,636)
                         0%      150%     300%     450%     600%
| Event | 2015 Average | 2026 Average | % Increase |
|---|---|---|---|
| NBA Finals | $900 | $5,447 | +505.2% |
| College Football Playoff National Championship | $845 | $4,320 | +411% |
| Super Bowl | $2,000 | $6,636 | +231.8% |
| FIFA World Cup Final | — | $14,000+ | Highest of any event |
Source: Hard Rock Bet study of major US sporting event ticket prices, 2026
America’s biggest sporting events have seen ticket prices detach almost entirely from broader inflation trends. The NBA Finals recorded the steepest climb of any major event tracked, with average ticket prices rising 505.2%, from $900 in 2015 to $5,447 in 2026, a jump analysts attribute to increased celebrity attendance, heavier media coverage, and aggressive dynamic pricing by resale platforms. The College Football Playoff National Championship followed closely, climbing 411% from $845 to $4,320, while the Super Bowl, despite remaining one of the most recognizable tickets in American sports, actually posted the smallest percentage increase among the top events at 231.8%, rising from $2,000 in 2015 to $6,636 in 2026.
Topping every domestic event by a wide margin, the FIFA World Cup Final, hosted in North America in 2026, pushed average ticket prices above $14,000, a figure Hard Rock Bet’s analysis attributes to limited ticket availability, enormous global demand, premium hospitality packages, and dynamic pricing all compounding simultaneously around a uniquely rare event. These figures illustrate that while restaurant and concert pricing has moderated somewhat in 2026, the market for marquee, once-in-a-generation live sporting experiences has continued to intensify, pricing an increasing share of ordinary fans out of attending in person even as television and streaming viewership for these same events remains broadly accessible.
How Americans Are Adapting to Rising Entertainment Costs 2026
Consumer Response to Rising Cost of Going Out (2026)
Cite Cost of Living as Main Reason for Cutting Back  ████████████████████████████████  56%
Cite Menu/Ticket Prices Specifically                  ██████████████████░░░░░░░░░░░░░░  33%
Categories Affected: Bars, Theme Parks, Coffee Shops  ████████████████████████████████  Broad-based pullback
| Metric | Value |
|---|---|
| Guests Citing Cost of Living as Main Pullback Reason | 56% |
| Guests Citing Menu/Ticket Prices Specifically | 33% |
| Categories Reporting a Pullback | Restaurants, bars, theme parks, coffee shops, concerts, sports |
| Trend Description | Broad-based, not limited to one entertainment category |
Source: Washington Post reporting, syndicated September 2026; Data by Toast survey
Reporting on the surging cost of going out in 2026 describes a household squeeze extending well beyond any single entertainment category. More people are staying home as prices climb across concerts, sports games, and restaurants simultaneously, with the pullback extending to bars, theme parks, and even coffee shops, evidence that the pattern reflects a genuinely broad-based response to entertainment cost growth rather than consumers simply avoiding one specific overpriced category. As one consumer told reporters, a once-a-week restaurant meal has become “something that’s gotten harder to justify but also feels, like, deeply important for us to do,” capturing the emotional tension many households describe between valuing social and leisure experiences and facing genuinely tighter discretionary budgets. Readers looking at how these entertainment cost pressures intersect with broader household finance concerns can find further detail in the report on average salary statistics in the US, which tracks how wage growth has or has not kept pace with these rising leisure costs.
Rather than abandoning going out altogether, most households appear to be adapting rather than fully retreating, a pattern consistent with the restaurant survey data showing dining-out frequency has held roughly steady even as pricing skepticism has intensified sharply. The underlying economics behind this shift, including how ticket resale markets, dynamic pricing algorithms, and venue operating costs interact to push live event prices higher, are explored further in the report on the economics behind rising concert ticket prices, which breaks down the specific structural forces behind live entertainment’s outsized inflation. For a growing share of Americans managing tighter budgets while paying more for the experiences they still choose to prioritize, the report on US credit card delinquency statistics offers relevant context on how discretionary spending pressure is showing up in broader consumer credit trends.
Frequently Asked Questions
How much has the cost of going out increased since 2000?
Economy-wide prices rose 87% from 2000 to 2026, while concert tickets more than doubled and sports tickets rose 123% over the same period, both far outpacing general inflation.
What is the average concert ticket price in 2026?
The average ticket for the top 100 North American tours was $122.15 at mid-2026, according to Pollstar, down 2.4% from the 2025 average of $134.23, though stadium shows average $216.13.
How much does a Super Bowl ticket cost in 2026?
The average Super Bowl ticket costs $6,636 in 2026, up 231.8% from $2,000 in 2015.
What is the average movie ticket price in the US in 2026?
The average movie ticket costs $12.75 in 2026, up from $9.16 in 2019, with premium large-format tickets averaging $18.26.
Are restaurant prices rising faster than grocery prices?
Yes. The CPI for food away from home rose 3.5% in the year ending May 2026, compared to a 2.7% increase for food at home over the same period.
Do Americans think restaurants are unfairly raising prices?
Skepticism has grown sharply: only 18% of guests called price increases “completely justified” in 2026, down from 41% in 2024, even though actual dining-out frequency has barely changed.
Which sporting event ticket price rose the most between 2015 and 2026?
The NBA Finals saw the steepest increase, rising 505.2% from $900 in 2015 to $5,447 in 2026.
Is the cost of staying home also rising as fast as going out?
No. The price of home recreation, including televisions and hobby materials, rose just 37% from 2000 to 2026, less than half the overall inflation rate over that period.
Why are Americans cutting back on dining out and entertainment?
56% of guests dining out less cite the overall cost of living as their main reason, compared to just 33% who blame menu prices specifically, suggesting broader economic pressure rather than restaurant pricing alone drives the pullback.
How much does the FIFA World Cup Final cost to attend in 2026?
Average ticket prices for the 2026 FIFA World Cup Final, hosted in North America, exceeded $14,000, the highest of any major sporting event tracked.
Disclaimer: The data research report we present here is based on information found from various sources. We are not liable for any financial loss, errors, or damages of any kind that may result from the use of the information herein. We acknowledge that though we try to report accurately, we cannot verify the absolute facts of everything that has been represented.