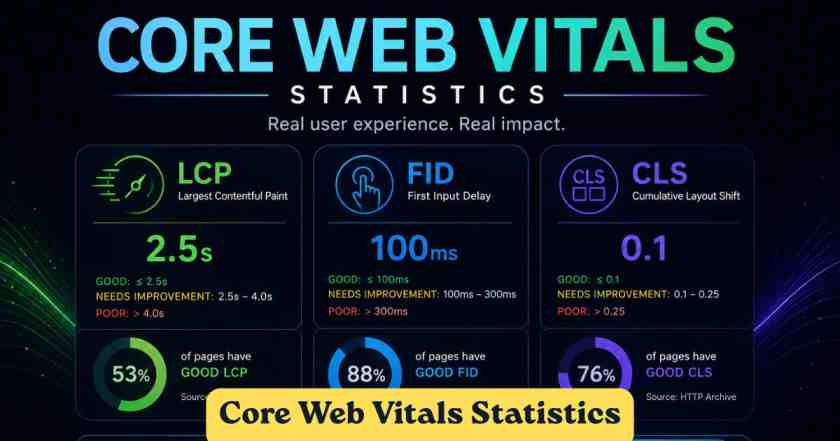
What is Core Web Vitals?
Core Web Vitals are a set of three specific, user-centric performance metrics that Google uses to measure the real-world experience of visiting a webpage. Introduced in 2020 and rolled out as an official ranking signal in May 2021, these metrics go well beyond theoretical speed scores — they capture what actual visitors experience on their own devices and connections. The three metrics are Largest Contentful Paint (LCP), which measures how fast the main content loads; Interaction to Next Paint (INP), which replaced First Input Delay in March 2024 and evaluates how quickly a page responds to user interactions; and Cumulative Layout Shift (CLS), which tracks how visually stable a page remains as it loads. Google evaluates all three at the 75th percentile of real user visits pulled from the Chrome User Experience Report (CrUX), meaning at least 75% of actual page visits must hit the “good” threshold for a site to pass each metric.
What makes Core Web Vitals uniquely important compared to older speed metrics is that they are grounded entirely in field data — measurements from real Chrome users across real devices, real networks, and real geographic conditions. A flawless Lighthouse score of 100 in a controlled lab environment does not guarantee passing Core Web Vitals, because the CrUX dataset captures the messiness of real browsing: slow Android phones, congested 4G networks, older tablets, and users in countries with limited infrastructure. Google uses a 28-day rolling window of this field data when evaluating pages for ranking purposes, which means improvements you make today typically take four to six weeks to fully surface in Google Search Console and in ranking outcomes. In 2026, with the March 2026 core update tightening performance standards and extending evaluation to the domain level, understanding these metrics is no longer optional for any website that depends on organic search visibility.
Interesting Core Web Vitals Facts 2026 — At a Glance
Key Facts About Core Web Vitals 2026
━━━━━━━━━━━━━━━━━━━━━━━━━━━━━━━━━━━━━━━━━━━━━━━━━━━━━━━━━━━━━━━━

  📊 Only 48% of mobile sites pass all 3 CWV metrics
  📊 Only 33% of websites pass all three CWV (some estimates)
  ⚡ 43% of sites fail the 200ms INP threshold
  📉 53% of mobile users leave if a page loads in >3 seconds
  💸 Every 100ms of latency costs Amazon ~1% in sales
  📱 Average mobile page still loads in 8.6 seconds
  🏆 Pages at position #1 are 10% more likely to pass CWV
  🔄 CrUX data updates on a 28-day rolling window
  🌐 CrUX covers ~15 million origins in 2026
  🚀 March 2026 update now evaluates CWV at the domain level

━━━━━━━━━━━━━━━━━━━━━━━━━━━━━━━━━━━━━━━━━━━━━━━━━━━━━━━━━━━━━━━━
| Interesting Fact | Data Point | Source / Context |
|---|---|---|
| Mobile CWV overall pass rate (2025) | 48% of mobile websites pass all three metrics | 2025 Web Almanac (HTTP Archive, July 2025 CrUX data) |
| Desktop CWV overall pass rate (2025) | 56% of desktop websites pass all three metrics | 2025 Web Almanac (HTTP Archive, July 2025 CrUX data) |
| INP failure rate | 43% of sites fail the 200ms INP threshold | Donutz Digital, 2026 |
| LCP — hardest metric to pass (mobile) | Only 62% of mobile pages achieve good LCP | 2025 Web Almanac (HTTP Archive, CrUX) |
| CLS — best-performing metric (mobile) | 81% of mobile pages achieve good CLS | 2025 Web Almanac (HTTP Archive, CrUX) |
| INP pass rate (mobile) | 77% of mobile pages pass INP under 200ms | 2025 Web Almanac (HTTP Archive, CrUX) |
| 3-second mobile abandonment | 53% of mobile visitors leave if a page takes >3 seconds | Industry data cited across multiple studies |
| Average mobile page load time | 8.6 seconds with page weight above 2.3 MB | Industry benchmarks, 2025–2026 |
| Amazon latency cost | Every 100ms of latency costs ~1% in sales | Amazon internal research |
| Rakuten 24 revenue lift | Good LCP led to 53.37% more revenue per visitor | Google web.dev case study |
| Vodafone Italy LCP improvement | 31% LCP improvement → 8% more sales, 15% more leads | Google web.dev case study |
| RedBus INP improvement | Improved INP → 7% increase in sales | Google web.dev case study |
| Pages at position #1 vs position #9 | Position #1 pages are 10% more likely to pass CWV | Industry data, 2026 |
| March 2026 ranking drops | Sites with poor LCP/INP saw drops of 0.8 to 4 positions | Ideafueled.com, April 2026 |
| CrUX coverage in 2026 | Covers approximately 15 million origins | CrUX documentation, 2026 |
Data Sources: 2025 Web Almanac (HTTP Archive), Google web.dev case studies, Chrome User Experience Report (CrUX), Donutz Digital, Ideafueled
The table above tells a clear and somewhat sobering story about the current state of web performance. Despite years of Google pushing site owners toward faster, more stable, and more responsive pages, more than half of all mobile websites still fail at least one of the three Core Web Vitals thresholds as of the most current data available in 2026. The gap between mobile (48%) and desktop (56%) pass rates reflects a fundamental reality: mobile devices carry real-world constraints that lab tests rarely replicate — slower CPUs, inconsistent networks, limited memory — and the web has not yet caught up to those constraints at scale.
The business impact data is perhaps even more striking than the pass rate figures. These are not theoretical projections. Rakuten 24, Vodafone Italy, and RedBus each ran controlled tests where the only variable changed was Core Web Vitals optimization, and each saw measurable lifts in revenue and conversions as a direct result. The fact that 53% of mobile users will abandon a page that takes more than 3 seconds to load — while the average mobile page still loads in 8.6 seconds — underscores how wide the gap remains between what users expect and what most websites actually deliver. For site owners competing in any commercial niche, closing that gap is not a technical nicety; it is a revenue strategy.
Core Web Vitals Metric Thresholds & Scores 2026
Core Web Vitals Thresholds — Visual Score Guide 2026
━━━━━━━━━━━━━━━━━━━━━━━━━━━━━━━━━━━━━━━━━━━━━━━━━━━━━

  LCP (Largest Contentful Paint)
  ▓▓▓▓▓▓▓▓░░░░░░░░░░░░░░░░░░░
  Good:             ≤ 2.0s   [████ Target in 2026]
  Needs Improvement: 2.0–4.0s
  Poor:             > 4.0s

  INP (Interaction to Next Paint)
  ▓▓▓▓▓▓▓▓▓▓▓▓░░░░░░░░░░░░░░
  Good:             ≤ 200ms
  Needs Improvement: 200–500ms
  Poor:             > 500ms

  CLS (Cumulative Layout Shift)
  ▓▓▓▓▓▓▓▓▓▓▓▓▓▓░░░░░░░░░░░░
  Good:             ≤ 0.1
  Needs Improvement: 0.1–0.25
  Poor:             > 0.25

━━━━━━━━━━━━━━━━━━━━━━━━━━━━━━━━━━━━━━━━━━━━━━━━━━━━━
| Metric | What It Measures | Good (2026) | Needs Improvement | Poor | Evaluation Method |
|---|---|---|---|---|---|
| LCP — Largest Contentful Paint | Speed at which main content loads | ≤ 2.0 seconds (tightened in March 2026) | 2.0 – 4.0 seconds | > 4.0 seconds | 75th percentile, field data |
| INP — Interaction to Next Paint | Responsiveness to all user interactions throughout session | ≤ 200 milliseconds | 200 – 500 milliseconds | > 500 milliseconds | 75th percentile, field data |
| CLS — Cumulative Layout Shift | Visual stability during page load | ≤ 0.1 | 0.1 – 0.25 | > 0.25 | 75th percentile, field data |
Data Sources: Google Search Central, web.dev threshold documentation, Ideafueled (March 2026 update confirmation)
One of the most significant 2026 changes to these thresholds is the tightening of the LCP “good” target from 2.5 seconds to 2.0 seconds following the March 2026 core update. This is a meaningful shift for a large proportion of the web, since LCP was already the hardest of the three metrics to pass under the old threshold. The practical implication is that sites which were previously scraping by with an LCP of 2.3 or 2.4 seconds — technically “good” until March 2026 — may now find themselves reclassified into the “needs improvement” range, triggering a reassessment of their ranking signals. Experts in the performance space had been recommending sub-2.0 second LCP targets for competitive sites well before Google made it official, so this change brings the formal threshold in line with what top-performing sites had already been targeting.
The INP metric deserves particular attention in 2026. Replacing First Input Delay (FID) in March 2024, INP is a significantly more demanding test of interactivity because it measures every user interaction throughout the entire page session — not just the first click. A site could have had a perfect FID score while every subsequent interaction took 800 milliseconds to respond; INP would expose that failure immediately. The 200ms good threshold requires that the overwhelming majority of user clicks, taps, and keypresses receive a visible response within that window. Any JavaScript task blocking the main thread for more than 50ms becomes a “long task” that directly threatens INP performance — and with the median mobile page now shipping 697 KB of JavaScript according to the 2025 Web Almanac, the challenge is substantial.
Core Web Vitals Pass Rates 2026 — Mobile vs Desktop
CWV Pass Rate Trend: Mobile vs Desktop (2021–2025)
━━━━━━━━━━━━━━━━━━━━━━━━━━━━━━━━━━━━━━━━━━━━━━━━━━━━━━━━━

  Year     Mobile    Desktop
  ─────────────────────────────────────────────
  2021     32%  ████████░░░░░░░░░░░░░░░░░░░░░
           41%  ██████████░░░░░░░░░░░░░░░░░░░

  2022     31%  ████████░░░░░░░░░░░░░░░░░░░░░
           44%  ███████████░░░░░░░░░░░░░░░░░░

  2023     36%  █████████░░░░░░░░░░░░░░░░░░░░
           48%  ████████████░░░░░░░░░░░░░░░░░

  2024     44%  ███████████░░░░░░░░░░░░░░░░░░
           55%  █████████████░░░░░░░░░░░░░░░░

  2025     48%  ████████████░░░░░░░░░░░░░░░░░
           56%  ██████████████░░░░░░░░░░░░░░░

  Each ░ represents ~4% of total | ████ = passing rate

━━━━━━━━━━━━━━━━━━━━━━━━━━━━━━━━━━━━━━━━━━━━━━━━━━━━━━━━━
| Year | Mobile CWV Pass Rate (All 3 Metrics) | Desktop CWV Pass Rate (All 3 Metrics) | Mobile YoY Change |
|---|---|---|---|
| 2021 | 32% | 41% | — |
| 2022 | 31% | 44% | -1% |
| 2023 | 36% | 48% | +5% |
| 2024 | 44% | 55% | +8% |
| 2025 | 48% | 56% | +4% |
Data Source: 2025 Web Almanac, HTTP Archive (CrUX data, July 2025). Desktop 2025 figure cross-referenced with DebugBear 2025 Year-in-Review (57.1% desktop, 49.7% mobile as of October 2025 CrUX)
The year-on-year improvement in mobile Core Web Vitals pass rates is one of the more encouraging trends in web performance data. Mobile improved from just 32% in 2021 to 48% in 2025 — a 16-percentage-point gain across four years. The largest single-year jump occurred between 2023 and 2024, when mobile pass rates climbed by 8 percentage points, an acceleration that coincided with the official replacement of FID by the stricter INP metric and the subsequent wave of optimization activity it prompted across the developer community. However, the pace of improvement appears to be slowing: the 2024-to-2025 gain was just 4 percentage points, and desktop improvement in the same period was nearly flat, moving from 55% to 56%.
What the trend line does not show — but what matters enormously for site owners — is that more than half the mobile web is still failing as of the most current data. The gap between mobile (48%) and desktop (56%) is persistent and structural. Desktop devices benefit from faster processors, more reliable network connections, and fewer layout constraints, all of which make hitting the “good” thresholds meaningfully easier. Since the majority of web traffic globally originates from mobile devices, a site that passes on desktop but fails on mobile is still receiving a performance penalty in Google’s ranking systems, because CrUX evaluates both form factors and Google’s primary concern is the mobile experience.
Individual Core Web Vitals Metric Pass Rates 2026
Individual Metric Pass Rates — Mobile (2025 Web Almanac)
━━━━━━━━━━━━━━━━━━━━━━━━━━━━━━━━━━━━━━━━━━━━━━━━━━━━━━━━━

  LCP   62%  ████████████████░░░░░░░░░  ← Hardest to pass
  INP   77%  ███████████████████░░░░░░
  CLS   81%  ████████████████████░░░░░  ← Easiest to pass

  Combined pass rate: 48%
  (Must pass ALL THREE simultaneously)

  Note: Combined rate is lower than any single metric
  because a site must clear all three at once.

━━━━━━━━━━━━━━━━━━━━━━━━━━━━━━━━━━━━━━━━━━━━━━━━━━━━━━━━━
| Metric | Mobile Pass Rate (2025) | Desktop Pass Rate (2025, June data) | Status in 2026 |
|---|---|---|---|
| LCP — Largest Contentful Paint | 62% | 74% | Hardest metric — tightened to 2.0s in March 2026 |
| INP — Interaction to Next Paint | 77% | 97% | Replaced FID in March 2024; 43% of sites still struggle |
| CLS — Cumulative Layout Shift | 81% | 72% | Best-performing metric overall |
| All Three Combined (Mobile) | 48% | 56% | Overall pass rate — must clear all three simultaneously |
Data Sources: 2025 Web Almanac (HTTP Archive, CrUX July 2025 data); SEO chapter (Web Almanac, desktop June 2025 CrUX); Donutz Digital 2026 (INP failure rate)
The individual metric breakdown explains exactly why the combined Core Web Vitals pass rate sits at just 48% on mobile despite each individual metric having a higher pass rate on its own. Passing all three simultaneously is the real challenge — a site that achieves good LCP, good CLS, but marginally fails INP still counts as a failing site in Google’s assessment. LCP is the clear bottleneck: at just 62% passing on mobile, it is the metric dragging the overall rate down most significantly. The gap between desktop LCP (74%) and mobile LCP (62%) is a 12-percentage-point spread, which directly reflects how much harder it is to serve optimized hero images and fast-loading main content on constrained mobile hardware and slower connections.
CLS stands out as the metric where mobile actually outperforms desktop — 81% mobile vs 72% desktop as of June 2025 desktop data. This is somewhat counterintuitive, but makes sense when you consider that mobile layouts are typically simpler and less likely to contain complex above-the-fold elements that cause unexpected shifts. The INP disparity between mobile (77%) and desktop (97%) is the most extreme gap of any metric, driven by the reality that JavaScript execution on mobile CPUs is substantially slower than on desktop processors. Reducing JavaScript bundle sizes, deferring third-party scripts, and breaking up long tasks on the main thread are therefore more impactful optimizations on mobile than any other platform.
Core Web Vitals by CMS Platform 2026
CMS Platform Mobile CWV Pass Rate (2025 Web Almanac)
━━━━━━━━━━━━━━━━━━━━━━━━━━━━━━━━━━━━━━━━━━━━━━━━━━━━━━━

  Duda          85% ████████████████████░
  TYPO3         79% ████████████████████
  Wix           74% ██████████████████░░  (+14% YoY)
  Squarespace   ~70%████████████████░░░░  (+8% YoY)
  Joomla        ~65%████████████████░░░░  (+7% YoY)
  Drupal        ~55%█████████████░░░░░░░  (+4% YoY)
  WordPress     ~50%████████████░░░░░░░░  (+4% YoY, desktop)
  Weebly        ~40%██████████░░░░░░░░░░  (-1% YoY)

  Static sites (well-built): up to 95%+

━━━━━━━━━━━━━━━━━━━━━━━━━━━━━━━━━━━━━━━━━━━━━━━━━━━━━━━━━
| CMS Platform | Mobile CWV Pass Rate (2025) | YoY Change (2024→2025) | Key Factor |
|---|---|---|---|
| Duda | 85% | +11% | Tightly managed hosted environment |
| TYPO3 | 79% | +5% | Enterprise-grade, controlled deployments |
| Wix | 74% | +14% (largest gain) | Significant platform-level optimizations |
| Squarespace | ~70% | +8% | Managed infrastructure improvements |
| Joomla | ~65% | +7% | Core updates improving performance defaults |
| Drupal | ~55% | +4% | Extensible platform, variable implementation |
| WordPress (desktop) | 50% (desktop) | +4% | Hosting quality is primary driver; 46% mobile |
| Weebly | ~40% | -1% (only decline) | Only CMS to decline year-over-year |
| Static Sites (well-built) | Up to 95%+ | — | Pre-built HTML, minimal JS, predictable layouts |
Data Sources: 2025 Web Almanac CMS Chapter (HTTP Archive, CrUX); Logoswebdesigns.com April 2026; Hostingstep CWV Stats (November 2025 CrUX data)
The CMS performance data for 2026 tells a story that every site owner on a popular platform needs to internalize: where you host and which platform you build on has a more immediate impact on your Core Web Vitals than almost any individual code optimization you make. Duda leads the CMS landscape at 85% mobile pass rate not because its clients are better developers, but because its vertically integrated environment controls caching, image delivery, and asset optimization at the infrastructure level. Wix deserves particular attention — its +14% year-over-year gain is the largest improvement of any platform in the 2025 Web Almanac dataset, driven by significant investment in platform-level performance infrastructure. That kind of gain does not come from individual site owners tweaking settings; it comes from the platform itself pushing improvements down to every site simultaneously.
WordPress is the most important platform in this table given that it powers more than 60% of CMS-driven sites on the web. Its 50% desktop / 46% mobile pass rate is not a failing of WordPress as software — it is largely a hosting quality issue. The 2025 Web Almanac and independent analysis both confirm that WordPress sites on managed hosting with edge caching (through CDN providers like Cloudflare) significantly outperform those on standard shared hosting. Every millisecond of Time to First Byte (TTFB) transfers directly into LCP time, and shared hosting with no edge caching routinely produces TTFB values well above the 200ms gold standard recommended for 2026. The Weebly decline is the only negative data point in the table and serves as a reminder that standing still on performance in 2026 — while Google raises the bar — effectively means moving backward.
Core Web Vitals Impact on Business & Revenue 2026
Conversion Rate vs Page Load Time
━━━━━━━━━━━━━━━━━━━━━━━━━━━━━━━━━━━━━━━━━━━━━━━━━━━━━━━

  Load Time   Avg Conversion Rate
  ─────────────────────────────────────────────────────
  1 second    ~40%  ████████████████████████████████████████
  2 seconds   ~34%  ██████████████████████████████████
  3 seconds   ~29%  █████████████████████████████
  5 seconds   ~38% bounce ███████████████████████████████████

  ⚡ 0.1s improvement = +8.4% conversions (retail)
  ⚡ 0.1s improvement = +10.1% conversions (travel)
  ⚡ 1 second delay   = -7% conversions, -11% pageviews

━━━━━━━━━━━━━━━━━━━━━━━━━━━━━━━━━━━━━━━━━━━━━━━━━━━━━━━━━
| Business Metric | Impact Data | Source / Context |
|---|---|---|
| Load time vs conversion — 1 second | Conversion rate: ~40% | Industry benchmarks, 2025–2026 |
| Load time vs conversion — 2 seconds | Conversion rate drops to ~34% | Industry benchmarks |
| Load time vs conversion — 3 seconds | Conversion rate drops to ~29% | Industry benchmarks |
| 0.1-second speed improvement (retail) | +8.4% conversion rate increase | Google & Deloitte “Milliseconds Make Millions” study |
| 0.1-second speed improvement (travel) | +10.1% conversion rate increase | Google & Deloitte “Milliseconds Make Millions” study |
| 1-second page delay cost | -7% conversions, -11% page views, -16% customer satisfaction | Industry data |
| Rakuten 24 (LCP optimization) | +53.37% revenue per visitor, +33.13% conversion rate | Google web.dev official case study |
| Vodafone Italy (31% LCP improvement) | +8% sales, +15% leads, +11% cart-to-visit rate | Google web.dev official case study |
| RedBus (INP improvement) | +7% sales increase | Google web.dev official case study |
| Ray-Ban (Speculation Rules API) | +101.47% mobile conversion rate on product pages | Google web.dev official case study |
| E-commerce sites at “good” CWV | Report 15–30% conversion improvement | ALM Corp analysis, 2026 |
| Organic traffic after CWV optimization | Increases of 12–20% documented | ALM Corp analysis, 2026 |
Data Sources: Google web.dev case studies (Rakuten, Vodafone, RedBus, Ray-Ban); Google & Deloitte “Milliseconds Make Millions” study; ALM Corp 2026 analysis; Logoswebdesigns.com April 2026
The business case for Core Web Vitals optimization in 2026 is now backed by a body of real-world evidence that moves it well beyond theoretical SEO advice. The Rakuten 24 case study is particularly striking because the methodology was rigorous — an A/B test where the only variable was LCP optimization, and the outcome was a +53.37% lift in revenue per visitor. This is not a correlation study; it is a controlled experiment with a single variable. The Ray-Ban result — a +101.47% increase in mobile conversion rates on product pages — demonstrates that the impact compounds in mobile-first commerce scenarios, where slow interactions create enough friction to double the abandonment rate.
The Google and Deloitte “Milliseconds Make Millions” research provides the most useful rule of thumb for communicating the value of performance work to non-technical stakeholders: every 0.1 seconds of load improvement translates to +8.4% more conversions in retail and +10.1% more in travel. Applied to almost any real business with meaningful traffic, that fraction of a second improvement represents a measurable and significant revenue outcome. Combined with the documented 12–20% organic traffic increases that follow comprehensive Core Web Vitals optimization, the return on investment for performance work in 2026 is clearer and more quantifiable than it has ever been.
Core Web Vitals by Page Type & Site Popularity 2026
CWV Pass Rate: Homepage vs Secondary Pages (Mobile, 2025)
━━━━━━━━━━━━━━━━━━━━━━━━━━━━━━━━━━━━━━━━━━━━━━━━━━━━━━━━

  Home Pages:        45%  ███████████░░░░░░░░░░░░░
  Secondary Pages:   56%  ██████████████░░░░░░░░░░

  Difference: Secondary pages outperform homepages by +11%

  CWV by Site Popularity Rank (Mobile, 2025):
  ─────────────────────────────────────────────────
  Top 1,000 sites      51%  █████████████░░░░░░░░░
  Top 10,000 sites     42%  ███████████░░░░░░░░░░░
  Top 100,000 sites    37%  █████████░░░░░░░░░░░░░
  Top 1,000,000 sites  42%  ███████████░░░░░░░░░░░
  Top 10,000,000 sites 48%  ████████████░░░░░░░░░░

━━━━━━━━━━━━━━━━━━━━━━━━━━━━━━━━━━━━━━━━━━━━━━━━━━━━━━━━
| Page / Site Category | Mobile CWV Pass Rate | Desktop CWV Pass Rate | Notes |
|---|---|---|---|
| Home Pages | 45% | 47% | More dynamic content, hero images, third-party scripts |
| Secondary / Inner Pages | 56% | 61% | Benefit from caching, more templated, less complex |
| Top 1,000 most popular sites | 51% | 59% | High investment in optimization |
| Top 10,000 sites | 42% | — | Mid-popularity drop-off |
| Top 100,000 sites | 37% | — | Lowest pass rate tier — complexity vs investment gap |
| Top 1,000,000 sites | 42% | — | Slight recovery |
| Top 10,000,000 sites | 48% | — | Smaller, simpler sites benefit from lower complexity |
Data Source: 2025 Web Almanac, HTTP Archive, Performance Chapter (CrUX data, July 2025)
The breakdown by page type reveals an often-overlooked pattern in Core Web Vitals data: secondary pages consistently outperform home pages by a significant margin — +11 percentage points on mobile and +14 points on desktop. This gap exists for several structural reasons. Home pages are the most frequently updated pages on most sites, the most likely to carry large hero images, promotional banners, personalization widgets, A/B test variations, and multiple third-party tag loads. Secondary pages — category pages, blog posts, product detail pages — tend to follow more predictable templates, benefit from browser caching of previously loaded resources, and carry fewer competing elements. For site owners who feel overwhelmed by Core Web Vitals optimization, this data points to a clear starting priority: the homepage template is almost always the highest-impact page to fix first.
The popularity tier data exposes an interesting pattern that performance researchers sometimes call the “mid-popularity valley.” The very largest sites (top 1,000) have the resources and motivation to invest heavily in performance optimization. The very smallest sites (top 10 million) are often simple pages with low JavaScript complexity and few third-party integrations, which means they naturally perform better without deliberate optimization effort. The middle tiers — particularly the top 10,000 to 100,000 sites — combine the feature complexity of large sites with less sustained investment in optimization, producing the lowest Core Web Vitals pass rates in the entire dataset at just 37% on mobile. If your site falls into this mid-popularity range and is competing in a commercial niche, the performance gap between you and the top-tier sites is your most actionable competitive opportunity.
Core Web Vitals & SEO Rankings 2026
CWV Correlation With Search Ranking Position
━━━━━━━━━━━━━━━━━━━━━━━━━━━━━━━━━━━━━━━━━━━━━━━━━━━━━━

  Ranking   Likelihood of Passing CWV
  ─────────────────────────────────────────────────────
  Pos. #1   ██████████████████████████  +10% advantage
  Pos. #3   █████████████████████████
  Pos. #5   ████████████████████████
  Pos. #7   ████████████████████████
  Pos. #9   ████████████████████████  (baseline)

  March 2026 Core Update ranking drops:
  ──────────────────────────────────────
  Poor LCP / INP sites: -0.8 to -4 positions
  Some domains: > -50% traffic on worst sections

━━━━━━━━━━━━━━━━━━━━━━━━━━━━━━━━━━━━━━━━━━━━━━━━━━━━━━
| SEO & Ranking Data Point | Statistic | Context |
|---|---|---|
| Position #1 vs #9 CWV advantage | +10% more likely to pass CWV at position #1 | Industry data, 2026 |
| March 2026 ranking drops (poor CWV) | -0.8 to -4 positions on competitive queries | Ideafueled April 2026; Logoswebdesigns April 2026 |
| Traffic losses at March 2026 update | Some domains lost 20–35% traffic; worst-hit sections lost 50%+ | Logoswebdesigns, Ahrefs, Semrush tracking |
| Domain-level evaluation (new in 2026) | If >25% of URLs are “poor/needs improvement,” site-wide penalty likely | Logoswebdesigns analysis, April 2026 |
| AI Overviews visibility | Sites with poor CWV rarely appear in AI-generated search responses | CD Studio December 2025 analysis |
| WordPress mobile CWV pass rate | ~45% on mobile (vs Webflow/Duda at 65–85%) | Logoswebdesigns April 2026 |
| Static sites (well-built) pass rate | Up to 95%+ — highest of any architecture type | Logoswebdesigns April 2026 |
| CWV as ranking factor start | June 2021 (mobile), March 2022 (desktop) | Google Search Central |
| CrUX data window | 28-day rolling — improvements take 4–6 weeks to reflect | Google / CrUX documentation |
Data Sources: Ideafueled.com (April 2026), Logoswebdesigns.com (April 2026), CD Studio December 2025, Google Search Central, ALM Corp 2026
The March 2026 core update fundamentally changed the stakes attached to Core Web Vitals. Before this update, CWV were evaluated at the page level — a slow landing page might hurt rankings for that specific URL while the rest of the site remained unaffected. The 2026 update introduced domain-level aggregation: Google now considers the performance profile of the entire site when assessing ranking signals, which means that a handful of poorly optimized template pages can drag down rankings across pages that individually pass every threshold. Industry analysis suggests that when more than 25% of a site’s URLs fall into the “poor” or “needs improvement” category on any single metric, a site-wide ranking penalty becomes likely. That is an unforgiving standard for sites built on legacy themes or loaded with unoptimized third-party plugins.
The AI Overviews connection adds a new dimension to the business case in 2026. According to analysis from CD Studio in late 2025, sites with poor Core Web Vitals performance rarely appear in Google’s AI-generated search responses, which are increasingly consuming the top of search result pages. As AI Overviews take up more SERP real estate, a slow site does not just lose traditional organic click-through — it also loses the opportunity to be cited or surfaced in AI-generated answers. The performance bar for visibility in the modern SERP is, in effect, higher in 2026 than at any previous point since Core Web Vitals were introduced.
Core Web Vitals for Ecommerce Sites 2026
Ecommerce CWV Pass Rate vs Global Average (Mobile, 2025)
━━━━━━━━━━━━━━━━━━━━━━━━━━━━━━━━━━━━━━━━━━━━━━━━━━━━━━━

  Global Average:        48%  ████████████░░░░░░░░
  Ecommerce Average:     39%  ██████████░░░░░░░░░░  (-9%)

  LCP: Most challenging for ecommerce (product grids,
       hero imagery, personalization widgets)
  INP: Heavy JS from filters, cart, checkout flows
  CLS: Dynamic banners, late-loading product images

  Revenue Impact (Google & Deloitte):
  ─────────────────────────────────────
  Every 0.1s faster → +8% conversions (retail)
  Ecommerce CWV "good" → 15–30% conversion lift

━━━━━━━━━━━━━━━━━━━━━━━━━━━━━━━━━━━━━━━━━━━━━━━━━━━━━━━━
| Ecommerce CWV Data Point | Statistic | Source |
|---|---|---|
| Overall ecommerce CWV pass rate (mobile, 2025) | 39% — 3 points below the global average of 42% | HTTP Archive 2025 (ecommerce chapter) |
| Revenue impact of 0.1s improvement (retail) | +8% conversion rate | Google & Deloitte “Milliseconds Make Millions” |
| Revenue impact of 0.1s improvement (travel) | +10% conversion rate | Google & Deloitte “Milliseconds Make Millions” |
| LCP role in ecommerce | Hero imagery, product grids — most common LCP element | HTTP Archive 2025 Ecommerce Chapter |
| INP risk in ecommerce | Heavy JS from filters, cart interactions, checkout flows | HTTP Archive 2025 Ecommerce Chapter |
| CLS risk in ecommerce | Dynamic banners, late-loading product images, personalization | HTTP Archive 2025 Ecommerce Chapter |
| WooCommerce CWV pass rate | Lags behind SaaS ecosystems (Shopify, Squarespace Commerce) | HTTP Archive 2025 Ecommerce Chapter |
| Squarespace Commerce improvement | From 33% good in 2022 to 60% good in 2024 | HTTP Archive 2024 Ecommerce Chapter |
| E-commerce “good” CWV conversion lift | 15–30% reported by sites achieving good thresholds | ALM Corp 2026 analysis |
Data Sources: 2025 Web Almanac Ecommerce Chapter (HTTP Archive); 2024 Web Almanac Ecommerce Chapter; Google & Deloitte “Milliseconds Make Millions” study; ALM Corp 2026; ighenatt.es March 2026
Ecommerce sites face a uniquely difficult Core Web Vitals challenge compared to almost any other category of website, and the data confirms it: at just 39% passing all three metrics on mobile, ecommerce sits below the already-low global average of 42–48%. The reason is structural. An online shopper’s journey involves a cascade of interactions — browsing categories, filtering by attributes, zooming into product images, adding items to a cart, entering shipping information, applying coupon codes — and each of those steps is an opportunity for a slow LCP, an unstable CLS shift from a late-loading personalization widget, or a sluggish INP response from an overloaded JavaScript bundle managing the cart state. The compounding nature of these performance failures across multiple page interactions is what makes ecommerce the sector most directly harmed by poor Core Web Vitals scores.
The Google and Deloitte research provides the most commercially compelling case for ecommerce performance investment: every 0.1 seconds of improvement generates +8% in retail conversions. For any online store generating meaningful revenue, that figure translates into a concrete and calculable return on investment from performance engineering. The Squarespace Commerce trajectory — from 33% good in 2022 to 60% good in 2024 — illustrates what is possible when a platform makes sustained infrastructure-level investment in performance. WooCommerce, despite its massive market share, continues to lag because its open architecture means performance is entirely dependent on the individual hosting, theme, and plugin choices made by each site owner. In 2026, managed hosting with edge caching is not a luxury for WooCommerce stores — it is the single highest-impact performance decision available.
Disclaimer: The data research report we present here is based on information found from various sources. We are not liable for any financial loss, errors, or damages of any kind that may result from the use of the information herein. We acknowledge that though we try to report accurately, we cannot verify the absolute facts of everything that has been represented.