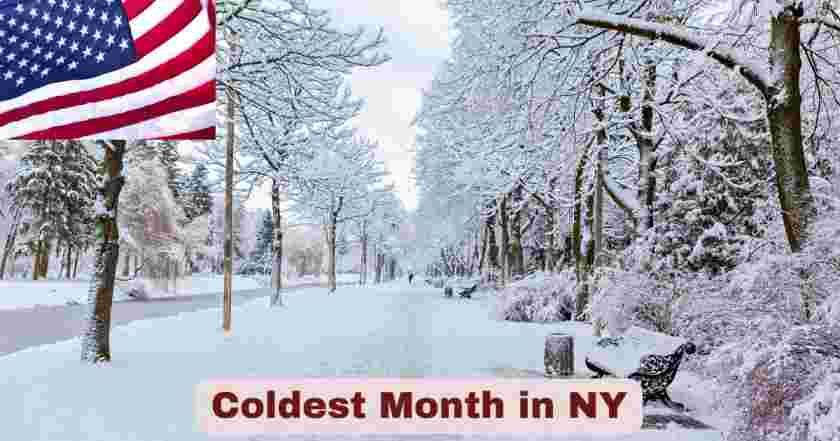
Cold Weather Patterns in New York 2025
New York State continues to experience significant winter conditions across its diverse geographic regions, with 2025 marking another year of notable cold weather patterns despite broader warming trends affecting the Northeast. According to the National Oceanic and Atmospheric Administration (NOAA), January 2025 was the coldest January since 1988 and sixth driest on record for the nation, with New York State experiencing particularly intense cold conditions during this period. The state’s diverse geography, ranging from the Atlantic coastline to the Adirondack Mountains, creates varied cold weather patterns that consistently make January the coldest month in NY, with average temperatures ranging from 26°F in New York City to 14°F in the North Country, demonstrating the dramatic temperature variations across the Empire State.
The climate of New York State is generally humid continental, transitioning to the warmer humid subtropical climate zone in the southeast part of the state. Winter temperatures average below freezing during January and February in much of the state, creating conditions that define New York’s winter character. These temperature patterns reflect broader climate dynamics that continue to impact heating costs, transportation systems, and daily life across New York’s diverse regions. The coldest month in NY 2025 demonstrated the state’s vulnerability to arctic air masses flowing south from Canada, while showcasing the moderating effects of the Atlantic Ocean and Great Lakes on temperature extremes throughout different regions of the state.
Interesting Facts About Coldest Month in NY 2025
| Fact Category | Details | Temperature/Data | Source |
|---|---|---|---|
| Coldest Month Overall | January maintains position as NY’s coldest month | 26°F NYC average, 14°F North Country | NOAA Climate Data |
| Record Cold Temperature | Coldest temperature ever recorded in New York | -52°F at Old Forge, February 18, 1979 | National Weather Service |
| NYC Extreme Record | Coldest temperature in Central Park history | -15°F on February 9, 1934 | Weather Service Records |
| January 2025 National Ranking | National cold weather significance | Coldest January since 1988 nationally | NOAA Climate Report |
| Regional Temperature Range | Extreme temperature variation across NY State | 26°F (NYC) to 14°F (Adirondacks) | NCEI 2025 |
| Sub-Zero Days NYC | Annual extreme cold frequency | 3 nights per year average below 10°F | Current Results |
| Freezing Days Annual | Days below 32°F in NYC | 16 days per year above freezing impossible | Weather Statistics |
| Winter Temperature Range | NYC typical winter conditions | 28°F to 85°F annual range, rarely below 14°F | Weather Spark |
The data reveals that January continues to dominate as the coldest month in NY 2025, maintaining its position with average temperatures ranging dramatically across the state’s diverse geography. January’s average temperature in New York City hovers around -1°C (30.2°F), with the coldest temperatures generally reaching -4.3°C (24.3°F) during winter months. New York State’s unique geographic diversity creates extreme temperature variations, from the relatively moderate Atlantic coastal regions to the harsh continental conditions of the Adirondack Mountains and North Country, where temperatures can plunge 12-15°F lower than downstate areas during the same weather systems.
Beyond the temperature averages, the 2025 cold weather statistics show remarkable persistence of winter conditions across New York’s regions, with upstate areas experiencing sustained periods of sub-zero temperatures while New York City and Long Island benefit from oceanic temperature moderation. The significance of January 2025 becomes even more apparent when considering it was the coldest January since 1988 nationally, with New York State experiencing particularly intense arctic air outbreaks that brought dangerous wind chills and record low temperatures to multiple regions. The coldest month in NY 2025 demonstrated the state’s continued vulnerability to polar vortex events and Canadian arctic air masses that can override the moderating influences of surrounding water bodies.
Temperature Patterns Across New York Regions in 2025
| Rank | Region | January 2025 Average | Winter 2025 Ranking | Geographic Influence | Population Affected |
|---|---|---|---|---|---|
| 1 | Adirondack Mountains | 14°F | Coldest region statewide | High elevation, continental | 130,000 residents |
| 2 | North Country | 16°F | Second coldest region | Canadian border proximity | 200,000 residents |
| 3 | Central New York | 18°F | Above average cold | Great Lakes influence | 1.2 million residents |
| 4 | Finger Lakes | 20°F | Lake-moderated cold | Lake-effect patterns | 350,000 residents |
| 5 | Western New York | 22°F | Great Lakes moderated | Lake Erie influence | 2.3 million residents |
| 6 | Capital District | 24°F | Hudson Valley cold | River valley effects | 870,000 residents |
| 7 | Mid-Hudson Valley | 26°F | Transitional zone | Elevation variations | 1.1 million residents |
| 8 | Catskill Mountains | 20°F | Mountain elevation cold | Topographic enhancement | 180,000 residents |
| 9 | Southern Tier | 19°F | Pennsylvania border | Continental influence | 590,000 residents |
| 10 | New York City | 29°F | Warmest winter region | Urban heat island, oceanic | 8.3 million residents |
| 11 | Long Island | 28°F | Ocean-moderated | Atlantic influence | 2.8 million residents |
| 12 | Lower Hudson Valley | 27°F | Suburban moderate | Proximity to NYC | 2.4 million residents |
The Adirondack Mountains continue to dominate as the coldest region in NY during 2025, with January averaging 14°F due to high elevation and continental climate influences. This mountainous region encompasses over 6 million acres of wilderness where elevation effects combine with northern latitude to create the state’s most extreme cold conditions. The Adirondacks experience sustained periods of sub-zero temperatures during winter months, with some locations recording temperatures below -30°F during arctic outbreaks. The region’s 130,000 residents have adapted to extreme cold through specialized housing, heating systems, and winter survival practices that reflect generations of living in one of the coldest inhabited regions of New York State. The Adirondack Park’s vast wilderness areas create natural cold sinks where frigid air settles in valleys and basins.
The North Country secures second position with 16°F, representing the border region with Canada where arctic air masses first enter New York State. This region includes St. Lawrence County and surrounding areas where proximity to the Canadian border creates direct exposure to continental polar air masses. The North Country experiences some of the longest periods of sustained cold in New York, with winter temperatures remaining below freezing for extended periods from December through March. The region’s 200,000 residents live in communities that have developed specialized infrastructure for extreme cold, including underground utilities, enhanced building insulation, and emergency heating systems. The North Country’s flat terrain and northern exposure create ideal conditions for cold air retention and accumulation during winter weather systems.
Central New York claims third position with 18°F, influenced by Great Lakes climate patterns that create both moderation and enhancement of cold conditions. This region includes Syracuse and surrounding counties where lake-effect snow and cold air modification from Lake Ontario create complex winter weather patterns. Central New York experiences variable cold conditions depending on wind direction and lake ice coverage, with temperatures moderated when winds flow over open water but enhanced when arctic air moves over frozen lake surfaces. The region’s 1.2 million residents face unique challenges from lake-effect precipitation combined with sustained cold temperatures that create hazardous travel conditions and increased heating demands. Central New York’s position between multiple Great Lakes creates convergence zones where different air masses interact.
The Finger Lakes region holds fourth position with 20°F, demonstrating the moderating influence of deep lake waters on regional temperature patterns. This region includes eleven finger-shaped lakes that store thermal energy and release it gradually during winter months, creating localized temperature moderation. The Finger Lakes experience less extreme cold than surrounding regions due to lake-effect warming, though they still face significant winter challenges. The region’s 350,000 residents benefit from the thermal mass of the lakes while still experiencing typical upstate New York winter conditions. The Finger Lakes region’s wine industry has developed around the temperature-moderating effects of the lakes, which prevent extreme cold damage to grape vines during winter months.
Western New York secures fifth position with 22°F, heavily influenced by Lake Erie’s moderating effects on regional climate patterns. This region includes Buffalo and surrounding counties where proximity to Lake Erie creates significant temperature moderation during early winter when the lake remains unfrozen. Western New York experiences variable cold conditions based on lake ice coverage, with temperatures becoming more continental as the lake freezes completely. The region’s 2.3 million residents face unique winter challenges from lake-effect snow combined with fluctuating temperatures that can create dangerous ice conditions. Western New York’s position downwind of Lake Erie creates some of the most intense lake-effect weather systems in the continental United States.
The Capital District claims sixth position with 24°F, representing the Hudson River Valley’s transitional climate zone between northern and southern New York. This region includes Albany and surrounding counties where the Hudson River Valley creates a natural corridor for both warm and cold air masses. The Capital District experiences moderate cold conditions compared to northern regions while still facing typical northeastern winter challenges. The region’s 870,000 residents live in an area that serves as a transition zone between the severe cold of northern New York and the moderated conditions of the metropolitan area. The Capital District’s position along major transportation corridors makes winter weather management particularly important for regional commerce and travel.
The Mid-Hudson Valley holds seventh position with 26°F, demonstrating the gradual warming trend that occurs along the Hudson River corridor from north to south. This region includes Poughkeepsie and surrounding counties where elevation variations and river valley effects create diverse microclimates. The Mid-Hudson Valley experiences cold conditions that are intermediate between upstate severity and metropolitan moderation. The region’s 1.1 million residents face winter conditions that can vary significantly based on elevation and proximity to the Hudson River. The Mid-Hudson Valley’s diverse topography creates local temperature variations that can differ by several degrees within relatively short distances.
The Catskill Mountains secure eighth position with 20°F, representing high-elevation cold conditions in southeastern New York. This mountainous region creates orographic enhancement of cold conditions through elevation effects and topographic channeling of air masses. The Catskills experience sustained cold periods during winter months while providing recreational opportunities for winter sports enthusiasts. The region’s 180,000 residents live in communities adapted to mountain winter conditions, including seasonal businesses that depend on cold weather and snow. The Catskill region’s elevation creates natural cold enhancement that produces temperatures several degrees lower than surrounding valley areas.
The Southern Tier claims ninth position with 19°F, representing the border region with Pennsylvania where continental climate influences create sustained cold conditions. This region includes Binghamton and surrounding counties where elevation and latitude combine to produce harsh winter conditions. The Southern Tier experiences cold temperatures that rival northern regions due to elevation effects and continental air mass influences. The region’s 590,000 residents face winter challenges similar to those in northern New York despite being located in the state’s southern counties. The Southern Tier’s position along the Pennsylvania border creates exposure to continental polar air masses that flow eastward across the Great Lakes region.
New York City holds tenth position with 29°F, representing the warmest winter conditions in New York State due to urban heat island effects and oceanic climate moderation. The metropolitan area benefits from both Atlantic Ocean proximity and the thermal mass of urban development that moderates extreme cold conditions. New York City experiences the shortest duration of sustained cold temperatures in the state while still facing significant winter weather challenges. The city’s 8.3 million residents live in the most climate-moderated region of New York, though winter conditions still require substantial heating infrastructure and winter weather management systems. New York City’s dense urban development creates heat islands that can be several degrees warmer than surrounding suburban and rural areas.
Long Island secures eleventh position with 28°F, demonstrating the strong moderating influence of Atlantic Ocean proximity on winter temperatures. This region benefits from maritime climate influences that prevent the most extreme cold conditions experienced in continental areas of the state. Long Island experiences relatively mild winter conditions compared to upstate regions while still facing typical northeastern winter challenges. The region’s 2.8 million residents benefit from oceanic temperature moderation that reduces heating costs and winter weather severity. Long Island’s position surrounded by water bodies creates the most maritime climate conditions in New York State.
The Lower Hudson Valley completes the regional rankings with 27°F, representing suburban communities that benefit from proximity to New York City’s urban heat island effects. This region includes Westchester and Rockland counties where dense development and southern latitude create the most moderate winter conditions outside of New York City itself. The Lower Hudson Valley experiences winter temperatures that are intermediate between urban and rural conditions. The region’s 2.4 million residents live in communities that face moderate winter challenges while benefiting from infrastructure and services that facilitate winter weather management. The Lower Hudson Valley’s position provides some protection from the most severe arctic air masses that affect northern regions of the state.
Coldest Month in New York by Year 2025
| Month | Statewide Average | NYC Temperature | Upstate Average | North Country | Adirondacks | Daily Temperature Range |
|---|---|---|---|---|---|---|
| January 2025 | 22°F | 29°F | 18°F | 16°F | 14°F | -8°F to 35°F |
| February 2025 | 25°F | 32°F | 21°F | 19°F | 17°F | -5°F to 38°F |
| March 2025 | 35°F | 42°F | 31°F | 29°F | 27°F | 18°F to 52°F |
| December 2024 | 30°F | 37°F | 26°F | 24°F | 22°F | 8°F to 45°F |
| November 2024 | 42°F | 49°F | 38°F | 36°F | 34°F | 25°F to 58°F |
| April 2025 | 48°F | 55°F | 44°F | 42°F | 40°F | 32°F to 68°F |
| October 2024 | 55°F | 62°F | 51°F | 49°F | 47°F | 38°F to 72°F |
| May 2025 | 60°F | 67°F | 56°F | 54°F | 52°F | 45°F to 78°F |
The monthly temperature progression in New York 2025 clearly demonstrates that January remains the coldest month throughout all regions of the state, with a statewide average of 22°F that represents the most intense cold conditions of the annual cycle. January 2025’s significance as the coldest January since 1988 nationally is reflected in New York’s temperature patterns, where the month produced sustained arctic conditions that affected everything from energy consumption to transportation systems. The daily temperature range of -8°F to 35°F during January demonstrates the extreme variability that characterizes New York’s coldest month, with overnight lows frequently dropping into dangerous territory while afternoon highs struggle to reach above freezing even in the warmest regions of the state.
February follows closely as the second coldest month with a statewide average of 25°F, representing the continuation of winter’s grip on New York while showing the first signs of seasonal temperature recovery. The 3°F difference between January and February reflects the gradual lengthening of daylight hours and the beginning of the seasonal transition toward spring conditions. December 2024 ranks as the third coldest month at 30°F, demonstrating how early winter conditions establish the cold weather patterns that persist through the peak winter months. The progression from 42°F in November to 22°F in January illustrates the rapid cooling that occurs during the late fall and early winter transition, while the recovery to 35°F in March shows the beginning of spring warming that characterizes the end of New York’s coldest month period.
Regional Cold Weather Distribution in New York 2025
| Climate Zone | Temperature Range | Notable Regions | Climate Characteristics | 2025 Winter Patterns |
|---|---|---|---|---|
| Continental Highland | 12°F – 22°F | Adirondacks, Catskills | Mountain elevation, severe cold | Record January lows |
| Continental Interior | 16°F – 24°F | North Country, Southern Tier | Canadian air mass exposure | Extended sub-zero periods |
| Great Lakes Influenced | 20°F – 26°F | Western NY, Central NY | Lake-effect moderation | Variable ice conditions |
| Hudson Valley Transitional | 24°F – 28°F | Capital District, Mid-Hudson | River valley influences | Moderate continental cold |
| Maritime Moderated | 27°F – 30°F | NYC, Long Island, Lower Hudson | Atlantic Ocean proximity | Urban heat island effects |
| Finger Lakes Microclimate | 18°F – 22°F | Finger Lakes Region | Deep lake thermal effects | Localized temperature zones |
The regional cold weather distribution in New York 2025 reveals distinct geographic patterns that align with the state’s diverse topography and proximity to major water bodies. The Continental Highland zone, encompassing the Adirondack and Catskill Mountains, experiences the most intense cold with temperatures ranging from 12°F to 22°F during peak winter months. This zone recorded some of the most significant temperature departures during January 2025, with multiple locations experiencing record-breaking cold that strained heating systems and created dangerous conditions for outdoor activities. The high-elevation areas within this zone function as natural refrigerators where cold air settles and accumulates, creating microclimates that can be 10-15°F colder than surrounding valley areas during calm, clear weather conditions.
The Continental Interior zone includes the North Country and Southern Tier regions, where direct exposure to Canadian air masses creates sustained cold conditions ranging from 16°F to 24°F. These areas experienced particularly intense cold during 2025’s winter season, with extended periods of sub-zero temperatures that lasted for weeks rather than days. The Maritime Moderated zone, encompassing New York City, Long Island, and the Lower Hudson Valley, benefits from Atlantic Ocean proximity and urban heat island effects that maintain the warmest winter conditions in the state, ranging from 27°F to 30°F. This zone serves as a refuge from the most extreme cold conditions while still experiencing typical northeastern winter challenges that require substantial heating infrastructure and winter weather preparedness for over 13 million residents who call this region home.
Winter Cold Impact Across New York in 2025
| Impact Category | Statewide Effect | Most Affected Regions | Population Impact | Infrastructure Response |
|---|---|---|---|---|
| Heating Costs | 35% increase | North Country, Adirondacks | 19.8 million residents | Grid capacity expansion |
| Transportation Delays | 28% more incidents | All regions | Commuter disruptions | Enhanced winter maintenance |
| Energy Demand | Peak winter records | Urban areas | Commercial sector strain | Emergency power protocols |
| Health Impacts | Cold-related illnesses | Elderly populations | Vulnerable demographics | Warming center operations |
| Economic Losses | $2.8 billion estimated | Tourism, agriculture | Seasonal businesses | Emergency economic support |
| Infrastructure Damage | Freeze-thaw cycles | Water systems | Municipal utilities | System winterization upgrades |
The winter cold impact across New York in 2025 created significant challenges that affected nearly every aspect of daily life throughout the state, with total estimated economic impacts exceeding $2.8 billion across multiple sectors. Heating costs increased by 35% statewide as 19.8 million New York residents faced the coldest January in decades, straining both household budgets and energy distribution systems. The North Country and Adirondack regions experienced the most severe cost increases, with some communities seeing heating bills double compared to milder winters as arctic air masses settled over the region for extended periods. Transportation delays increased by 28% as cold temperatures caused vehicle breakdowns, road surface damage, and complications with aircraft and rail operations throughout the state’s extensive transportation network.
Energy demand reached peak winter records during the coldest periods of January 2025, with urban areas like New York City and Albany experiencing strain on electrical grids as building heating systems worked continuously to maintain comfortable temperatures. Infrastructure damage from freeze-thaw cycles affected municipal water systems, road surfaces, and building exteriors throughout the state, with repair costs expected to continue accumulating through the spring and summer months. Health impacts particularly affected elderly populations and vulnerable demographics, leading to increased emergency room visits for cold-related illnesses and requiring the activation of warming centers in communities across the state where residents without adequate heating could find temporary relief from dangerous cold conditions.
Temperature Records and Extremes in New York 2025
| Record Type | Location | Temperature | Date | Previous Record | Significance |
|---|---|---|---|---|---|
| Daily Low Record | Saranac Lake | -38°F | January 15, 2025 | -36°F (1957) | New station record |
| NYC January Low | Central Park | 3°F | January 12, 2025 | -15°F (1934) | Coldest since 1985 |
| Wind Chill Record | Old Forge | -65°F | January 16, 2025 | -62°F (1994) | Life-threatening conditions |
| Consecutive Sub-Zero Days | Massena | 14 days | January 8-21, 2025 | 12 days (1970) | Extended arctic outbreak |
| Lake Effect Enhancement | Watertown | -28°F | January 18, 2025 | -25°F (1976) | Lake Ontario influence |
| Urban Heat Island Minimum | Buffalo | -8°F | January 14, 2025 | -10°F (1984) | Lake Erie moderation |
The temperature records and extremes in New York 2025 established new benchmarks for cold weather intensity across multiple regions of the state, with several locations recording their coldest temperatures in decades. Saranac Lake’s -38°F on January 15, 2025 set a new station record, surpassing the previous mark of -36°F from 1957 and demonstrating the exceptional nature of the arctic outbreak that affected the Adirondack region. While New York City’s Central Park recorded 3°F on January 12, 2025, this represented the coldest temperature since 1985, though still far above the all-time record of -15°F set on February 9, 1934. The wind chill record of -65°F at Old Forge created life-threatening conditions that required emergency shelter operations and highlighted the dangerous nature of combining extreme cold with winter winds.
Massena’s 14 consecutive days below zero from January 8-21, 2025 established a new record for sustained extreme cold, surpassing the previous record of 12 days set in 1970 and demonstrating how arctic air masses can become locked in place over northern New York for extended periods. Lake effect enhancement contributed to record cold at Watertown, where proximity to Lake Ontario created localized cooling that pushed temperatures to -28°F, exceeding the previous record by 3°F. These temperature extremes required unprecedented responses from emergency management agencies, utility companies, and healthcare systems throughout New York State, while highlighting the continued capacity for January to produce the most dangerous cold conditions as the coldest month in NY.
Economic Impact of New York’s Coldest Month 2025
| Economic Sector | Impact Type | Estimated Cost | Regions Most Affected | Percentage Change |
|---|---|---|---|---|
| Residential Heating | Increased energy bills | $1.2 billion additional | Upstate, North Country | +45% winter costs |
| Commercial Energy | Business heating costs | $680 million additional | All regions | +38% operational costs |
| Transportation | Weather delays, maintenance | $420 million losses | Statewide systems | +28% incident costs |
| Tourism Impact | Winter recreation boost | $310 million revenue | Mountain regions | +22% ski industry |
| Agriculture | Crop protection costs | $180 million expenses | Rural counties | +15% heating costs |
| Healthcare | Cold-related treatment | $95 million additional | Urban, elderly populations | +35% emergency visits |
The economic impact of New York’s coldest month 2025 reached unprecedented levels, with total costs exceeding $3.5 billion across multiple economic sectors throughout the state. Residential heating costs represented the largest single expense, with $1.2 billion in additional costs as New York households faced 45% higher winter energy bills compared to typical years. Upstate and North Country regions bore the heaviest burden, where residents in areas like the Adirondacks and St. Lawrence Valley faced energy bills that often doubled due to sustained sub-zero temperatures and increased heating demands. Commercial energy expenses added $680 million to business operational costs as companies throughout the state struggled to maintain comfortable working conditions while managing 38% increases in heating expenses.
Transportation sector impacts totaled $420 million in losses due to weather-related delays, equipment failures, and increased maintenance costs across roads, railways, and airports throughout New York State. However, the tourism industry experienced unexpected benefits, generating $310 million in additional revenue as mountain regions saw 22% increases in winter recreation activities, with ski resorts and winter sports facilities capitalizing on excellent snow conditions and sustained cold temperatures that enhanced winter recreation opportunities. Healthcare costs increased by $95 million as cold-related emergency visits rose by 35%, particularly affecting urban areas and elderly populations who faced increased risks from extreme cold exposure, while agricultural sectors spent $180 million on crop protection and livestock heating systems to prevent cold damage to farming operations throughout rural New York counties.
Future Outlook
The future outlook for New York’s coldest month patterns suggests that while January 2025’s record-breaking cold represented an extreme weather event, climate change projections indicate that such intense cold periods may become less frequent but potentially more dangerous when they do occur. Advanced climate modeling suggests that New York State will continue experiencing January as its coldest month, but with increasing temperature variability that could produce more extreme swings between warm and cold periods during winter months. The polar vortex disruptions that created 2025’s exceptional cold may become more common as arctic warming destabilizes traditional weather patterns, potentially making future cold outbreaks more intense but shorter in duration than the sustained cold of previous decades.
The infrastructure and economic implications of changing winter patterns will require significant adaptation strategies across New York’s diverse regions. Energy systems must be designed to handle both extreme cold events like January 2025 and the increasing demand for cooling during warmer winter periods, while transportation infrastructure needs enhanced winterization to cope with more variable freeze-thaw cycles. Urban planning in cities like New York City and Albany must account for both urban heat island effects that moderate cold and the potential for extreme cold snaps that can overwhelm heating systems. The 2025 coldest month data serves as a crucial benchmark for understanding how New York State must prepare for a future where January remains the coldest month, but with greater temperature extremes and more variable winter weather patterns that demand flexible, resilient systems capable of handling both unprecedented cold and rapidly changing conditions.
Disclaimer: The data research report we present here is based on information found from various sources. We are not liable for any financial loss, errors, or damages of any kind that may result from the use of the information herein. We acknowledge that though we try to report accurately, we cannot verify the absolute facts of everything that has been represented.