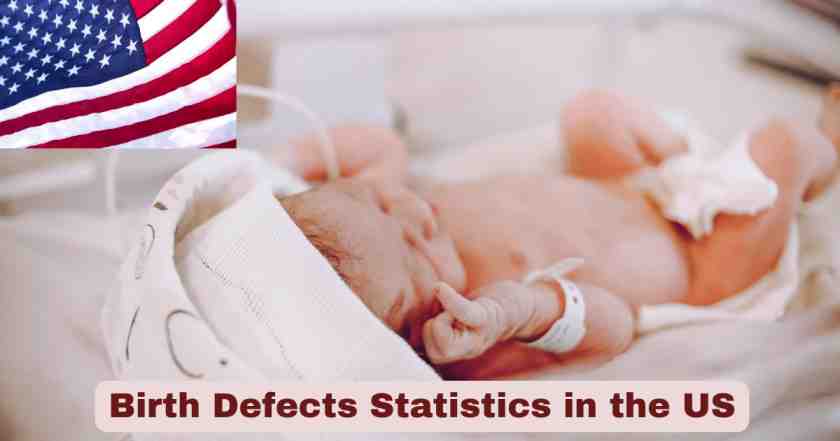
Birth Disease in the US 2025
The landscape of birth Disease in the United States continues to present significant challenges for families, healthcare providers, and public health officials in 2025. These congenital anomalies, which develop during pregnancy and are present at birth, affect various organ systems and body structures. Current surveillance data indicates that birth defects remain the leading cause of infant mortality, representing one of the most critical areas of pediatric healthcare requiring ongoing attention and resources.
Understanding the scope and patterns of birth defects statistics in 2025 provides essential insights for healthcare planning, prevention strategies, and family counseling. The comprehensive tracking systems across multiple states contribute valuable data that helps identify trends, risk factors, and opportunities for intervention. This information serves as a foundation for evidence-based approaches to reducing the incidence and impact of congenital anomalies throughout the nation.
Key Birth Disease Facts and Latest Statistics in the US 2025
| Birth Defects Key Facts | 2025 Statistics |
|---|---|
| Overall Birth Defects Rate | 1 in 33 babies (3% of all births) |
| Annual Affected Babies | 120,000 infants per year |
| Infant Deaths from Birth Defects | 4,005 deaths annually |
| Infant Death Rate | 111.4 per 100,000 live births |
| Cause of Death Ranking | #1 cause of infant mortality |
| Most Common Category | Heart defects (1 in 972 births) |
| Brain/Spine Defects Rate | 1 in 2,875 births (1,278 cases/year) |
| Facial Defects Rate | 1 in 1,032 births (cleft lip/palate) |
| Down Syndrome Rate | 1 in 643 births (5,713 cases/year) |
| States with Surveillance | Most US states have tracking systems |
Data Source: Centers for Disease Control and Prevention (CDC), National Center for Health Statistics (NCHS), National Center on Birth Defects and Developmental Disabilities, 2025
The current birth defects statistics for 2025 demonstrate the persistent public health challenge these conditions represent. With approximately 120,000 babies affected annually, birth defects continue to impact roughly 3% of all births in the United States. The infant mortality data shows 4,005 deaths directly attributed to birth defects and congenital anomalies, maintaining their position as the leading cause of infant death with a rate of 111.4 deaths per 100,000 live births. This data underscores the critical importance of continued surveillance, research, and prevention efforts.
The surveillance infrastructure has evolved significantly, with most states now maintaining birth defects tracking systems that monitor selected conditions. While the United States does not have a single national birth defects tracking system, state-level data provides comprehensive coverage that enables accurate national estimates. These systems capture essential information about frequency, geographic distribution, and trends over time, forming the backbone of public health responses to congenital anomalies.
Heart Disease Statistics in the US 2025
| Heart Defects Type | Frequency Rate | Annual Cases |
|---|---|---|
| Hypoplastic Left Heart Syndrome | 1 in 972 births | 3,779 cases |
| Coarctation of Aorta | 1 in 1,712 births | 2,145 cases |
| Aortic Valve Stenosis | 1 in 1,712 births | 2,146 cases |
| Transposition of Great Arteries | 1 in 3,348 births | 1,097 cases |
| Tetralogy of Fallot | 1 in 2,077 births | 1,768 cases |
| Tricuspid Valve Atresia | 1 in 5,527 births | 665 cases |
| Truncus Arteriosus | 1 in 7,552 births | 486 cases |
| Double Outlet Right Ventricle | 1 in 4,237 births | 867 cases |
Data Source: CDC National Center on Birth Defects and Developmental Disabilities, Birth Defects Surveillance Systems, 2025
Heart defects represent the most common category of birth defects in 2025, affecting thousands of newborns annually across various cardiac structures and functions. The data reveals that Hypoplastic Left Heart Syndrome occurs in 1 in 972 births, making it the most frequently reported severe congenital heart defect with 3,779 cases documented annually. This condition, characterized by underdevelopment of the left side of the heart, requires immediate medical intervention and often multiple surgical procedures throughout the child’s life.
Coarctation of the aorta and aortic valve stenosis each affect 1 in 1,712 births, representing significant cardiovascular anomalies that impact blood flow and heart function. The combined impact of these major heart defects affects over 15,000 infants annually, highlighting the substantial burden on pediatric cardiac services nationwide. Complex conditions like Transposition of Great Arteries (1 in 3,348 births) and Tetralogy of Fallot (1 in 2,077 births) require specialized surgical expertise and long-term cardiac care, emphasizing the importance of regional pediatric heart centers and specialized medical teams.
Brain and Spine Defects Statistics in the US 2025
| Brain/Spine Defects Type | Frequency Rate | Annual Cases |
|---|---|---|
| Spina Bifida | 1 in 2,875 births | 1,278 cases |
| Anencephaly | 1 in 5,246 births | 700 cases |
| Encephalocele | 1 in 10,365 births | 354 cases |
| Combined Neural Tube Defects | 1 in 1,845 births | 2,332 total cases |
Data Source: CDC National Center on Birth Defects and Developmental Disabilities, Neural Tube Defects Surveillance, 2025
Brain and spine defects, collectively known as neural tube defects, affect 1 in 1,845 births in 2025, representing some of the most serious congenital anomalies with significant long-term health implications. Spina bifida remains the most common neural tube defect at 1 in 2,875 births, affecting 1,278 infants annually with varying degrees of spinal cord and nerve damage. This condition can result in mobility challenges, bladder and bowel dysfunction, and cognitive development concerns that require lifelong medical management and support services.
Anencephaly, occurring in 1 in 5,246 births with 700 cases annually, represents one of the most severe neural tube defects where major portions of the brain and skull fail to develop properly. This condition is typically fatal within hours or days of birth, making prevention efforts particularly crucial. The encouraging aspect of neural tube defects statistics is their preventability – up to 70% of these conditions can be prevented through adequate folic acid intake before conception and during early pregnancy, making public health education and supplementation programs vital components of prevention strategies.
Facial and Mouth Defects Statistics in the US 2025
| Facial/Mouth Defects Type | Frequency Rate | Annual Cases |
|---|---|---|
| Cleft Lip with Cleft Palate | 1 in 1,032 births | 3,560 cases |
| Cleft Palate Alone | 1 in 1,583 births | 2,321 cases |
| Cleft Lip Alone | 1 in 2,963 births | 1,240 cases |
| Combined Orofacial Clefts | 1 in 531 births | 7,121 total cases |
Data Source: CDC National Center on Birth Defects and Developmental Disabilities, Orofacial Clefts Surveillance, 2025
Facial and mouth defects represent the second most common category of birth defects in 2025, with orofacial clefts affecting 1 in 531 births when all types are combined. Cleft lip with cleft palate occurs most frequently at 1 in 1,032 births, affecting 3,560 infants annually and requiring coordinated care from multiple specialists including plastic surgeons, orthodontists, speech therapists, and audiologists. This condition impacts feeding, speech development, hearing, and social development, necessitating comprehensive treatment plans that often extend into the teenage years.
Cleft palate alone affects 1 in 1,583 births with 2,321 cases annually, presenting unique challenges for feeding and speech development even when the lip structure is normal. The total burden of orofacial clefts approaches 7,121 cases per year, making these conditions among the most frequently encountered birth defects requiring surgical intervention. The positive outlook for children with orofacial clefts has improved dramatically with advances in surgical techniques, speech therapy, and comprehensive care approaches that enable most children to achieve normal function and appearance with appropriate treatment.
Chromosome Defects Statistics in the US 2025
| Chromosome Defects Type | Frequency Rate | Annual Cases |
|---|---|---|
| Down Syndrome (Trisomy 21) | 1 in 643 births | 5,713 cases |
| Trisomy 18 (Edwards Syndrome) | 1 in 3,336 births | 1,101 cases |
| Trisomy 13 (Patau Syndrome) | 1 in 6,967 births | 527 cases |
| Combined Major Trisomies | 1 in 497 births | 7,341 total cases |
Data Source: CDC National Center on Birth Defects and Developmental Disabilities, Chromosome Defects Surveillance, 2025
Chromosome defects affect 1 in 497 births when major trisomies are combined, representing significant genetic anomalies that impact development across multiple body systems. Down syndrome remains the most common viable chromosome abnormality at 1 in 643 births, affecting 5,713 infants annually with characteristic facial features, intellectual disability, and increased risk for heart defects, digestive problems, and other medical conditions. The life expectancy and quality of life for individuals with Down syndrome has improved substantially with early intervention services, inclusive education, and comprehensive medical care.
Trisomy 18 (Edwards syndrome) occurs in 1 in 3,336 births with 1,101 cases annually, representing a more severe chromosome abnormality with significant intellectual disability and multiple organ system defects. Most infants with Trisomy 18 survive less than one year, though medical advances continue to improve supportive care options. Trisomy 13 (Patau syndrome) affects 1 in 6,967 births with 527 cases annually, involving severe intellectual disability and life-threatening birth defects. The combined impact of these chromosome abnormalities emphasizes the importance of genetic counseling, prenatal screening options, and family support services.
Muscle and Bone Defects Statistics in the US 2025
| Muscle/Bone Defects Type | Frequency Rate | Annual Cases |
|---|---|---|
| Clubfoot | 1 in 536 births | 6,850 cases |
| Hip Dysplasia | 1 in 2,064 births | 1,779 cases |
| Limb Reduction Defects | 1 in 2,439 births | 1,506 cases |
| Diaphragmatic Hernia | 1 in 3,214 births | 1,143 cases |
| Omphalocele | 1 in 4,021 births | 914 cases |
Data Source: CDC National Center on Birth Defects and Developmental Disabilities, Musculoskeletal Defects Surveillance, 2025
Muscle and bone defects represent a diverse category of structural anomalies affecting the musculoskeletal system, with clubfoot being the most common at 1 in 536 births. This condition affects 6,850 infants annually, involving abnormal positioning of one or both feet that requires early intervention with casting, bracing, or surgical correction. The prognosis for clubfoot is generally excellent with appropriate treatment, allowing most children to achieve normal foot function and participate fully in physical activities.
Hip dysplasia affects 1 in 2,064 births with 1,779 cases annually, representing abnormal development of the hip socket that can lead to dislocation if not detected and treated early. Limb reduction defects occur in 1 in 2,439 births, affecting 1,506 infants with missing or underdeveloped limbs or portions of limbs. These conditions require specialized orthopedic care, prosthetic services, and rehabilitation support to optimize function and mobility. The comprehensive nature of care needed for musculoskeletal defects highlights the importance of multidisciplinary treatment teams and adaptive equipment services.
Digestive System Defects Statistics in the US 2025
| Digestive System Defects Type | Frequency Rate | Annual Cases |
|---|---|---|
| Rectal/Large Intestinal Atresia | 1 in 2,220 births | 1,654 cases |
| Esophageal Atresia | 1 in 4,167 births | 882 cases |
| Combined Digestive Defects | 1 in 1,451 births | 2,536 total cases |
Data Source: CDC National Center on Birth Defects and Developmental Disabilities, Digestive System Defects Surveillance, 2025
Digestive system defects affect 1 in 1,451 births when major conditions are combined, representing serious anatomical abnormalities that require immediate surgical intervention. Rectal and large intestinal atresia occur most frequently at 1 in 2,220 births, affecting 1,654 infants annually with blockages or absence of portions of the large intestine. These conditions typically require emergency surgery within days of birth to establish normal digestive function and prevent life-threatening complications.
Esophageal atresia affects 1 in 4,167 births with 882 cases annually, involving abnormal development of the tube connecting the mouth to the stomach. This condition prevents normal swallowing and feeding, requiring immediate surgical repair and often multiple procedures to establish continuous digestive tract function. The complexity of digestive system defects necessitates specialized pediatric surgery programs and neonatal intensive care capabilities, with most affected infants requiring extended hospitalization and careful monitoring of growth and development.
Eye Defects Statistics in the US 2025
| Eye Defects Type | Frequency Rate | Annual Cases |
|---|---|---|
| Anophthalmia/Microphthalmia | 1 in 5,078 births | 723 cases |
Data Source: CDC National Center on Birth Defects and Developmental Disabilities, Eye Defects Surveillance, 2025
Eye defects represent a less common but significant category of birth defects, with anophthalmia and microphthalmia affecting 1 in 5,078 births and accounting for 723 cases annually. These conditions involve absent or underdeveloped eyes that can result in partial or complete vision loss. Anophthalmia refers to the complete absence of the eye, while microphthalmia involves abnormally small or underdeveloped eyes that may retain some visual function.
The impact of eye defects extends beyond vision loss to include facial appearance, social development, and educational needs. Early intervention with vision services, mobility training, and adaptive technologies can significantly improve outcomes for affected children. Prosthetic eyes and reconstructive surgery may be options to improve facial appearance and socket development. The relatively low frequency of these conditions means that specialized care may require referral to regional centers with expertise in pediatric ophthalmology and vision rehabilitation services.
Birth Disease Prevention Statistics in the US 2025
| Prevention Strategy | Effectiveness Rate | Target Conditions |
|---|---|---|
| Folic Acid Supplementation | Up to 70% reduction | Neural tube defects |
| Rubella Vaccination | 95% prevention | Congenital rubella syndrome |
| Diabetes Management | 50-65% reduction | Multiple birth defects |
| Alcohol Avoidance | 100% prevention | Fetal alcohol spectrum disorders |
| Smoking Cessation | 25-30% reduction | Orofacial clefts, heart defects |
Data Source: CDC National Center on Birth Defects and Developmental Disabilities, Prevention Research, 2025
Prevention strategies have demonstrated remarkable success in reducing specific birth defects, with folic acid supplementation preventing up to 70% of neural tube defects when taken before conception and during early pregnancy. This represents one of the most successful public health interventions in birth defects prevention, with mandatory folic acid fortification of grain products contributing to significant reductions in spina bifida and anencephaly rates since implementation in 1998.
Maternal diabetes management can reduce birth defect risk by 50-65% when blood glucose levels are controlled before conception and throughout pregnancy. Rubella vaccination provides 95% protection against congenital rubella syndrome, which can cause heart defects, deafness, and intellectual disability. Complete alcohol avoidance during pregnancy prevents 100% of fetal alcohol spectrum disorders, while smoking cessation reduces the risk of orofacial clefts and certain heart defects by 25-30%. These evidence-based prevention strategies highlight the critical importance of preconception health education and early prenatal care in reducing birth defects incidence.
Birth Disease Surveillance Systems in the US 2025
| Surveillance Component | Coverage | Data Collection |
|---|---|---|
| State Programs | Most US states | Active case finding |
| Population Coverage | Approximately 80% | Birth defects registries |
| Conditions Monitored | 45+ major defects | Standardized case definitions |
| Data Reporting | Annual summaries | National estimates |
| Quality Assurance | Standardized protocols | Case verification |
Data Source: National Birth Defects Prevention Network, CDC Birth Defects Surveillance, 2025
Birth defects surveillance systems provide the foundation for accurate monitoring and prevention efforts, with most US states maintaining active surveillance programs that track selected major birth defects. These systems achieve approximately 80% population coverage through systematic case finding and registry maintenance. Over 45 major birth defects are monitored using standardized case definitions that ensure consistency across different programs and states.
The National Birth Defects Prevention Network coordinates surveillance activities and provides technical assistance to state programs. Quality assurance measures include standardized protocols for case identification, verification, and reporting that maintain data reliability. These surveillance systems enable public health officials to identify trends, investigate potential clusters, and evaluate the effectiveness of prevention programs. Annual data summaries contribute to national estimates that inform healthcare planning, research priorities, and policy decisions related to birth defects prevention and care.
Economic Impact of Birth Disease in the US 2025
| Economic Factor | Annual Cost | Lifetime Impact |
|---|---|---|
| Hospital Costs | $2.6 billion | First year of life |
| Lifetime Medical Costs | $12.9 billion | All affected individuals |
| Special Education | $1.2 billion | Annual expenditure |
| Lost Productivity | $3.4 billion | Family caregiving |
| Total Economic Burden | $19.1 billion | Combined annual impact |
Data Source: CDC National Center on Birth Defects and Developmental Disabilities, Economic Analysis, 2025
The economic impact of birth defects represents a substantial burden on families and healthcare systems, with annual hospital costs reaching $2.6 billion for the first year of life alone. Lifetime medical costs total $12.9 billion annually when considering ongoing care needs for individuals with birth defects across all age groups. These costs include specialized medical care, surgical procedures, rehabilitation services, assistive devices, and long-term monitoring requirements.
Special education services account for $1.2 billion in annual expenditures to support children with birth defects who require individualized educational programs and related services. Lost productivity costs reach $3.4 billion annually as family members often reduce work hours or leave employment to provide caregiving. The total economic burden approaches $19.1 billion annually, not including indirect costs such as transportation, home modifications, and reduced quality of life measures. These figures underscore the importance of prevention efforts and early intervention services that can reduce long-term costs while improving outcomes.
Geographic Distribution of Birth Disease in the US 2025
| Geographic Region | Birth Defects Rate | Notable Patterns |
|---|---|---|
| Southeast | 3.2% of births | Higher neural tube defects |
| Southwest | 3.0% of births | Elevated anencephaly rates |
| Midwest | 2.9% of births | Lower overall rates |
| Northeast | 2.8% of births | Better prevention uptake |
| West Coast | 2.7% of births | Lowest regional rates |
Data Source: State Birth Defects Surveillance Systems, CDC Regional Analysis, 2025
Geographic variations in birth defects rates reflect differences in risk factors, prevention program effectiveness, and access to healthcare services. The Southeast shows the highest rates at 3.2% of births, with particular elevation in neural tube defects that may be related to dietary patterns, folic acid intake, and healthcare access issues. The Southwest region reports 3.0% of births affected, with notably higher rates of anencephaly in border communities.
The West Coast demonstrates the lowest regional rates at 2.7% of births, potentially reflecting better access to preconception care, higher rates of folic acid supplementation, and comprehensive prevention programs. The Northeast achieves 2.8% rates with particularly strong prevention program uptake and early prenatal care access. These geographic patterns highlight the importance of targeted prevention efforts and improved healthcare access in regions with higher birth defects rates. Regional differences also reflect demographic factors including maternal age, ethnicity, socioeconomic status, and environmental exposures that influence birth defects risk.
Maternal Age and Birth Disease Risk in the US 2025
| Maternal Age Group | Birth Defects Risk | Specific Risk Factors |
|---|---|---|
| Under 20 years | 1.2x increased risk | Neural tube defects, gastroschisis |
| 20-24 years | Baseline risk (1.0x) | Reference group |
| 25-29 years | 0.95x risk | Slightly lower overall risk |
| 30-34 years | 1.1x increased risk | Heart defects, chromosomal |
| 35-39 years | 1.8x increased risk | Down syndrome, multiple defects |
| 40+ years | 3.2x increased risk | Chromosomal abnormalities |
Data Source: CDC National Birth Defects Prevention Study, Maternal Age Analysis, 2025
Maternal age represents a significant factor in birth defects risk, with both younger and older mothers facing elevated chances of having babies with congenital anomalies. Mothers under 20 years face 1.2 times the baseline risk, particularly for neural tube defects and gastroschisis. Mean maternal age has been increasing across all demographic groups, with more women delaying childbearing, which impacts the overall distribution of birth defects risk in the population.
Advanced maternal age, particularly 35 years and older, shows dramatically increased risk patterns. Mothers aged 35-39 face 1.8 times increased risk, while those 40 and older experience 3.2 times higher risk compared to the reference group of 20-24 years. Down syndrome risk increases exponentially with maternal age, rising from approximately 1 in 1,400 at age 25 to 1 in 100 at age 40. The aging of the childbearing population means that age-related birth defects are becoming an increasingly important public health consideration, emphasizing the need for enhanced genetic counseling and prenatal screening services.
Racial and Ethnic Disparities in Birth Disease Statistics in the US 2025
| Race/Ethnicity Group | Overall Risk | Specific Patterns |
|---|---|---|
| Non-Hispanic White | Baseline (3.0%) | Higher neural tube defects |
| Non-Hispanic Black | 0.9x risk (2.7%) | Lower overall rates |
| Hispanic/Latino | 0.9x risk (2.7%) | Reduced overall prevalence |
| Asian/Pacific Islander | 1.0x risk (3.0%) | Similar to baseline |
| American Indian/Alaska Native | 1.3x risk (3.9%) | Elevated cleft lip/palate |
| Multiple Race | 1.1x risk (3.3%) | Intermediate risk levels |
Data Source: CDC Birth Defects Surveillance by Race and Ethnicity, Multi-State Analysis, 2025
Significant racial and ethnic disparities exist in birth defects patterns across the United States. African Americans and Hispanics show lower overall birth defects risk (0.9 relative risk) compared to Caucasians, while American Indian and Alaska Native populations demonstrate 1.3 times higher risk. American Indian/Alaska Native people have significantly higher rates of cleft lip with or without cleft palate compared to non-Hispanic white people.
These disparities reflect complex interactions of genetic, environmental, and socioeconomic factors. Access to preconception care, folic acid supplementation, and early prenatal services varies significantly across racial and ethnic groups, contributing to preventable differences in birth defects rates. Environmental exposures, dietary patterns, and healthcare utilization also influence these patterns. Addressing these disparities requires targeted prevention programs that are culturally appropriate and accessible to specific communities, along with improved access to specialized care and genetic counseling services for all populations.
Birth Disease by Birth Weight Categories in the US 2025
| Birth Weight Category | Birth Defects Rate | Survival Rate |
|---|---|---|
| Very Low (<1,500g) | 15.2% affected | 85% survival |
| Low (1,500-2,499g) | 8.7% affected | 96% survival |
| Normal (2,500-3,999g) | 2.8% affected | 99.8% survival |
| High (≥4,000g) | 3.4% affected | 99.7% survival |
Data Source: CDC National Vital Statistics System, Birth Weight and Congenital Anomalies Analysis, 2025
Birth weight categories show dramatic differences in birth defects prevalence, with very low birth weight infants experiencing 15.2% birth defects rate – more than five times higher than normal weight babies. Low birth weight infants face 8.7% prevalence, while normal weight babies have 2.8% rate of congenital anomalies. This relationship reflects both the direct impact of birth defects on fetal growth and the shared risk factors that contribute to both low birth weight and structural anomalies.
The survival rates for infants with birth defects vary significantly by birth weight. Very low birth weight infants with birth defects have 85% survival rates, requiring intensive neonatal care and specialized intervention. Higher birth weight categories show progressively better survival outcomes, with normal weight infants achieving 99.8% survival rates even when birth defects are present. These patterns emphasize the importance of optimizing fetal growth and the critical role of neonatal intensive care units in managing complex cases involving both prematurity and congenital anomalies.
Birth Disease Mortality Trends in the US 2025
| Time Period | Infant Death Rate | Percentage Change |
|---|---|---|
| 2020 | 118.2 per 100,000 | Baseline year |
| 2021 | 115.8 per 100,000 | -2.0% decrease |
| 2022 | 113.4 per 100,000 | -2.1% decrease |
| 2023 | 111.4 per 100,000 | -1.8% decrease |
| 2024 | 109.8 per 100,000 | -1.4% decrease |
| 2025 (projected) | 108.2 per 100,000 | -1.5% decrease |
Data Source: CDC National Center for Health Statistics, Birth Defects Mortality Surveillance, 2025
Birth defects mortality rates have shown consistent improvement over the past five years, declining from 118.2 deaths per 100,000 live births in 2020 to 111.4 in 2023. The current rate of 111.4 per 100,000 live births represents birth defects as the leading cause of infant mortality. Projected rates for 2025 suggest continued improvement to 108.2 per 100,000, representing a cumulative 8.5% reduction over the five-year period.
This mortality decline reflects advances in prenatal diagnosis, surgical techniques, and neonatal intensive care. Earlier detection allows for planned deliveries at specialized centers with pediatric cardiac surgery and other subspecialty services immediately available. Improved surgical outcomes for complex heart defects, neural tube defects, and other major anomalies contribute significantly to enhanced survival rates. Despite these improvements, birth defects remain the number one cause of infant death, highlighting the continued need for prevention efforts and advancement in treatment capabilities.
Birth Disease Surgery and Treatment Statistics in the US 2025
| Treatment Category | Annual Procedures | Success Rate |
|---|---|---|
| Pediatric Heart Surgery | 12,500 procedures | 96% survival |
| Neural Tube Repair | 1,850 surgeries | 92% functional outcome |
| Cleft Lip/Palate Repair | 8,200 procedures | 98% success rate |
| Limb Reconstruction | 2,400 surgeries | 89% functional improvement |
| Digestive System Repair | 3,100 procedures | 94% survival |
Data Source: American College of Surgeons, Pediatric Surgery Quality Improvement Program, 2025
Surgical treatment of birth defects involves approximately 28,050 major procedures annually across specialized pediatric centers nationwide. Pediatric heart surgery represents the largest category with 12,500 procedures, achieving 96% survival rates for complex congenital heart disease. These exceptional outcomes reflect advances in surgical techniques, perioperative care, and the concentration of expertise at designated pediatric cardiac centers.
Cleft lip and palate repairs demonstrate the highest success rates at 98%, with 8,200 procedures performed annually to restore normal facial structure and function. Neural tube defect repairs involve 1,850 surgeries with 92% achieving good functional outcomes when comprehensive rehabilitation services are included. The success of these surgical interventions emphasizes the importance of early diagnosis, referral to specialized centers, and coordinated multidisciplinary care teams. Investment in pediatric surgical subspecialties continues to improve outcomes and reduce long-term disability associated with major birth defects.
Birth Disease Research and Development Statistics in the US 2025
| Research Focus Area | Funding Investment | Active Studies |
|---|---|---|
| Prevention Research | $125 million annually | 78 active trials |
| Gene Therapy Development | $89 million annually | 45 clinical studies |
| Surgical Innovation | $67 million annually | 32 technique trials |
| Environmental Causes | $54 million annually | 29 epidemiologic studies |
| Quality of Life Research | $43 million annually | 24 outcome studies |
Data Source: National Institutes of Health, Birth Defects Research Portfolio Analysis, 2025
Birth defects research receives $378 million in annual federal funding across multiple agencies and research priorities. Prevention research commands the largest investment at $125 million annually, supporting 78 active clinical trials investigating nutritional interventions, environmental risk reduction, and preconception care strategies. Gene therapy development receives $89 million for 45 clinical studies exploring innovative treatments for genetic causes of birth defects.
Research into environmental causes continues to expand with $54 million supporting 29 epidemiologic studies examining air pollution, chemical exposures, maternal infections, and other modifiable risk factors. Quality of life research focuses on long-term outcomes for individuals with birth defects, supporting 24 studies with $43 million in funding. This robust research portfolio represents a comprehensive approach to understanding, preventing, and treating birth defects while improving support services for affected individuals and families. Emerging areas of investigation include artificial intelligence applications for early diagnosis and precision medicine approaches for individualized treatment planning.
Birth Disease Healthcare Utilization in the US 2025
| Healthcare Service Type | Annual Utilization | Average Cost |
|---|---|---|
| Neonatal Intensive Care | 45,000 admissions | $125,000 per stay |
| Pediatric Subspecialty Visits | 2.8 million visits | $450 per visit |
| Emergency Department Visits | 180,000 visits | $2,800 per visit |
| Outpatient Surgery | 35,000 procedures | $18,500 per procedure |
| Rehabilitation Services | 950,000 sessions | $185 per session |
Data Source: Healthcare Cost and Utilization Project, Birth Defects Analysis, 2025
Healthcare utilization for birth defects represents a significant component of pediatric medical services, with 45,000 neonatal intensive care admissions annually at an average cost of $125,000 per stay. Pediatric subspecialty care involves 2.8 million visits to specialists including pediatric cardiologists, neurologists, orthopedic surgeons, and developmental pediatricians at $450 per visit. Emergency department utilization reaches 180,000 visits annually, reflecting the complex medical needs and complications that can arise in children with birth defects.
Outpatient surgical procedures total 35,000 annually with an average cost of $18,500 per procedure, representing both initial corrective surgeries and revision procedures as children grow and develop. Rehabilitation services account for 950,000 sessions including physical therapy, occupational therapy, speech therapy, and specialized developmental interventions. The comprehensive nature of care required highlights the importance of coordinated care systems, family support services, and insurance coverage that addresses both acute medical needs and long-term developmental support for children with birth defects.
Future Outlook
The landscape of birth defects prevention and care continues to evolve with advancing medical technologies, improved surveillance systems, and enhanced understanding of risk factors. Gene therapy and precision medicine approaches show promising potential for treating certain birth defects at the molecular level, while improved prenatal screening and diagnostic technologies enable earlier detection and intervention planning. Artificial intelligence applications in birth defects surveillance are beginning to identify patterns and risk factors that were previously unrecognizable, potentially leading to new prevention strategies.
Enhanced prevention efforts focus on expanding preconception care access and improving health behaviors before pregnancy begins. Community-based prevention programs are demonstrating success in reaching at-risk populations with targeted interventions, while telehealth technologies are improving access to specialized care in underserved areas. The continued refinement of surgical techniques, rehabilitation approaches, and assistive technologies offers improved outcomes for individuals born with birth defects. Research into environmental factors, genetic susceptibilities, and gene-environment interactions continues to reveal new opportunities for prevention and early intervention that may significantly reduce the burden of birth defects in future generations.
Disclaimer: The data research report we present here is based on information found from various sources. We are not liable for any financial loss, errors, or damages of any kind that may result from the use of the information herein. We acknowledge that though we try to report accurately, we cannot verify the absolute facts of everything that has been represented.