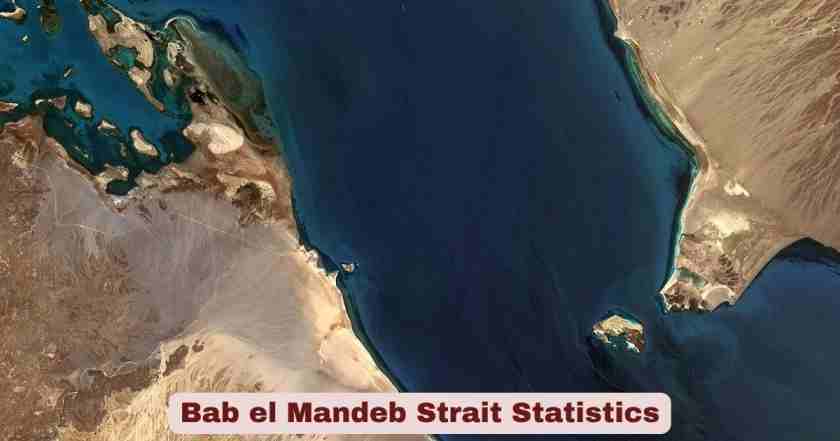
Where is Bab el-Mandeb Strait?
The Bab el-Mandeb Strait — whose Arabic name translates literally as the “Gate of Tears”, a name said to reflect either the dangerous currents that have claimed ships and sailors for millennia or the grief of separation it represents at the edge of continents — is a narrow waterway at the southern tip of the Red Sea, connecting it with the Gulf of Aden and the broader Indian Ocean beyond. It is approximately 100 kilometres (62 miles) long and 30 kilometres (18 miles) wide at its broadest point, separating Yemen on the Arabian Peninsula to the northeast from Djibouti and Eritrea on the Horn of Africa to the southwest. At its narrowest functional point, the strait contains two navigation channels divided by Perim Island (a Yemeni possession): the western channel at 16 miles wide and 650 feet deep, used for all international commercial shipping, and the shallower eastern channel at 2 miles wide, used only by local vessels. The strait’s modern global importance derives entirely from its position as the southern gateway of the Suez Canal route — the corridor that, since the canal opened in 1869, has allowed ships to travel between the Mediterranean Sea and the Indian Ocean without circumnavigating the entire African continent. In the 21st century, the Bab el-Mandeb Strait accounts for about one-tenth of seaborne oil trade, making it the third busiest chokepoint in global oil trade after the Strait of Malacca and the Strait of Hormuz, and about one-fourth of global container trade also passes through the strait. When the Bab el-Mandeb is closed or severely disrupted, the only alternative is the Cape of Good Hope route around southern Africa — adding 10–14 days and approximately $1 million in fuel costs per round-trip Asia-Europe voyage, and imposing billions in cumulative excess costs on global trade annually.
The Bab el-Mandeb in March 2026 exists at the intersection of three simultaneous crises that have, together, made it the most strategically threatened shipping chokepoint in the world at this specific moment. The first crisis — the Houthi attack campaign on commercial shipping that began in late 2023 following the outbreak of the Israel-Hamas War — caused transits to fall below half their normal capacity and drove the Cape of Good Hope diversion that is still costing the global economy billions. That campaign began to ease in 2025 following a U.S.-Houthi ceasefire in May, and by November 2025, Lloyd’s List Intelligence was recording a modest recovery to 1,128 transits — the highest since January 2024. But traffic had not significantly recovered before fear of attacks were renewed by the 2026 Iran war. The second crisis — Operation Epic Fury that began February 28, 2026 — brought the Strait of Hormuz blockade and a new Iranian threat dimension that directly references Bab el-Mandeb. Iranian news agency Tasnim quoted an unnamed military official stating Iran would target Red Sea shipping if the U.S. attempts a ground operation, adding: “The Bab el-Mandeb Strait is among the most strategic straits in the world, and Iran has both the will and the capability to pose a fully credible threat against it.” The third crisis — the IRGC’s suggestion that it may ask its Houthi allies to block Bab el-Mandeb — means that as of March 30, 2026, the Gate of Tears stands at a fulcrum between continued partial disruption and a scenario of dual chokepoint closure that would threaten approximately 30% of global container shipping and 22% of global oil supply simultaneously.
Bab el-Mandeb Strait Key Facts in 2026
| Fact Category | Key Fact / Data Point |
|---|---|
| Arabic Name Meaning | “Gate of Tears” — reflects dangerous currents and historical maritime tragedies |
| Location | Southern tip of the Red Sea — connecting Red Sea to Gulf of Aden and Indian Ocean |
| Countries Bordering | Yemen (northeast — Arabian Peninsula); Djibouti and Eritrea (southwest — Horn of Africa) |
| Total Length | Approximately 100 kilometres (62 miles) |
| Width (Maximum) | Approximately 30 kilometres (18 miles) at broadest point |
| Width at Narrowest Navigable Point (EIA) | 18 miles — limiting tanker traffic to two 2-mile-wide channels for inbound/outbound |
| Perim Island | Divides the strait into two channels — Yemeni territory |
| Western Channel | 16 miles wide, 650 feet deep — used for all international commercial shipping |
| Eastern Channel | 2 miles wide, shallower — used only for local traffic |
| Global Ranking — Oil Chokepoints | 3rd busiest — after Strait of Malacca and Strait of Hormuz |
| Share of Seaborne Oil Trade (Normal) | Approximately 10–12% of global seaborne oil trade |
| Share of Global Container Trade | ~25% — approximately one-quarter of global container trade |
| Annual Vessel Transits (Normal, Pre-Houthi) | ~20,000–26,000 vessels per year |
| Annual Cargo Volume (Normal, 2020–2023 avg) | ~1.6 billion tons annually — per IMF data |
| Oil Transit Volume (H1 2023 — Pre-Crisis) | ~12% of world oil shipments — EIA |
| Oil Transit Volume (H1 2025) | 4.2 million bpd — less than half of 2023 pre-crisis levels |
| Oil Transit Volume Decline (2023 → 2025) | Down >50% — Houthi attacks forced massive rerouting |
| Current Status (March 2026) | Partially operational — partial Houthi recovery frozen by IRGC Iran war threat |
| Cape of Good Hope Diversion (H1 2025) | 9.1 million bpd rerouted around Cape — +45% vs. pre-crisis |
| Suez Canal Transits (2023 — Normal) | ~26,000 ships per year |
| Suez Canal Transits (2025 — Post-Houthi) | ~12,700 — down 52% from 2023 |
| IRGC Threat (March 2026) | Iranian military official via Tasnim: Iran “has both the will and the capability” to threaten the strait |
| Dual Chokepoint Scenario (Hormuz + Bab el-Mandeb) | Would block ~30% of global container shipping and threaten ~22% of global oil supply |
Source: Britannica “Bab el-Mandeb Strait” (updated 7 hours ago, March 30, 2026); EIA “The Bab el-Mandeb Strait is a strategic route for oil and natural gas shipments” (eia.gov); Al-Monitor / AFP March 27, 2026 (al-monitor.com); Middle East Insider March 29, 2026 (themiddleeastinsider.com); Anadolu Agency 3 weeks ago (aa.com.tr); Lloyd’s List December 4, 2025; MacroMicro/IMF Bab el-Mandeb data (2 weeks ago)
After Houthi forces in Yemen launched attacks on commercial ships in late 2023 in response to the Israel-Hamas War, traffic through the strait fell below half its normal capacity. The collapse from the 26,000 annual passages of the pre-crisis era rippled through global supply chains immediately — every container ship that redirected around the Cape added 10–14 days to its voyage schedule, compressed port turnaround times globally, caused blank sailings and schedule disruptions, and drove freight rates for goods moving between Asia, Europe, and East Africa sharply higher. Annualized across the global container fleet, the Cape diversion represents an estimated $7–9 billion in excess shipping costs in 2025–2026, absorbed partly by carriers and partly passed on to consumers as embedded inflation in traded goods prices. The oil transit picture is equally stark: in the first half of 2025, oil shipments averaged 4.2 million barrels per day through the strait — compared to approximately 9 million bpd in the pre-crisis peak, confirming that the strait’s oil transit function had been cut by more than half even after the partial ceasefire.
The IRGC threat — published through the state-controlled Tasnim news agency and directly citing Bab el-Mandeb — transformed what had been a Houthi-specific threat into a potential state-actor-directed chokepoint blockade. Rico Luman, a transport economist at ING bank, noted that Iran’s threat to the Strait of Hormuz had already driven up tanker traffic three to four tankers more per day through Bab el-Mandeb — a “notable difference” reflecting vessels being redirected from Hormuz. If the IRGC actively directs Houthi forces to resume attacks at scale, or extends IRGC naval assets into the Red Sea approaches, the partial disruption currently characterizing the strait could rapidly become a comprehensive blockade — and the global shipping and energy market consequences would multiply dramatically from the already-elevated baseline that the 2023–2025 crisis established.
Bab el-Mandeb Oil and Energy Transit Statistics in 2026
| Oil / Energy Metric | Data / Statistic |
|---|---|
| Oil Transit Volume (H1 2023 — Normal Pre-Crisis) | ~8–9 million bpd — before Houthi attacks; ~12% of global oil shipments |
| Oil Transit Volume (H1 2025) | 4.2 million bpd — per EIA/IEA / Anadolu Agency (3 weeks ago) |
| Oil Transit Volume Decline (2023 → 2025) | Down more than 50% |
| Middle East Insider Estimate (March 2026) | ~4.8 million bpd — partial recovery from 2024 lows |
| Suez Canal Oil Transit (H1 2025 — Companion) | 4.9 million bpd — also down sharply from pre-crisis |
| Cape of Good Hope Oil Diversion (H1 2025) | 9.1 million bpd — up +45% from pre-crisis as rerouted traffic goes south |
| LNG Transit Peak (2016) | 1.4 billion cubic feet per day — Jordan + Egypt imports; has declined significantly since |
| Saudi Aramco East-West Pipeline Response (2024–2026) | Saudi Arabia pumped more crude via East-West pipeline to avoid Bab el-Mandeb disruptions |
| Saudi Yanbu Exports (March 2026) | Exports ~tripled to ~4 million bpd as Hormuz closed — Rystad Energy via Al-Monitor |
| UAE Fujairah Pipeline Bypass Capacity | 1.8 million bpd — bypass of both Hormuz and Bab el-Mandeb for UAE oil |
| Hormuz-Bab el-Mandeb Interconnection | Oil passing through Hormuz often continues north through Bab el-Mandeb to Suez — disrupting one amplifies pressure on the other |
| Dual Chokepoint Simultaneous Closure — Oil Risk | ~22% of global oil supply would face transit disruption |
| Iranian Official Threat (Tasnim) | Iran would target Red Sea shipping if US “attempts a ground operation or seeks to impose costs through naval manoeuvres” |
| LNG Through Bab el-Mandeb (2026) | Reduced from 2016 peak; Qatari LNG heading west normally transits Hormuz then Bab el-Mandeb — now disrupted on both legs |
| Saudi Arabia Red Sea Port (Yanbu) | Strategic importance surged as outside Hormuz — now primary Saudi oil export route |
Source: EIA “The Bab el-Mandeb Strait is a strategic route” (eia.gov); EIA “Amid regional conflict, the Strait of Hormuz remains critical” (June 2025, eia.gov); Anadolu Agency 3 weeks ago; Middle East Insider March 29, 2026; Al-Monitor March 27, 2026; Rystad Energy via Al-Monitor; Lloyd’s List December 4, 2025
The Saudi Yanbu export port’s tripling to ~4 million bpd — documented by Rystad Energy and reported by Al-Monitor — is one of the most consequential real-time energy market shifts in March 2026. With the Strait of Hormuz partially blocked by Iran’s naval operations, Saudi Arabia has activated its strategic bypass infrastructure: the Aramco East-West pipeline running from the Gulf oil fields to the Red Sea port of Yanbu, capable of up to 5 million bpd (7 million bpd with the 2019 temporary upgrade). Yanbu’s oil then loads onto tankers that transit northward through the Red Sea and through Bab el-Mandeb. This means the Hormuz disruption has paradoxically increased the volume of oil flowing through Bab el-Mandeb from the Saudi bypass, even as overall global oil supply remains constrained. The interaction between the two chokepoints is therefore not merely additive but multiplicative: a Hormuz closure that drives more traffic to the Saudi bypass route increases the strategic value — and the target value — of Bab el-Mandeb simultaneously, creating exactly the combined vulnerability that Iran is now explicitly threatening to exploit.
The absence of any pipeline alternative for container shipping is the fact that most distinguishes Bab el-Mandeb from the Strait of Hormuz in terms of closure consequences. When Hormuz is threatened, Saudi Arabia’s pipeline and the UAE’s Fujairah bypass provide ~2.6 million bpd of credible oil bypass capacity. When Bab el-Mandeb is threatened, container shipping and general cargo has no alternative whatsoever except the Cape of Good Hope detour. The $7–9 billion in annual excess shipping costs that the 2024–2025 Cape diversion imposed on the global economy is the actual price of that alternative — and it has been embedded in global goods prices for going on two and a half years.
Bab el-Mandeb Shipping Traffic Statistics in 2026
| Shipping Traffic Metric | Data / Statistic |
|---|---|
| Annual Vessel Transits (Normal — Pre-Houthi) | ~20,000–26,000 vessels per year |
| Annual Cargo Volume (Normal — 2020–2023 avg) | ~1.6 billion tons annually — per IMF data |
| Suez Canal Annual Transits (2023 — Normal) | ~26,000 ships |
| Suez Canal Annual Transits (2025) | ~12,700 ships — down 52% |
| Bab el-Mandeb Monthly Transits (Nov 2025) | 1,128 transits — highest since January 2024; +3% from Oct 2025 |
| Bab el-Mandeb Monthly Transits (Oct 2025) | 1,094 transits |
| Bab el-Mandeb Monthly Transits (Jan 2024 — Post-Exodus Peak) | 1,299 transits |
| Bab el-Mandeb Nov 2025 vs. Nov 2023 | Down 52% by volume count; -61% by capacity |
| Bab el-Mandeb Nov 2025 vs. Nov 2024 | +19% year-over-year improvement |
| Consecutive Months Above 2024 Levels | Six consecutive months (June–November 2025) — traffic appeared to be bottoming out |
| Recovery Drivers (Nov 2025) | Bulk carriers and tankers on spot market — more pricing flexibility than container lines |
| Container Ship Return (Nov 2025) | Still limited — major carriers cautious; BIMCO: Houthi threat “has not changed significantly” |
| Current Status (March 2026) | Partial recovery halted — Iran war and IRGC threats renewed concern |
| Cape of Good Hope Oil Traffic (H1 2025) | ~9.1 million bpd — +45% vs. pre-crisis normal |
| Container Trade at Risk (Dual Chokepoint) | ~30% of global container shipping blocked from normal routing if both Hormuz and Bab el-Mandeb closed |
| Combined Daily Trade at Risk (Dual Closure) | ~$10 billion per day — Middle East Insider March 29, 2026 |
| Iran Hormuz Effect on Bab el-Mandeb (March 2026) | +3 to 4 additional tankers per day as Hormuz traffic diverts — ING bank economist Rico Luman |
| Global Trade Share by Value | ~12% of global trade by value transits Bab al-Mandeb annually |
Source: Lloyd’s List Intelligence December 4, 2025; MacroMicro/IMF data (2 weeks ago); Al-Monitor March 27, 2026; Middle East Insider March 29, 2026; Anadolu Agency 3 weeks ago; Britannica March 30, 2026 (7 hours ago)
The November 2025 figure of 1,128 monthly transits — celebrated at the time as the highest traffic level since January 2024 — now looks, in retrospect, like the high-water mark of a partial recovery halted in its tracks by the February 28, 2026 outbreak of the Iran war. Lloyd’s List’s cautious December 2025 commentary — noting BIMCO’s warning that the Houthi threat “has not changed significantly” — proved prescient. The six consecutive months of year-over-year improvement gave way to renewed uncertainty as the IRGC threatened the strait directly and the same geopolitical dynamics that drove the original Houthi attack campaign reasserted themselves in a more acute form. The partial recovery is effectively frozen in March 2026, with shipping companies that were cautiously testing the Red Sea route retreating to the Cape of Good Hope calculation they know and can price with confidence.
The Lloyd’s List finding that bulk carriers and tankers on spot markets were driving the November 2025 recovery — while container lines remained absent — captured a structural division in shipping market risk tolerance that persists into 2026. Container lines have committed schedules, port call obligations, and cargo liability arrangements that make even a small probability of attack economically unacceptable. This is why the major container alliances — Maersk, MSC, CMA CGM, Hapag-Lloyd — maintained Cape routings throughout the partial recovery period, and why any scenario reactivating Houthi operations under IRGC direction will extend the container shipping diversion indefinitely.
Bab el-Mandeb Strategic and Military Statistics in 2026
| Strategic / Military Metric | Data / Detail |
|---|---|
| US Military Base — Djibouti | Camp Lemonnier — largest US military base in Africa — adjacent to Djibouti-Ambouli airport |
| French Military Base — Djibouti | French Foreign Legion base — significant NATO-allied military presence |
| Chinese Military Base — Djibouti | China opened its first overseas military base here in 2017 — a few km from Camp Lemonnier |
| EU Naval Operation | Operation Aspides — launched 2024 to protect Red Sea shipping from Houthi attacks |
| US-Led Operation | Operation Prosperity Guardian — launched December 2023; multinational naval escort mission |
| Houthi Weapons Capability (March 2026) | Anti-ship ballistic missiles, cruise missiles, one-way attack drones — 200 km effective range |
| Houthi Attack Campaign Duration | Late October 2023 — still ongoing threat despite May 2025 ceasefire |
| May 2025 Ceasefire | US-Houthi ceasefire — attacks largely subsided; traffic partially recovered by November 2025 |
| Iran IRGC Threat (March 2026) | IRGC will target Red Sea shipping if US attempts ground operation or naval pressure on Iran |
| Houthi Reactivation Risk (March 2026) | IRGC “may ask its Houthi allies to block Bab el-Mandeb” — Britannica, March 30, 2026 (7 hours ago) |
| Iran Military Official Quote | “Iran has both the will and the capability to pose a fully credible threat against it” |
| No Viable Container Bypass | Unlike Hormuz, no pipeline alternative exists for container vessels — Cape only option |
| Saudi Oil Bypass Only | Saudi East-West Pipeline + Yanbu = oil bypass; containers cannot use this |
| Cape of Good Hope Adds | 10–14 extra days per round trip Asia-Europe; $1 million additional fuel cost |
| Simultaneous Dual Closure Scenario | Would block ~30% of global container shipping — Middle East Insider estimate |
| Inflation Transmission | Prolonged disruption adds 0.2–0.5 percentage points to core goods inflation globally |
Source: Britannica March 30, 2026 (updated 7 hours ago); Al-Monitor March 27, 2026; Middle East Insider March 29, 2026; EIA; Wikipedia Bab el-Mandeb; Lloyd’s List December 4, 2025
The United States military base at Camp Lemonnier in Djibouti — the largest American base on the African continent — is positioned at almost the exact geographic point of maximum strategic leverage over the Bab el-Mandeb. It has served as the primary staging ground for U.S. counterterrorism operations across East Africa and the Arabian Peninsula, drone operations over Somalia and Yemen, and the naval component of Operation Prosperity Guardian’s Red Sea escort missions. The French base provides another Western military presence, and China’s 2017 decision to establish its first overseas military base in Djibouti — just a few kilometers from Camp Lemonnier — created a geographic juxtaposition unique in the world: two great-power military rivals sharing the same small harbor city that controls access to one of the planet’s most critical shipping chokepoints. In 2026, with the IRGC threatening the strait and Houthi forces still capable of resuming attacks, the question of whose military assets can most effectively protect — or threaten — the Gate of Tears is no longer theoretical.
The dual-chokepoint scenario being actively analyzed by shipping markets and defense planners as of March 30, 2026 represents the tail risk that has moved from academic war-gaming to live operational planning. Houthi forces in Yemen — operating under IRGC strategic direction, equipped with Iranian weapons of 200 km range effective against all vessels in the southern Red Sea approaches — remain the instrument of a potential Bab el-Mandeb blockade. Combined with the simultaneous Hormuz blockade that Iranian naval forces are prosecuting, the scenario of ~30% of global container shipping blocked from normal routing and ~22% of global oil supply threatened is now within the decision-making horizon of multiple governments. The Gate of Tears has been strategically significant since ships first sailed between Africa and Arabia. In March 2026, its strategic significance has never been higher.
Bab el-Mandeb Economic Impact Statistics in 2026
| Economic Impact Metric | Data / Statistic |
|---|---|
| Global Trade by Value Through Strait (Annual) | ~12% of global trade by value — approximately $1+ trillion annually |
| Excess Shipping Costs — Cape Diversion (2025–2026) | $7–9 billion per year above normal routing costs |
| Combined Daily Trade at Risk (Dual Closure) | ~$10 billion per day — Middle East Insider March 29, 2026 |
| Core Goods Inflation Impact | +0.2–0.5 percentage points globally from sustained disruption |
| Shipping Rate Beneficiaries | Bulk carriers, tankers — elevated rates from longer Cape voyages (more vessel-days = more revenue) |
| Tanker Stock Winners | Frontline (FRO), Nordic American Tankers (NAT) benefited from elevated rate environment |
| Container Rate Impact | Asia-Europe rates elevated 2024–2025; normalizing as Cape diversion became standard routing |
| Suez Canal Revenue Loss (Egypt) | Egypt suffered ~$7 billion annual revenue loss as Suez transits halved — from record $9.4B to near-decade lows |
| Blank Sailings Impact | Container lines canceled thousands of sailings in 2024 — affected global retail inventory cycles |
| Djibouti Port Revenue | Container transshipment volumes significantly reduced — East African trade disrupted |
| Saudi Yanbu Revenue Impact | Tripled export volume as Hormuz closed — Yanbu port revenues surged |
| World Bank (Historical Context) | Estimated ~$25 billion monthly impact if strait fully closed — historical study |
| Insurance Surcharges (Red Sea) | War risk premiums remain elevated — added per-transit cost reducing commercial viability |
| Cape Route Volume Increase | Cape of Good Hope oil traffic +45% to 9.1 million bpd in H1 2025 — peak for this alternative route |
| Asia-Europe Container Days Added | 10–14 additional days per round trip — approximately +20% longer voyage time |
| Embedded Inflation in Consumer Goods | Shipping cost increases from 2024–2026 contributing measurably to global goods price inflation |
Source: Middle East Insider March 29, 2026; Al-Monitor March 27, 2026; EIA; MacroMicro/IMF; Britannica March 30, 2026; Lloyd’s List December 4, 2025; Anadolu Agency 3 weeks ago; Rystad Energy via Al-Monitor
The Egypt Suez Canal revenue collapse — from a record approximately $9.4 billion annually in FY2023 to near-decade lows in 2024–2025 as Suez transits fell by more than half — is the most tangible national economic casualty of the Houthi disruption campaign. Egypt receives approximately $7–9 billion in annual canal toll revenue in normal years; at roughly half the transit volume, that revenue has been cut proportionately, creating a fiscal pressure that compounds Egypt’s pre-existing economic challenges with IMF debt restructuring, food price inflation, and reduced tourism. The Bab el-Mandeb disruption is therefore not merely an abstract global trade problem — it is a direct cause of a specific allied-nation fiscal crisis affecting a country whose strategic importance to U.S. policy includes the Suez Canal, the Egypt-Israel peace treaty, and regional stability across the Arab world.
The $10 billion per day estimate of combined trade at risk in a simultaneous Hormuz-plus-Bab el-Mandeb dual closure scenario — calculated by the Middle East Insider’s March 29, 2026 analysis — is the number driving insurance pricing, shipping strategy, and U.S. military posture simultaneously in the final days of March 2026. Oil traders are pricing the risk premium into forward contracts. Container lines are extending Cape routings as their default. U.S. defense planners are factoring the dual-chokepoint scenario into military options being presented at the highest levels of government. And the Houthi forces in Yemen — operating under IRGC strategic direction, equipped with Iranian missiles and drones capable of threatening vessels across the entire southern Red Sea — remain positioned as the instrument of a blockade that could be activated on short notice. The Gate of Tears has been warning the world about its own precariousness since 2023. In March 2026, that warning has never been more urgent.
Disclaimer: The data research report we present here is based on information found from various sources. We are not liable for any financial loss, errors, or damages of any kind that may result from the use of the information herein. We acknowledge that though we try to report accurately, we cannot verify the absolute facts of everything that has been represented.