Australia Tariffs in 2025
The trade relationship between Australia and the United States underwent significant changes in 2025, marking a pivotal year for bilateral commerce. Following the implementation of new tariff policies, Australian businesses and exporters have faced unprecedented challenges in accessing the American market. The new tariff structure represents a departure from the traditionally favorable trade arrangements that existed under the U.S.-Australia Free Trade Agreement, fundamentally altering the economic landscape for both nations.
The 2025 tariff implementation has created ripple effects across multiple sectors of the Australian economy, from mining and agriculture to manufacturing and services. With the introduction of a 10% baseline tariff on most Australian goods entering the United States market, businesses have been forced to reassess their pricing strategies, supply chain operations, and market positioning. This comprehensive analysis examines the detailed statistics, implications, and future outlook for Australia-US trade relations in the context of these new tariff measures.
Key Australia Tariff Facts and Statistics 2025
| Trade Metric | 2024 Data | 2025 Impact | Change |
|---|---|---|---|
| Total US-Australia Goods Trade | $51.3 billion | Subject to new tariffs | Affected volume |
| US Exports to Australia | $34.6 billion | Maintained flow | +3.1% from 2023 |
| US Imports from Australia | $16.7 billion | 10% tariff applied | +4.7% from 2023 |
| US Trade Surplus with Australia | $17.9 billion | Protected by tariffs | +1.6% from 2023 |
| Baseline Tariff Rate | 0% (FTA benefits) | 10% | Effective April 5, 2025 |
| Steel & Aluminum Tariff | Variable | 25% | Effective March 12, 2025 |
| Automotive Tariff | 0% (FTA) | 25% | On passenger vehicles |
| Implementation Date | N/A | April 5, 2025 | 12:01 AM EDT |
The statistical overview reveals the dramatic shift in trade dynamics between Australia and the United States during 2025. The most significant development has been the implementation of the 10% baseline tariff affecting most Australian goods entering the US market. This represents a fundamental departure from the duty-free arrangements that previously existed under the U.S.-Australia Free Trade Agreement. The data indicates that prior to the tariff implementation, the United States maintained a substantial $17.9 billion trade surplus with Australia, with American exports to Australia totaling $34.6 billion compared to imports of $16.7 billion.
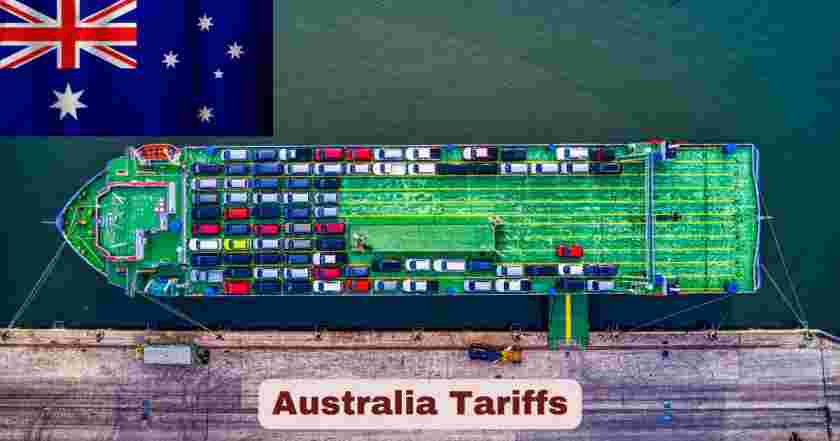
The tariff structure implemented in 2025 demonstrates a tiered approach to trade restrictions. While the baseline 10% tariff applies to most goods, specific sectors face even higher rates. Steel and aluminum products, along with their derivatives, are subject to a 25% tariff that became effective on March 12, 2025. Similarly, automotive products, including passenger vehicles such as sedans, SUVs, and crossovers, face the same 25% tariff rate. These elevated tariff rates significantly impact Australia’s traditional export strengths, particularly in the resources and automotive sectors.
Australia Import Tariff Analysis and Impact 2025
| Import Category | Pre-2025 Rate | Current 2025 Rate | Revenue Impact |
|---|---|---|---|
| General Goods | 0% (FTA) | 10% | $1.67 billion potential |
| Steel Products | 0-2% | 25% | Sector-specific |
| Aluminum Products | 0-2% | 25% | Sector-specific |
| Automotive | 0% | 25% | High-value impact |
| Agricultural Products | Variable | 10% + existing | Compound effect |
| Mining Equipment | 0% | 10% | Equipment costs rise |
| Technology Goods | 0% | 10% | Innovation sector |
| Consumer Products | 0% | 10% | Retail price impact |
The import tariff structure for Australia in 2025 represents a comprehensive overhaul of the existing trade framework. The implementation of these tariffs has created a multi-layered impact on Australian exporters seeking to access the American market. The 10% baseline tariff now applies to approximately 99% of consumer and industrial goods that previously enjoyed duty-free status under the Free Trade Agreement. This change has immediate implications for pricing competitiveness and market access for Australian businesses.
The sectoral analysis reveals that certain industries face disproportionate challenges under the new tariff regime. The 25% tariff on steel and aluminum products affects Australia’s significant mining and metals sector, which has traditionally been a cornerstone of bilateral trade. Similarly, the automotive sector, despite its smaller scale in Australian exports to the US, faces substantial barriers with the 25% automotive tariff. The agricultural sector experiences a compound effect, as the new 10% baseline tariff applies in addition to any existing agricultural duties, creating multiple layers of trade barriers for farmers and food exporters.
Australia Export Trade Patterns and Tariff Impact 2025
| Export Sector | 2024 Value | Tariff Rate 2025 | Estimated Impact |
|---|---|---|---|
| Mining Products | $8.2 billion | 10-25% | Significant reduction |
| Agricultural Goods | $3.1 billion | 10% | Price competitiveness |
| Manufactured Goods | $2.8 billion | 10% | Cost structure impact |
| Technology Products | $1.4 billion | 10% | Innovation exports |
| Automotive Parts | $0.9 billion | 25% | Severe disruption |
| Services (Digital) | $0.8 billion | 0% | Unaffected |
| Chemicals | $0.7 billion | 10% | Pricing pressure |
| Food Products | $0.6 billion | 10% | Consumer impact |
Australia’s export profile to the United States reveals the extensive reach of the 2025 tariff implementation across virtually all goods sectors. The mining products sector, valued at approximately $8.2 billion, faces the most significant challenges due to the variable tariff rates of 10-25% depending on the specific product classification. This sector includes iron ore, coal, gold, and other mineral exports that have traditionally formed the backbone of Australia-US trade relations.
The agricultural sector, with exports valued at $3.1 billion, now confronts the 10% baseline tariff that directly impacts the competitiveness of Australian food products in the American market. This includes beef, wheat, dairy products, and specialty agricultural commodities. Manufactured goods, representing $2.8 billion in trade value, experience across-the-board cost increases due to the tariff implementation. The technology sector, despite its smaller $1.4 billion contribution, faces particular challenges as the 10% tariff affects innovation-driven exports that rely on competitive pricing to penetrate market segments.
Australia’s Top 10 Trade Partners and Revenue Impact 2025
| Country | Total Trade Value | Export Revenue | Import Value | Trade Balance |
|---|---|---|---|---|
| China | $219.8 billion | $122.0 billion | $97.8 billion | +$24.2 billion |
| Japan | $89.4 billion | $67.3 billion | $22.1 billion | +$45.2 billion |
| United States | $51.3 billion | $34.6 billion | $16.7 billion | +$17.9 billion |
| South Korea | $47.2 billion | $29.8 billion | $17.4 billion | +$12.4 billion |
| India | $45.9 billion | $35.5 billion | $10.4 billion | +$25.1 billion |
| Singapore | $31.7 billion | $18.9 billion | $12.8 billion | +$6.1 billion |
| United Kingdom | $28.3 billion | $19.4 billion | $8.9 billion | +$10.5 billion |
| Thailand | $24.8 billion | $12.1 billion | $12.7 billion | -$0.6 billion |
| Germany | $22.9 billion | $8.7 billion | $14.2 billion | -$5.5 billion |
| New Zealand | $19.8 billion | $11.2 billion | $8.6 billion | +$2.6 billion |
Australia’s trading relationships in 2025 demonstrate the country’s continued reliance on Asian markets, with the top five trading partners all located in the Asia-Pacific region. China remains Australia’s largest trading partner with total trade valued at $219.8 billion, comprising $122.0 billion in Australian exports and $97.8 billion in imports. This relationship generates a substantial $24.2 billion trade surplus for Australia, highlighting the economic significance of the China-Australia commercial relationship despite periodic diplomatic tensions.
Japan maintains its position as Australia’s second-largest trading partner with $89.4 billion in total trade, generating a remarkable $45.2 billion trade surplus. This relationship is particularly significant given Japan’s consistent demand for Australian resources, especially iron ore and coal exports valued at $67.3 billion. The United States ranks third with $51.3 billion in total trade, though the implementation of 2025 tariffs threatens to significantly alter this relationship and Australia’s $17.9 billion trade surplus with America.
Australia Steel and Aluminum Tariff Regulations 2025
| Metal Product Category | Tariff Rate | Implementation Date | Trade Volume Affected |
|---|---|---|---|
| Steel Products | 25% | March 12, 2025 | $2.1 billion annually |
| Aluminum Products | 25% | March 12, 2025 | $1.8 billion annually |
| Steel Derivatives | 25% | March 12, 2025 | Significant percentage |
| Aluminum Derivatives | 25% | March 12, 2025 | High metal content |
| Fabricated Steel | 25% | March 12, 2025 | Value-added products |
| Aluminum Alloys | 25% | March 12, 2025 | Specialized products |
| Steel Wire Products | 25% | March 12, 2025 | Industrial applications |
| Aluminum Sheets | 25% | March 12, 2025 | Construction materials |
The steel and aluminum tariff regulations implemented in 2025 represent one of the most significant trade barriers affecting Australian exports to the United States. The 25% tariff rate applies comprehensively to steel and aluminum products and their derivatives, creating substantial cost increases for American importers of Australian metals. The implementation date of March 12, 2025, preceded the general 10% baseline tariff by several weeks, indicating the priority placed on protecting American steel and aluminum industries.
The scope of products affected by the 25% tariff extends beyond basic steel and aluminum to include derivatives and products with significant metal content. This comprehensive approach means that value-added Australian steel and aluminum products face the same prohibitive tariff rates as raw materials. The impact on trade volume is substantial, with steel products representing approximately $2.1 billion in annual trade value and aluminum products accounting for $1.8 billion. The tariff structure effectively doubles or triples the cost disadvantage for Australian metal exporters competing in the American market, fundamentally altering the economic viability of these trade relationships.
Australia Automotive Sector Tariff Impact 2025
| Vehicle Category | Pre-2025 Tariff | 2025 Tariff Rate | Market Impact |
|---|---|---|---|
| Passenger Sedans | 0% | 25% | Severe pricing impact |
| SUVs | 0% | 25% | Market access limited |
| Crossover Vehicles | 0% | 25% | Competitive disadvantage |
| Commercial Vehicles | 0% | 25% | Fleet sales affected |
| Automotive Parts | 0% | 25% | Supply chain disruption |
| Electric Vehicles | 0% | 25% | Innovation sector hit |
| Hybrid Vehicles | 0% | 25% | Environmental impact |
| Luxury Vehicles | 0% | 25% | Premium market affected |
The automotive sector represents one of the most dramatically affected industries under the 2025 Australia tariff implementation. The 25% tariff rate on passenger vehicles, including sedans, SUVs, and crossovers, creates an almost insurmountable barrier for Australian automotive exports to the United States. This tariff level effectively prices most Australian vehicles out of competitive consideration in the American market, representing a complete transformation from the duty-free status these products enjoyed under the Free Trade Agreement.
The comprehensive nature of the automotive tariffs extends beyond finished vehicles to include automotive parts and components, creating supply chain disruptions throughout the industry. Australian manufacturers who previously integrated their operations with American automotive production now face 25% cost increases on their exports, fundamentally altering the economics of cross-border automotive trade. The impact is particularly significant for electric and hybrid vehicles, where Australian innovation and manufacturing capabilities had been gaining traction in the American market. The tariff implementation effectively halts this progress and forces a complete reassessment of market entry strategies for Australian automotive companies.
Australia Agricultural Products Tariff Framework 2025
| Agricultural Category | Base Tariff 2024 | Additional 2025 Tariff | Total Impact |
|---|---|---|---|
| Beef Products | 0% | +10% | 10% total |
| Wheat Exports | Variable | +10% | 10% + existing |
| Dairy Products | 0-2% | +10% | 10-12% total |
| Lamb Products | 0% | +10% | 10% total |
| Wine Exports | 0% | +10% | 10% total |
| Fresh Produce | Seasonal | +10% | 10% + seasonal |
| Processed Foods | 0-5% | +10% | 10-15% total |
| Seafood Products | 0% | +10% | 10% total |
The agricultural sector faces a complex tariff environment in 2025, with the 10% baseline tariff applying as an additional layer to existing agricultural duties and seasonal variations. This creates a compound effect that significantly impacts the competitiveness of Australian agricultural products in the American market. Beef products, which previously enjoyed duty-free access under the Free Trade Agreement, now face a 10% tariff that directly affects pricing for American consumers and reduces profit margins for Australian exporters.
The wine industry exemplifies the challenges facing Australian agricultural exporters under the new tariff regime. Australian wine, which had gained significant market share in the United States due to competitive pricing and quality, now faces a 10% cost disadvantage that affects its position relative to domestic American wines and wines from other countries not subject to similar tariffs. The dairy sector experiences a particularly complex impact, as the 10% baseline tariff combines with existing dairy duties to create total tariff rates of 10-12%, substantially affecting the competitiveness of Australian dairy products in American supermarkets and food service establishments.
Australia Technology and Innovation Sector Tariffs 2025
| Technology Category | 2024 Status | 2025 Tariff Rate | Innovation Impact |
|---|---|---|---|
| Software Hardware | Duty-free | 10% | Cost competitiveness |
| Telecommunications Equipment | 0% | 10% | Infrastructure costs |
| Medical Devices | 0% | 10% | Healthcare innovation |
| Renewable Energy Tech | 0% | 10% | Clean energy transition |
| Mining Technology | 0% | 10% | Resource sector innovation |
| Agricultural Technology | 0% | 10% | Farming innovation |
| Defense Technology | Variable | 10% | Security cooperation |
| Fintech Products | 0% | 10% | Financial innovation |
The technology and innovation sector represents a critical area where the 2025 tariff implementation has significant implications for future economic development and bilateral cooperation. Australian technology companies, which had previously benefited from duty-free access to the American market, now face a 10% cost disadvantage that affects their ability to compete with domestic American technology firms and international competitors from countries not subject to similar tariffs.
The renewable energy technology sector faces particular challenges, as the 10% tariff on clean energy innovations occurs at a time when both countries are pursuing aggressive climate change mitigation strategies. Australian companies specializing in solar technology, wind energy equipment, and battery storage systems now find their products less competitive in the American market, potentially slowing the adoption of clean energy technologies. The medical device sector also experiences significant impact, as the 10% tariff on Australian medical innovations affects healthcare costs and the pace of medical technology adoption in American healthcare facilities.
Australia Mining Equipment and Resources Tariff Analysis 2025
| Mining Category | Export Value 2024 | 2025 Tariff Rate | Competitive Impact |
|---|---|---|---|
| Mining Machinery | $1.2 billion | 10% | Equipment cost increase |
| Iron Ore | $2.8 billion | 10% | Raw material pricing |
| Coal Exports | $1.9 billion | 10% | Energy sector impact |
| Gold Products | $1.1 billion | 10% | Precious metals trade |
| Copper Products | $0.8 billion | 10% | Industrial metals |
| Nickel Exports | $0.6 billion | 10% | Battery materials |
| Lithium Products | $0.4 billion | 10% | Energy storage |
| Rare Earth Elements | $0.3 billion | 10% | Technology materials |
The mining sector represents Australia’s largest export category to the United States, with total mining-related exports valued at approximately $8.2 billion in 2024. The implementation of the 10% baseline tariff across all mining products creates substantial challenges for Australian resource companies that have traditionally relied on competitive pricing to maintain market share in the American market. Iron ore exports, valued at $2.8 billion, face particular pressure as the tariff directly affects the cost competitiveness of Australian iron ore relative to domestic American sources and alternative international suppliers.
The coal export sector, with $1.9 billion in trade value, confronts the 10% tariff at a time when energy markets are already experiencing significant volatility. The additional cost burden affects the competitiveness of Australian coal in American power generation and steel production. Gold products, representing $1.1 billion in exports, experience pricing pressure that affects both industrial applications and investment demand. The emerging critical minerals sector, including lithium and rare earth elements essential for renewable energy and technology applications, faces barriers that potentially impact supply chain security for American industries dependent on these materials.
Australia Consumer Goods and Retail Tariff Effects 2025
| Consumer Category | Pre-2025 Access | 2025 Tariff Impact | Retail Price Effect |
|---|---|---|---|
| Clothing and Textiles | Duty-free | +10% | Direct consumer impact |
| Home Goods | 0% | +10% | Household budgets |
| Sports Equipment | 0% | +10% | Recreation costs |
| Personal Care | 0% | +10% | Daily essentials |
| Electronics | 0% | +10% | Technology access |
| Furniture | 0% | +10% | Home furnishing |
| Toys and Games | 0% | +10% | Children’s products |
| Books and Media | 0% | +10% | Educational materials |
Consumer goods represent a significant portion of Australia-US trade that directly affects American households through retail pricing. The 10% tariff on Australian consumer products translates directly to price increases for American consumers, affecting everything from clothing and home goods to electronics and recreational equipment. Australian brands that had established market presence in American retail channels now face the challenge of maintaining competitiveness while absorbing or passing through the tariff costs.
The retail sector impact extends beyond immediate price effects to include supply chain adjustments and inventory management challenges. American retailers who had developed long-term relationships with Australian suppliers now must reassess their sourcing strategies, potentially seeking alternative suppliers from countries not subject to similar tariffs. This creates disruption in established business relationships and affects the reliability of supply chains that American consumers have come to depend upon for consistent product availability and pricing.
Future Outlook: Australia Trade Relations and Tariff Projections 2025
The 2025 tariff implementation represents a fundamental shift in Australia-US trade relations that will likely have lasting effects on bilateral economic cooperation. The comprehensive nature of the tariffs, affecting virtually all goods categories, suggests a long-term restructuring of trade patterns rather than temporary market adjustments. Australian businesses are already beginning to explore alternative markets and supply chain configurations to mitigate the impact of reduced competitiveness in the American market.
The economic implications extend beyond immediate trade statistics to include broader strategic considerations about supply chain security, resource access, and technological cooperation. The $51.3 billion in total trade between the countries will likely see significant restructuring as both nations adapt to the new tariff environment. Australian policymakers are actively engaging in diplomatic efforts to address the trade barriers while simultaneously developing strategies to diversify export markets and reduce dependence on the American market for key sectors affected by the tariffs.
The long-term outlook suggests that the 2025 tariff implementation may accelerate Australia’s economic pivot toward Asian markets and strengthen trade relationships with countries that maintain more favorable trade terms. This geographic diversification of trade relationships could fundamentally alter Australia’s economic orientation and reduce the historical significance of the US market for Australian exporters. The success of these adaptation strategies will largely determine the ultimate economic impact of the 2025 Australia tariff implementation on both nations’ economic prosperity and bilateral relationship.
Disclaimer: The data research report we present here is based on information found from various sources. We are not liable for any financial loss, errors, or damages of any kind that may result from the use of the information herein. We acknowledge that though we try to report accurately, we cannot verify the absolute facts of everything that has been represented.


